


California and National Drought Summary for February 18, 2020
Summary
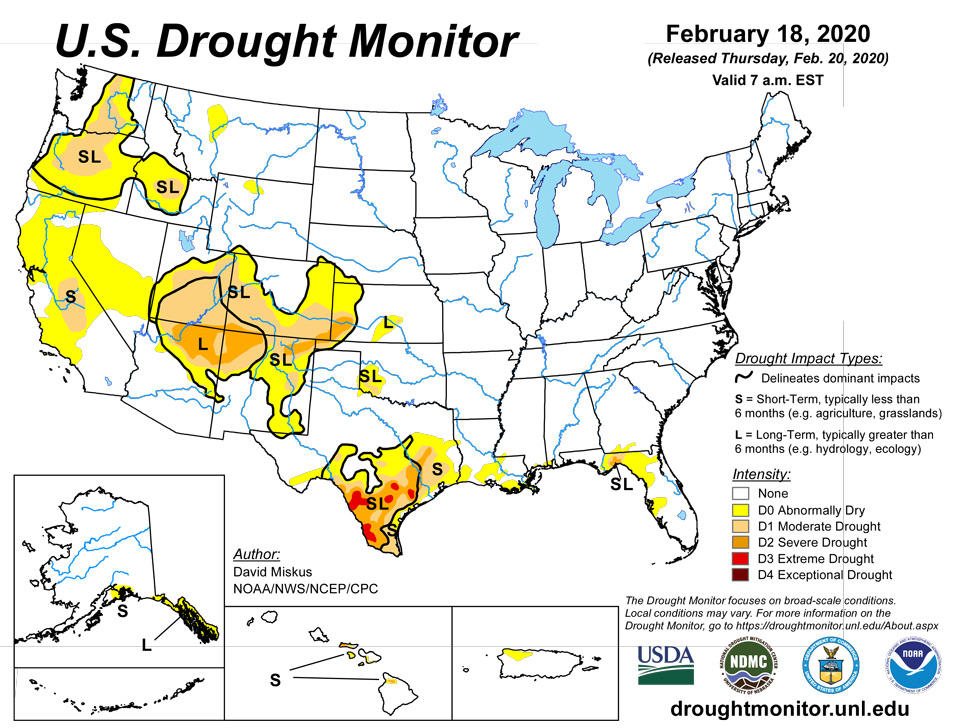
February 20, 2020 - With high pressure anchored over the eastern Pacific Ocean, storm systems bypassed California, Nevada, Arizona, and Utah, instead tracking either northward into the Pacific Northwest or southward across Baja California and into the southern Rockies. Once they reached the Nation’s mid-section, ample Gulf moisture was incorporated into the storm systems, generating widespread showers and thunderstorms in the South and Southeast, along with mixed or frozen precipitation in more northern locales. The week’s heaviest precipitation (1-4 inches) fell on western sections of Washington and Oregon, parts of the Rockies, and in the southern Great Plains, lower Mississippi, Tennessee, and Ohio Valleys, Southeast, and Appalachians. Weekly temperatures averaged below normal in Alaska and across much of the North-Central States as Arctic air brought sub-zero readings to most of the Midwest Thursday and Friday. In contrast, above-normal readings encompassed the Southeast, mid-Atlantic, and portions of the Far West.
Northeast
Although 30- to 60-day precipitation totals were around 70-80% of normal in portions of eastern New England, light precipitation (0.5-1.5 inches) fell on these driest areas this week, effectively halting any potential D0 development. Along with it being the non-growing season (no evapotranspiration), seasonable (cold) weekly temperatures, a decent snow cover across northern sections, USGS average stream flows near or above-normal, and no obvious drought or dryness impacts all confirmed that no D0 or drought should be depicted.
Southeast
Moderate to heavy rain (1.5-4.5 inches) fell for the second consecutive week across much of the Southeast, further soaking the soils and causing rivers to reach much-above or near-record high flows in the northern halves of Alabama and Georgia, most of South Carolina, western North Carolina, and southern Virginia. This was most notable at the 7-, 14-, and 28-day USGS average stream flows as the 1-day and instantaneous time scales had reduced (but still above-normal) values. In sharp contrast, areas along the eastern Gulf and southern Atlantic Coasts (mainly Florida) only received scattered lighter amounts (less than an inch). The D0 and D1 in Florida and extreme southwestern Alabama remained, although a few reductions in the D0 areas were made in northeastern and central Florida where enough rain fell. These D0s were also redrawn to reflect the largest short-term deficits and SPIs, along with lower USGS stream flows (<25th percentile). In the north-central Florida Panhandle, D2 was introduced to the counties of Wakulla, Leon, and Jefferson as the heaviest precipitation has largely bypassed this area during the past year, resulting in a 20.18 inch annual deficit at Tallahassee, FL, for 2019. Total precipitation last year was 39.05 inches compared to a normal of 59.23 inches. Since Jan. 1, 2020, Tallahassee is already 4.20 inches below normal (3.06” vs 7.26” as of Feb. 18). In a weird twist due to the heavy upstream rainfall, smaller local rivers in the 3 Florida counties were at near-record low levels while the much larger Apalachicola River just to the west was at near-record high levels.
South
Heavy rains (2-5 inches) fell from central Texas northeastward into southwestern Arkansas, across northern Louisiana, and from west-central Mississippi northeastward into central Tennessee. Light to moderate amounts (0.5-2 inches) were reported in northern and eastern Texas, eastern Oklahoma, and the remainder of Arkansas, Louisiana, Mississippi, and Tennessee. Little or no precipitation occurred in western portions of Texas and Oklahoma, and across southern and southeastern Texas. Weekly temperatures were seasonable in western and northern sections of the South, and above-normal along the central Gulf Coast. With the heavy rain that fell across central and northeastern Texas, a broad 1-category improvement was made, including some 2-category reductions (D2 to D0; D1 to nothing) in northeastern Texas where the amounts were the greatest. Elsewhere, some of the D0 and D1 was erased in northern Texas and southwest Oklahoma that incorporated precipitation over the past 2-week period; the D0 in southwest Arkansas was removed; and some D0 was alleviated in Louisiana and southern Mississippi where the totals exceeded an inch. In contrast, very dry weather the past 30- to 60-days in southern Texas, combined with above-normal temperatures, warranted a broad 1-category degradation in many southern and southeastern sections of the state. Deficits at 30-days reached 0.5-1.5 inches and 1.5-3 inches in southern and southeastern portions, and at 60-days, shortages were 1-2 inches and 2-4 inches, respectively. D3 was added or expanded where the short- and medium-range tools (3-, 6-, and 9-months) were the driest, along with corresponding to low values (less than tenth percentile) on the USGS average stream flows. D0 was also expanded into extreme southwestern Louisiana where little or no rain fell and short-term deficiencies grew.
Midwest
Similar to the Northeast, short-term (30-days) precipitation deficits existed, but near to surplus precipitation is common across the Midwest at longer time periods (2-months and longer), thus no drought or D0 was depicted. In addition, snow covered much of the upper Midwest and Great Lakes region, and with subnormal temperatures this week, the ground and smaller rivers were frozen in many northern locations. This region could actually use some dryness and warmth to get the fields primed for spring preparation and planting.
High Plains
Little or no precipitation was recorded across the northern and central Plains, although scattered light totals occurred in parts of the northern and central Rockies. The past 30-days have been drier than normal, but January and February precipitation climatologies are normally dry, and temperatures have been below normal the past 2 weeks. From 3-months and longer, however, wet conditions prevailed throughout much of the northern and central Plains, and with low temperatures, the non-growing season, and frozen and snow-covered ground in the north, drought and D0 was limited to southern areas (Kansas and Colorado), along with smaller D0 areas in northern Wyoming and western Montana. In south-central Kansas, light precipitation (0.25-1 inch) was enough to ease drought and dryness, while decent snowfall in central Colorado brought most indices close to normal, thus eliminating D0 in Lake County. In western Wyoming’s Teton County, 0.5-2 inches of precipitation boosted SNOTEL WYTD basin average precipitation and SWC to near-normal (97%) and above-normal (112%) levels, respectively, eliminating the D0 there. Light precipitation in northern Wyoming’s Big Horn County also decreased D0 along its eastern edges. In contrast, D0 expanded somewhat in western Montana as 30- and 60-day indices were very low (dry), but WYTD values were close to normal. Fortunately, SNOTEL WYTD basin average SWC has remained above normal.
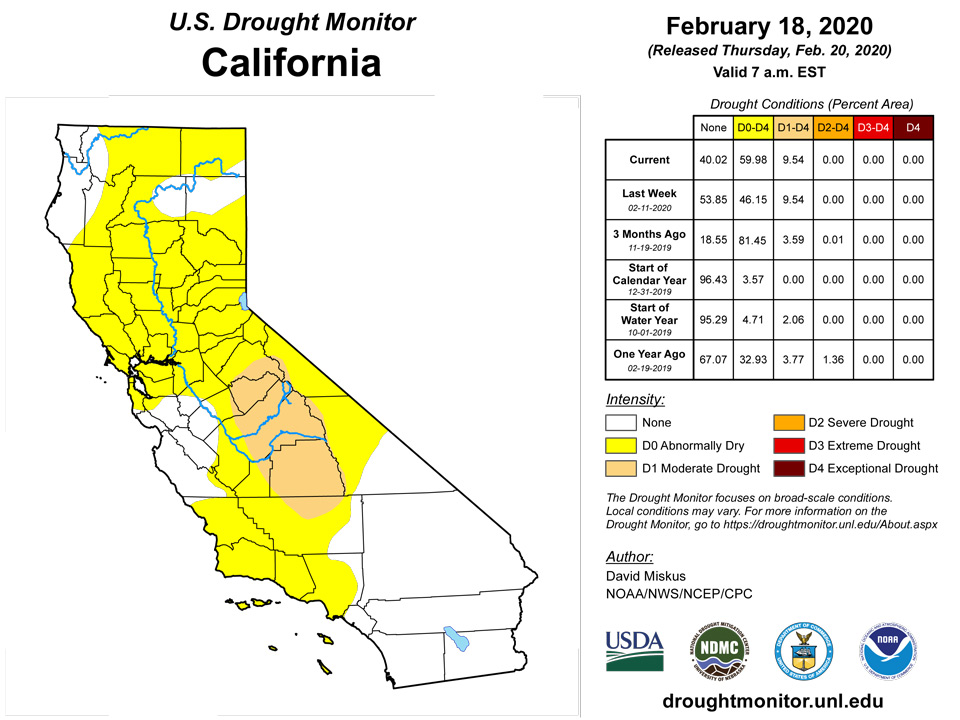
West
High pressure off the California coast kept much of California, Nevada, Arizona, and Utah precipitation-free this week, with above-normal temperatures in California. Instead, Pacific storm systems were deflected northward or southward, allowing the Pacific Northwest to receive welcome moisture after such a dry start to the Water Year (mainly October and November 2019). The precipitation, along with enough cold air, has steadily increased the SNOTEL basin average WYTD precipitation and SWC in the Washington Cascades to near- or above-normal values, thus easing drought in western and eastern sections of the state. These values decrease as one heads southward, with SWC between 77-91% of normal in the Oregon Cascades, and dropping to between 52-71% of normal in the Sierra Nevada. In southern Idaho, light to moderate precipitation in the southwest helped to improve the D1 to D0 as SWC rose to 92% of normal. However, the SWC of the Big Lost, Big Wood, and Little Wood basins have dropped to between 58-74% of normal, with WYTD precipitation ranging from 52-60% of normal. Thus, D1 was expanded southward to encompass these basins, and additional deterioration may be required soon if it stays dry. Since many changes were made last week, only minor modifications were made to the Far West this week. This included bridging the D0 gap in northern California as conditions were similar to the two D0 areas to the north and south; slightly expanding D1 into central Oregon while improving D1 to D0 and D0 to nothing in eastern Oregon; slightly retreating the D0 and D1 in the northern Oregon and Washington Cascades eastward as another round of decent precipitation fell there, increasing both the SNOTEL WYTD basin average precipitation and SWC; and slightly readjusting the D1 area in central Washington eastward to better reflect where the driest indices were. In the Southwest, a southern tracking storm system brought welcome precipitation to southern Arizona and most of New Mexico over the 2-week period, allowing for 1-category improvements (D0 to nothing) in southwestern and southeastern New Mexico, along with some slight D1 improvements in central and east-central sections. The balancing between the poor 2019 summer monsoon versus favorable 2019-2020 winter precipitation was taken into account. The northern areas (D2) were left unchanged this week since they was hit harder by the weak summer and fall monsoon, and because the WYTD basin average precipitation has been below-normal (73-94%), while southern areas were at or above-normal (95-144%). Elsewhere, no changes were made, although the boundary between the short-term (S) versus short and long-term (SL) impacts were differentiated in the Far West with impact lines.
Alaska, Hawaii, and Puerto Rico
In Alaska, light to moderate precipitation fell along the southern coasts [0.5-2 inches in the west (Aleutians), 1-5 inches in the southeastern Panhandle], and weekly temperatures remained well below-normal, especially in the interior, northern, and eastern sections, so interior precipitation mainly fell as snow. Lows dropped below -50 degree F in many northern and eastern interior sections. The newly-added D0 area in south-central Alaska was trimmed north of Anchorage as updated information indicated Feb. 1 SWE was at 100-140% of normal. The southeastern Panhandle remained at D0(L), although conditions have slowly improved with increased precipitation and lower temperatures so far this year.
According to the Hawaiian FSA, improvements in Maui pastures from rains over the past several weeks were enough for a 1-category reduction in drought island-wide. Elsewhere, status-quo was recommended for the other Hawaiian islands until additional impact reports come in.
The D0 in northwestern Puerto Rico was slightly expanded outward as another dry week increased short-term deficits there. Except for portions of the southern coast, the rest of the island experienced scattered, light to moderate weekly rainfall which maintained adequate short-term moisture at 30-, 60-, and 90-days.
Pacific Islands
During the Northern Hemisphere winter, the North Pacific subtropical high, and the low latitude Inter-Tropical Convergence Zone (ITCZ), migrate south toward the equator. The seasonal migration brings drier subtropical trade winds to the northern portions of Micronesia and ITCZ rainfall to the southern regions. The weather conditions across the U.S.-Affiliated Pacific Islands (USAPI) during this USDM week (2/12/20-2/18/20) reflected this pattern with dry northeast trades dominating in the north and a near-equatorial trough persisting in the south. Cold fronts approached from the north and west, but they manifested mostly as shear lines as they moved across northern and western Micronesia with dry mid-latitude air masses in their wake. A weak trade-wind disturbance developed in the near-equatorial trough south of Koror, and a weak circulation formed in the trough south of the Marshall Islands (RMI). The near-equatorial trough extended south of the equator and spread southeastward toward the Samoan Islands and beyond as the South Pacific Convergence Zone (SPCZ) monsoon trough. Circulations developed within the SPCZ as it lay near or across the Samoan Islands, with two of the circulations prompting advisories at times. These were Tropical Disturbances 93P and 96P.
Satellite-based estimates of 7-day precipitation (QPE) showed a patchy band of 1-4 inches of rainfall across southern portions of Micronesia, associated with the ITCZ, with little to no rain indicated across northern portions except for a few stripes where the shear lines triggered showers. The ITCZ rain band turned southeastward as the SPCZ toward and past the Samoan Islands which were within the 4+ inch area of a wide band of precipitation associated with the SPCZ. Samoan residents reported continuous heavy rainfall with damaging winds, especially associated with the tropical disturbances.
After two consecutive weeks of precipitation totals above 2 inches in Palau and a month-to-date precipitation total of 6.10 inches, drought classification was improved from moderate drought to abnormally dry conditions.
The Marianas had a dry week. All three stations had less than half an inch of rain for the week. Saipan had the least precipitation, receiving only 0.06 inch (ASOS: 0.03 inch; NPS: 0.09 inch), followed by Guam at 0.14 inch, and Rota at 0.29 inch. This week marked the second consecutive week for Guam and Rota having less than half an inch of rain. However, Rota’s month-to-date precipitation total is 5.15 inches, which is more than the monthly threshold of 4 inches to meet most water needs. Abnormally dry conditions persists for another week across Rota and Guam, while Saipan remains in moderate drought for another week.
During this drought week, much of the Federated States of Micronesia had dry conditions. Several locations had less than half an inch of rain, while only two stations (Kosrae and Pingelap) had a very wet week. Kosrae and Pingelap remained in drought free status as both of these stations had over 4 inches of rain for the week. Lukunoch had the least precipitation total for the week, receiving only 0.21 inch of rain. Yap (0.30 inch), Chuuk Lagoon (0.31 inch), Nukuoro (0.40 inch), and Ulithi (0.31 inch) also had less than half an inch of rain, while Kapingamarangi and Pohnpei had 0.60 inch and 0.81 inch of rain, respectively. Although this was the second consecutive week with less than an inch of rain, Chuuk Lagoon, Nukuoro, Ulithi, and Pohnpei remained in drought free status. Lukunoch’s drought status changed from abnormally dry to moderate drought after precipitation totals during six of seven consecutive weeks had less than an inch of rain. Kapingamarangi, Woleai, and Yap remained in abnormally dry conditions this week.
Another dry week affected the Marshalls Islands. The station with the least precipitation was Mili which reported no rain this week. Meanwhile, Jaluit had the most precipitation with only 0.80 inch of rain. After three consecutive weeks of little to no rain, Mili’s drought classification was changed from drought free to abnormally dry. Ailinglapalap and Jaluit remained in abnormally dry conditions. Although Majuro had 1.82 inch of rain this week, the reservoir levels were at 64.4% of the maximum capacity (as of February 19), which is below the critical 80% threshold. For this reason, Majuro's drought classification was downgraded to moderate drought. Wotje had 1.50 inches of rain this week, which is slightly below the weekly threshold of 2 inches to meet most water needs. However, precipitation totals the last five weeks have been less than an inch, with the last three weeks having no rain at all. For this reason, Wotje’s drought classification was downgraded to moderate drought. Kwajalein's drought classification remained at moderate drought.
Drought free conditions remained across American Samoa as it was another wet week. Pago Pago had 7.97 inches of rain this week, while Siufaga Ridge (4.20 inches) and Toa Ridge (4.34 inches) had over 4 inches of rain this week. Overall, Pago Pago has had 22.15 inches of rain so far for the month of February, with Siufaga Ridge and Toa Ridge having over 11 inches this month.
Virgin Islands
Drought free conditions continued across St. Thomas and St. John as precipitation totals were near or above the month-to-date and year-to-date values. SPI values for both locations indicate drought free conditions in the short and long term.
St. Croix had a total of 0.43 inch of rain at the Henry E. Rohlsen Airport and 0.41 inch at the Christiansted 1.8 ESE CoCoRaHS station this week. The month-to-date precipitation total of 0.80 inch is 76.9% of normal precipitation. Year-to-date precipitation at the airport was 3.63 inches or 114.2% of normal. SPI values at 1 and 3 months indicate drought free conditions, while the 6, 9, and 12 months SPI indicate moderate drought. For this reason, long-term moderate drought persists across St. Croix this week.
Looking Ahead
During the next 5 days (February 20-24), another round of moderate to heavy precipitation (1-3 inches) is expected for the Pacific Northwest (western Washington and Oregon, northern Idaho), the central Great Plains, and from central Texas eastward across the Southeast to the Carolina Coasts. Light to moderate amounts (0.5-1 inch) are possible in the Four Corners Region, the Rockies, western Corn Belt, and eastern sections of the Northeast. Little or no precipitation is forecast for most of California, northern Nevada and Utah, eastern Oregon, southern Idaho, across the northern Plains, upper Midwest, and Great Lakes region, and southern Florida. Temperatures should average below-normal across the Northwest, Rockies, and southern half of the contiguous U.S., and above-normal in the Southwest, northern Plains, upper Midwest, and southern Florida.
In the extended range forecast for the ensuing 5 days (February 25-29), odds favor above-normal precipitation throughout Alaska, and from the central Plains northeastward into the Great Lakes region, the western and central Gulf Coasts, and the eastern quarter of the Nation. Subnormal precipitation is favored west of the Rockies, the northern and southern Plains, and the lower Mississippi Valley. Temperatures are likely to be below-normal across much of the lower 48 States and western Alaska, with low odds for above-normal temperatures in California, the Northeast Coast, southern Florida, and south-central and southeastern Alaska.
Author(s):
David Miskus, NOAA/NWS/NCEP/CPC
Ahira Sanchez-Lugo, NOAA/NCEI
Dryness Categories
D0 Abnormally Dry—used for areas showing dryness but not yet in drought, or for areas recovering from drought.
Drought Intensity Categories
D1 Moderate Drought
D2 Severe Drought
D3 Extreme Drought
D4 Exceptional Drought
Drought or Dryness Types
S Short-Term, typically less than 6 months (e.g. agricultural, grasslands)
L Long-Term, typically greater than 6 months (e.g. hydrologic, ecologic)
Source: National Drought Mitigation Center

