


California and National Drought Summary for March 3, 2020
Summary
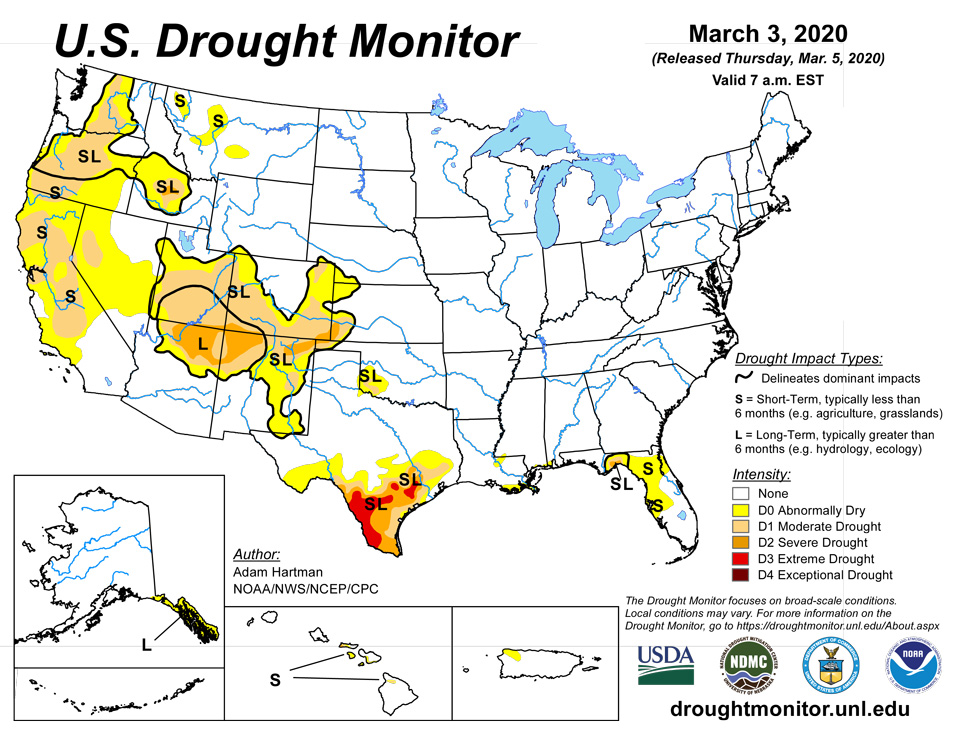
March 5, 2020 - The pattern has been less active over the CONUS over the past 7 days, with high pressure dominating over much of the western CONUS. Storm systems riding up and over the Pacific ridge resulted in some precipitation in the Pacific Northwest, but not enough to alleviate the dryness there, particularly for Oregon. Meanwhile a low-pressure system propagated northeastward along the East Coast and out of the domain early in the period, adding to surpluses in the Tennessee and Ohio Valleys. Drought continued to expand in the West, as dry conditions persisted over much of the region. Parts of Oregon and California saw increases in D0 and D1 coverage, while areas of D0 were expanded slightly in Montana. There was some D1 added to northeastern areas of Colorado (High Plains Region), as the past 60 days have seen drier than normal conditions. Drought intensification and expansion also continues in southern Texas (Southern Region), in association with continued dryness, low humidity, and high winds over the past week. The Midwest and Northeast continue to remain as is for now, as 90-day precipitation surpluses are widespread across many of these areas, with other areas near normal. Some D0 reduction in southern Georgia (Southeast Region) was made due to recent heavy rainfall. However, the Florida Peninsula saw some D0 expansion north and east of Tampa, with year-to-date (YTD) precipitation estimates between 25 and 50 percent of normal.
Northeast
Some areas of New England have seen drier than normal conditions since the start of 2020. However, February brought above normal precipitation to much of the Northeast Region, reducing deficits in some of the drier areas in New England and Maine, while adding to surpluses in others, such as western Pennsylvania and southern and western New York. The past week has seen an additional 0.5 to 1.5 inches of precipitation, with pockets of 1.5 to 2 inches, over many of the drier areas. Widespread above-average USGS stream flows are also suggestive of adequate precipitation over the region as a whole. As such, no D0 development was needed this week.
Southeast
A large swath of 1 to 2 inches of rain fell across central and eastern Mississippi, northern Alabama and Georgia, and into southern South Carolina, adding to extreme rainfall surpluses. Areas of southern Georgia saw 0.5 to 1 inches of rainfall, warranting D0 removal in southwestern portions of the state. In the Big Bend area of Florida, another 1 to 3 inches of rain fell. However, many of these D0 areas in the Big Bend are dealing with 6-month deficits of more than 5 inches. As such, there was a slight increase in D0 coverage north and east of the Tampa Bay area in favor of YTD precipitation 25 to 50 percent of normal. Areas with greater than 10 inch deficits in the Florida Panhandle have seen modest improvements in recent weeks, despite the heavy rains just to the north and high downstream flows. Although areas right along the coast, near Saint George Island, have missed out on some of the heavier precipitation amounts in recent weeks, some D0 removal up to the Apalachicola River was warranted in association with some locally heavier rainfall in portions of Calhoun, Liberty, and Gulf Counties over the past 7 and 14 day periods.
South
Drought intensification over southern Texas continued, along with expansion into adjacent coastal areas. Stream flows are below normal for many areas, and recent high winds and low humidity have enhanced surface soil moisture loss. YTD percent of normal precipitation was 25 to 50 percent for much of southern Texas, with less than 10 percent along the Rio Grande Valley. This is on top of receiving essentially no precipitation over the past 30 days, and beyond, for many areas south of the I-10 corridor. D0 remains for portions of the immediate Gulf Coast in Louisiana, Mississippi, and Alabama this week, although dryness has crept northward in these areas with the sharp north-south precipitation gradients in recent weeks.
Midwest
Some dryness was noted during the last 30 days in southern Iowa and northern Missouri, but long-term surpluses are widespread across the Midwest, so this is welcomed dryness for many areas. Sub-soil conditions are wetter than normal and USGS average stream flows were near and above normal for most of the region, thus no D0 development was required this week.
High Plains
Some D1 was added over northeast Colorado with YTD precipitation 50 to 65 percent of normal. Stream flows were also running well below normal for this area. Recent ground observations support this addition of D1. SPIs over several time periods also show deterioration. The rest of the High Plains Region has long-term surpluses of precipitation. No D0 development expansion was made elsewhere.
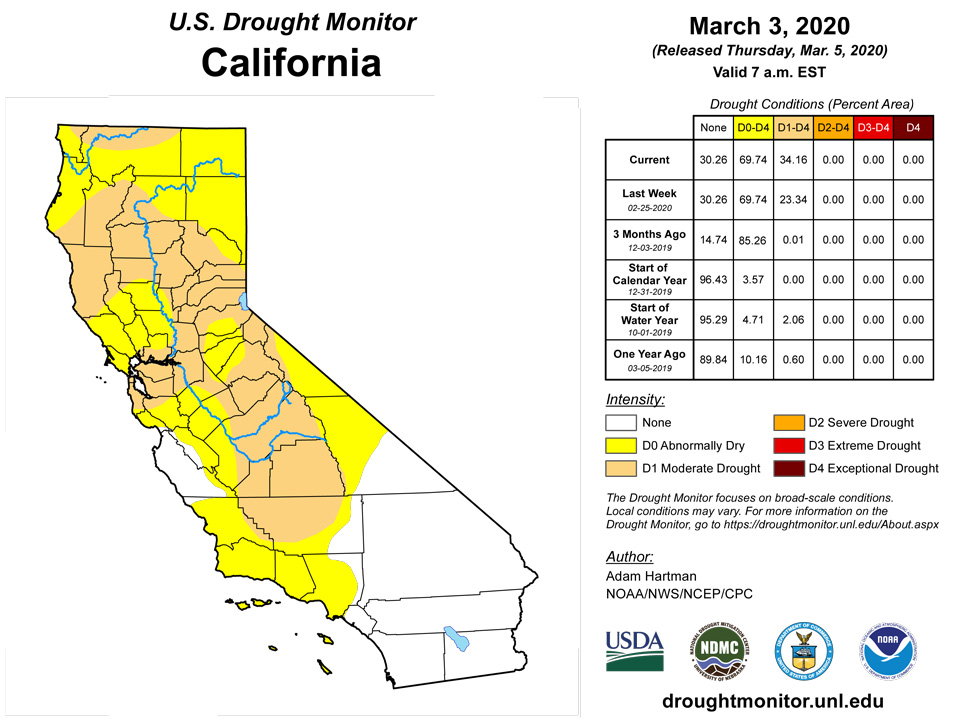
West
Westward D1 expansion into the San Francisco Bay area and Mendocino County, northward D1 expansion into Trinity and Shasta Counties, and southwestward D1 expansion into San Luis Obispo County in California was warranted in association with the continuance of a much drier-than-normal water year to date (since October 1, 2019; WYTD). Many areas are seeing WYTD precipitation of 25 to 50 percent of normal and YTD precipitation 10 to 25 percent of normal. Some locations near San Francisco saw no precipitation for the month of February. However, reservoir levels are in good shape overall across California, despite the below normal snowpack. In addition, there have been several reports of non-managed creeks and streams running dry and severe lack of vegetation, resulting in producers supplementing feed for livestock. In addition, much of the state has seen above normal temperatures over the past week, further exacerbating the dryness and reducing longevity of existing snowpack. D1 was also expanded in central and southwestern Oregon, as stream flow conditions have continued to deteriorate, precipitation was lacking, and snowpack was below normal. Many unregulated rivers have fallen below the 10th percentile (much below-normal). WYTD precipitation deficits are greater than 12 inches across much of southwestern Oregon, including coastal areas. In contrast, Washington’s March 3 basin average SWC was above normal, and has received above normal precipitation over the past 30 days, mainly concentrated in areas with no drought, but this added to the snowpack and near-normal stream flows in drought areas, leading to status quo this week. The Four Corners Region is also status quo this week as the last 14 days has seen enough precipitation to prevent deterioration, but not enough for improvement. Some D0 expansion in Montana in favor of the 90 day SPI. Some D1 expansion in western Utah into Millard County, which has seen 5 to 10 percent of normal precipitation over the past 90 days.
Alaska, Hawaii, and Puerto Rico
An active storm track over Alaska has provided above normal precipitation over the past few weeks over much of the state, with widespread areas of greater than 2 inches of precipitation extending from eastern Kenai Peninsula eastward through the Southeastern Panhandle. Despite above normal precipitation over the last month in the panhandle, D0 (L) remain unchanged this week as a result of long-term dryness (beyond 12 months).
Hawaii received most of its precipitation along the windward slopes over the past week, where no drought existed. With stream flows near normal and recent improvements made the past few weeks, it was status quo for this week.
Puerto Rico has seen some above normal precipitation (1 to 3 inches) over the past 7 days leading to some reduction along the eastern edge of the D0 area in the northwest. The area is still seeing 75 to 90 percent of normal precipitation over the past 90 days, while the most of the island has seen greater than 150 percent of normal precipitation over the same period.
Pacific Islands
During the Northern Hemisphere winter, the North Pacific subtropical high, and the low latitude Inter-Tropical Convergence Zone (ITCZ), migrate south toward the equator. The seasonal migration brings drier subtropical trade winds to the northern portions of Micronesia and ITCZ rainfall to the southern regions. The weather conditions across the U.S.-Affiliated Pacific Islands (USAPI) during this USDM week (2/26/20-3/3/20) reflected this overall pattern, with a dry season trade-wind regime dominating the Marianas and northern portions of the Federated States of Micronesia (FSM) and Marshall Islands (RMI), while troughs and weak circulations and disturbances within the ITCZ brought rain to parts of southern Micronesia. Divergence aloft aided the surface convergence associated with the southern troughs, enhancing showers. Diffuse shear lines, remnants of fronts, and end-of-week troughs extending northward from the south, brought a few showers to the Marianas. South of the equator, the South Pacific Convergence Zone (SPCZ) remained north of American Samoa with dry stable air dominating the islands.
Satellite-based estimates of 7-day precipitation (QPE) showed a narrow band of 2+ inches of rain across Palau and Yap State, a large area of 2 to over 4 inches of rain over Kosrae State and central to southern RMI, and smaller areas of 1+ inches of rain over other parts of the FSM. The eastern Micronesia 2+ inch rain band extended across the equator southeastward to north and east of American Samoa as the SPCZ. The QPE also showed areas of 2+ inches of rain west of American Samoa. Little to no rain was detected by this satellite over the Marianas and American Samoa.
February rainfall in the Marianas totaled less than 2 inches on some northern locations, including Tinian (1.90 inches, or 58% of normal) and Saipan Airport (1.77 inches, or 68%). Guam International Airport fared a little better, with a February total of 3.79 inches (84% of normal). With rainfall totaling one-half inch or less for 4 consecutive weeks at all observation sites in the Marianas, moderate drought (D1-S) was retained for Saipan, while abnormal dryness (D0-S) persisted on Rota and Guam. The Keetch-Byram Drought Index, indicative of fire danger, was reported by the National Weather Service to be 594, in the high category, on March 2.
In the Republic of Palau, a wetter weather pattern developed in late February, when convergent trade winds northeast of a trough and a weak circulation located south of the main islands of Palau generated sporadic showers and at times continuous rain. The National Weather Service office (WSO) on Koror received 2.06 inches of rain on February 28. For February, rainfall on Koror totaled 7.41 inches (78% of normal), while WSO Palau reported 10.52 inches. However, year-to-date rainfall through March 2 at WSO Koror was significantly below normal, totaling 12.50 inches (59% of normal). As a result, D0-S was retained for the Republic of Palau, pending further assessment of the effects of the recent heavy showers.
In the Federated States of Micronesia (FSM), generally wet conditions on Pohnpei, Pingelap, and Kosrae contrasted with varying degrees of dryness (D0) and drought (D1) across central and western islands. Kosrae was particularly wet, receiving 6.88 inches during the last 4 days of February and reporting a monthly sum in excess of 20 inches. February rainfall was slightly below normal on Pohnpei (8.16 inches) and Pingelap (9.10 inches), but amounts were sufficient to ward off drought concerns. Farther west, February rainfall totaled less than 4 inches at Chuuk Lagoon (2.67 inches, or 37% of normal), Lukunor (2.93 inches, or 30%), Yap (3.28 inches, or 55%), and Ulithi (3.37 inches, or 70%). Chuuk Lagoon and Ulithi remained abnormally dry (D0-S), while Lukunor and Yap retained a moderate drought (D1-S) designation. Elsewhere in the FSM, no changes were made to the depiction for Kapingamarangi (D0-S), Nukuoro (D0-S), and Woleai (D1-S); all three islands received less than 5 inches of February rainfall.
Late-February showers swept across the southern sections of the Marshall Islands, providing drought relief. February 26-29 rainfall totaled 6.45 inches on Majuro; 2.92 inches on Mili; 2.79 inches on Ailinglapalap; 1.95 inches on Kwajalein; and 1.93 inches on Jaluit. Some additional showers occurred in early March. As a result, all five island experienced improvement from moderate drought (D1-S) to abnormally dry (D0-S). Between February 15 and 28, Majuro’s reservoir storage jumped 7.04 million gallons (from 21.24 to 28.28 million gallons) – or from 59 to 79 percent of capacity. Farther north, however, severe drought (D2-S) persisted on Utirik and Wotje. Weekly rainfall totaled more than an inch only once during the first 9 weeks of 2020 on Utirik and twice on Wotje.
Despite a few recent days of mostly dry weather, there are no dryness-related concerns in American Samoa. During February, the Pago Pago International Airport received 32.73 inches of rain. However, during the February 26 - March 3 drought-monitoring period, the airport received rainfall totaling just 0.18 inch.
Virgin Islands
Generally tranquil weather prevailed across the U.S. Virgin Islands during the drought-monitoring period ending March 3. Following an unusually wet January, rainfall was much closer to normal during February, which is the heart of the Virgin Islands' dry season. USGS wells, which in recent weeks had exhibited a response to mid-winter rains, began to show slight increases in depth to water. Most February precipitation totals across the USVI were in the 1- to 2-inch range, although spotty totals in excess of 4 inches were noted.
On St. Croix, February rainfall totaled 0.92 inch (58% of normal) at Rohlsen Airport. However, higher totals were observed at other sites, with 1.23 inches reported by a cooperative observer in East Hill; 1.91 inches noted at a University of the Virgin Islands farm; and more than 4 inches falling at Christiansted Fort. Due to low groundwater levels and other long-term impacts, a moderate drought (D1-L) designation was retained for St. Croix. Farther north, February rainfall reached 1.89 inches (137% of normal) at King Airport on St. Thomas. Meanwhile, a volunteer observer at Windswept Beach on St. John received 2.53 inches of February rainfall, slightly above the long-term mean. There are neither dryness- nor drought-related concerns on St. Thomas and St. John.
Looking Ahead
During the next 5 days (March 5-9), heavy rain will be exiting the Southeast early in the period, leaving behind an estimated 1.5 to 3 inches of rainfall. Light to moderate precipitation is forecast along coastal areas of California, the Sierra Nevada, and the Four Corners Region later in the period. This energy is expected to transition to the central Great Plains by day 5, with estimates of greater than 0.5 inches centered just west of the Mississippi River. The 6-10 day (March 10-14) extended range forecast suggests a more transient pattern over the much of the CONUS (indicated by weak height anomalies and zonal flow), favoring above normal precipitation over much of the country. Enhanced probabilities for above normal precipitation are favored during the 6-10 day period over southern California and the Four Corners Region, in association with a potential mean trough propagating eastward underneath a Pacific ridge of high pressure. Meanwhile, an active storm track is favored to remain in place across Alaska, enhancing probabilities for above normal precipitation over much of the state during the extended range.
Author(s):
Adam Hartman, NOAA/NWS/NCEP/CPC
Brad Rippey, U.S. Department of Agriculture
Dryness Categories
D0 Abnormally Dry—used for areas showing dryness but not yet in drought, or for areas recovering from drought.
Drought Intensity Categories
D1 Moderate Drought
D2 Severe Drought
D3 Extreme Drought
D4 Exceptional Drought
Drought or Dryness Types
S Short-Term, typically less than 6 months (e.g. agricultural, grasslands)
L Long-Term, typically greater than 6 months (e.g. hydrologic, ecologic)
Source: National Drought Mitigation Center
