


IMPORTANT NOTE: The employment data for the month of May 2020 is taken from the survey week including May 12. Data for the survey week including June 12 is scheduled for release on July 17.
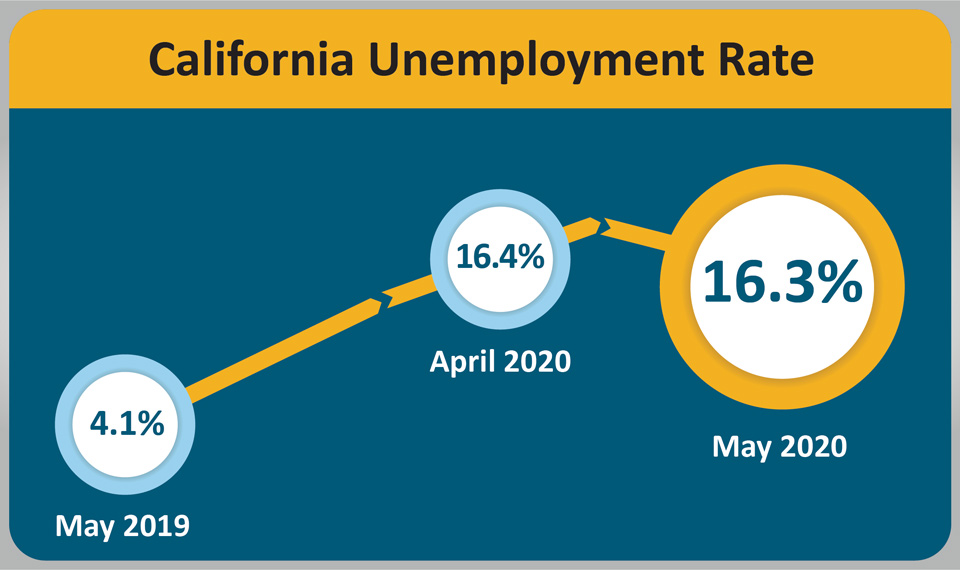
June 20, 2020 - SACRAMENTO – California’s unemployment rate experienced a minimal drop to 16.3 percent in May as the state’s employers added 141,600 jobs, according to data released on Friday by the California Employment Development Department (EDD) from two surveys. This comes after rapidly-evolving data prompted a statistical revision to a larger than initially estimated April job loss of 2,415,000 and an upward-revised unemployment rate of 16.4 percent. April’s revisions reflect unprecedented job losses never before seen in California’s history in a current data series that dates back to 1976 that are a direct result of the impacts of the COVID-19 pandemic.

California’s Labor Market, by the Numbers...
- While the state’s unemployment rate of 16.31 percent is slightly lower than the record high set in April 2020, it is still far higher than the 12.3 percent it was at during the height of the Great Recession (March, October, and November 2010).
- April’s revised loss of 2.4 million jobs2 in California since March is the biggest month-over job loss in state history, far eclipsing the Great Recession’s then record-setting, month-over loss of 132,800 jobs between December 2008 and January 2009.
- Nine of California’s 11 industry sectors gained jobs in May. Construction posted the largest job gain (+75,000) thanks to strength in specialty trade contractors and ongoing construction projects. Leisure and hospitality (+64,800) had the second largest job gain due to growth in accommodation and food services. Government (-95,800) had the largest drop with state and local government jobs both experiencing large decreases over the month.
1. The unemployment rate comes from a federal survey of 5,100 California households.
2. The nonfarm payroll job numbers come from a separate federal survey of 80,000 California businesses.
Data trends about Jobs in the Economy
Total Nonfarm Payroll Jobs
This information comes from a monthly survey of approximately 80,000 California businesses that estimates jobs in the economy – seasonally adjusted.
- Month-over – Total nonfarm jobs in California’s 11 major industries totaled 15,120,600 in May – a net gain of 141,600 jobs from April. This followed a revised loss of 2,415,000 jobs in April.
- Year-over – Total nonfarm jobs decreased by 2,267,100 jobs (a 13.0 percent decrease) from May 2019 to May 2020 compared to the U.S. annual loss of 17,665,000 jobs (an 11.7 percent decrease).

Total Farm jobs – The number of jobs in the agriculture industry decreased by 18,000 jobs from April to 325,600. The agricultural industry has lost 94,500 farm jobs since May 2019.
Data trends about Workers in the Economy
Employment and Unemployment in California
This information is based on a monthly federal survey of 5,100 California households which focuses on workers in the economy.
- Employed – The number of Californians holding jobs in May was 15,479,000, a decrease of 60,000 from April and down 3,066,000 from the employment total in May of last year.
- Unemployed – The number of unemployed Californians was 3,018,000 in May, a decrease of 25,000 over the month, but up by 2,225,000 compared with May of last year. May’s number is nearly 300 percent higher than February 2020 (759,300).

Unemployment Insurance Claims (Not Seasonally Adjusted)
The following data is from a sample week that includes the 19th of each month: In related data that figures into the state’s unemployment rate, there were 2,154,692 people certifying for Unemployment Insurance benefits during the May 2020 sample week. This is a sample week that includes the 19th of each month. That compares to 1,889,250 people in April 2020 and 321,372 people in May 2019. Concurrently, 203,588 initial claims were processed in the May 2020 sample week, which was a month-over decrease of 121,928 claims from April 2020, but a year-over increase of 165,192 claims from May 2019.

| COUNTY | LABOR FORCE | EMPLOYMENT | UNEMPLOYMENT | RATE |
|---|---|---|---|---|
| STATE TOTAL | 18,405,800 | 15,484,600 | 2,921,200 | 15.9% |
| ALAMEDA | 801,700 | 693,700 | 108,000 | 13.5% |
| ALPINE | 480 | 380 | 110 | 22.2% |
| AMADOR | 14,030 | 11,910 | 2,120 | 15.1% |
| BUTTE | 90,400 | 78,200 | 12,200 | 13.5% |
| CALAVERAS | 19,970 | 17,580 | 2,390 | 12.0% |
| COLUSA | 10,220 | 8,060 | 2,160 | 21.1% |
| CONTRA COSTA | 532,900 | 460,400 | 72,500 | 13.6% |
| DEL NORTE | 9,170 | 7,980 | 1,190 | 13.0% |
| EL DORADO | 90,600 | 77,000 | 13,600 | 15.0% |
| FRESNO | 445,000 | 375,300 | 69,700 | 15.7% |
| GLENN | 11,060 | 9,550 | 1,510 | 13.7% |
| HUMBOLDT | 60,700 | 53,600 | 7,200 | 11.8% |
| IMPERIAL | 71,700 | 51,700 | 19,900 | 27.8% |
| INYO | 7,910 | 6,950 | 970 | 12.2% |
| KERN | 368,400 | 301,100 | 67,300 | 18.3% |
| KINGS | 56,200 | 47,200 | 9,000 | 16.0% |
| LAKE | 25,420 | 21,510 | 3,910 | 15.4% |
| LASSEN | 8,870 | 7,980 | 890 | 10.0% |
| LOS ANGELES | 4,707,700 | 3,737,600 | 970,100 | 20.6% |
| MADERA | 62,200 | 52,800 | 9,500 | 15.2% |
| MARIN | 127,000 | 113,900 | 13,100 | 10.3% |
| MARIPOSA | 7,740 | 6,380 | 1,360 | 17.5% |
| MENDOCINO | 36,330 | 31,530 | 4,810 | 13.2% |
| MERCED | 113,800 | 95,000 | 18,800 | 16.5% |
| MODOC | 3,020 | 2,680 | 330 | 11.0% |
| MONO | 6,300 | 4,480 | 1,820 | 28.9% |
| MONTEREY | 198,100 | 164,700 | 33,300 | 16.8% |
| NAPA | 72,100 | 61,800 | 10,400 | 14.4% |
| NEVADA | 39,560 | 33,940 | 5,620 | 14.2% |
| ORANGE | 1,548,900 | 1,324,500 | 224,500 | 14.5% |
| PLACER | 180,600 | 158,200 | 22,400 | 12.4% |
| PLUMAS | 6,400 | 5,320 | 1,080 | 16.9% |
| RIVERSIDE | 1,089,100 | 917,200 | 171,900 | 15.8% |
| SACRAMENTO | 695,100 | 596,900 | 98,300 | 14.1% |
| SAN BENITO | 31,000 | 26,200 | 4,800 | 15.5% |
| SAN BERNARDINO | 937,200 | 807,100 | 130,100 | 13.9% |
| SAN DIEGO | 1,552,400 | 1,319,500 | 232,900 | 15.0% |
| SAN FRANCISCO | 550,900 | 481,500 | 69,400 | 12.6% |
| SAN JOAQUIN | 320,800 | 267,500 | 53,300 | 16.6% |
| SAN LUIS OBISPO | 129,100 | 112,700 | 16,400 | 12.7% |
| SAN MATEO | 427,400 | 380,200 | 47,200 | 11.1% |
| SANTA BARBARA | 208,600 | 181,600 | 26,900 | 12.9% |
| SANTA CLARA | 1,010,000 | 898,600 | 111,500 | 11.0% |
| SANTA CRUZ | 130,300 | 111,600 | 18,800 | 14.4% |
| SHASTA | 70,300 | 61,100 | 9,200 | 13.1% |
| SIERRA | 1,140 | 1,000 | 140 | 12.6% |
| SISKIYOU | 15,810 | 13,680 | 2,130 | 13.5% |
| SOLANO | 199,800 | 171,300 | 28,400 | 14.2% |
| SONOMA | 246,700 | 215,200 | 31,400 | 12.7% |
| STANISLAUS | 233,300 | 195,700 | 37,500 | 16.1% |
| SUTTER | 43,800 | 36,800 | 7,000 | 16.0% |
| TEHAMA | 24,370 | 21,290 | 3,080 | 12.6% |
| TRINITY | 4,280 | 3,820 | 460 | 10.7% |
| TULARE | 191,900 | 156,600 | 35,300 | 18.4% |
| TUOLUMNE | 20,790 | 17,360 | 3,430 | 16.5% |
| VENTURA | 406,800 | 351,800 | 55,000 | 13.5% |
| YOLO | 101,500 | 90,800 | 10,700 | 10.5% |
| YUBA | 29,000 | 24,700 | 4,400 | 15.1% |
Source: EDD

