


California and National Drought Summary for June 23, 2020
Summary
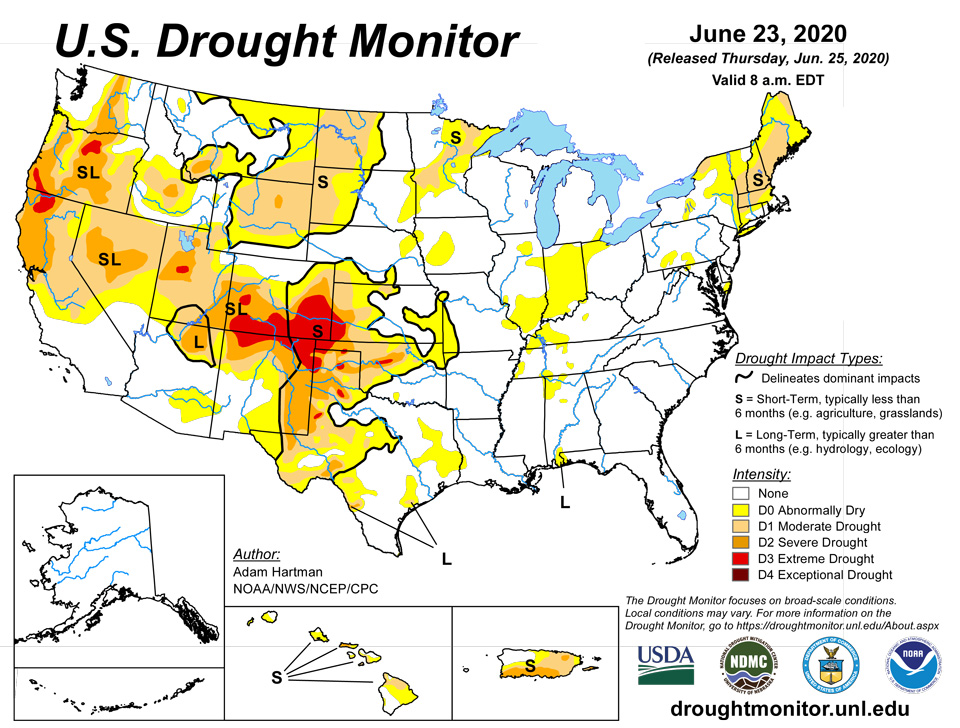
June 25, 2020 - Precipitation fell across much of the northern tier states and the eastern half of the CONUS this week. Much of the eastern United States has experienced increased dryness over the past 30-60 days and above normal temperatures. The heaviest rains missed many of the D0 and adjacent areas, warranting D0 expansion for several locations in the eastern CONUS. The Northeast (New York to New England) has seen conditions drastically deteriorate this week. Agricultural impacts are being reported across many areas in New England, particularly Maine, and 7-day USGS streamflows are below the 10th percentile for much of the Northeast Region. Areas just east of the Rockies missed out on some of the heavier precipitation this week, which fell over central Kansas, central Oklahoma, and northern Texas. This allowed for some improvement, mainly in areas that with D0 and D1 designations at the start of the week. However, severe (D2) and extreme (D3) drought designations remained for many locations in the Texas and Oklahoma Panhandles, eastern New Mexico and Colorado, and western Kansas. Mixed improvements and degradation in the northern Rockies and High Plains.
Northeast
The Northeast has experienced a dry pattern for in the past 30-60 days. Much of the region from New York to Maine received little to no rainfall this week and experienced temperatures well above normal. D0 was expanded to include all of Maine, portions of central and southern New York, and southwestern Connecticut. D1 was introduced to a large portion of southern New England extending into eastern New York. D1 was also introduced in northeastern Maine and Saint Lawrence County, New York. Many of these areas have received 25-50 percent of normal precipitation over the past 30 days (D0 and D1 areas) and over the past 60 days (D1 areas). D2-D4 equivalent SPIs are widespread across areas with D1 coverage, 7-day USGS streamflows are much below normal (below the 10th percentile), and current CPC soil moisture is between the 10th and 20th percentiles for much of the region. Parts of northern Saint Lawrence County, New York reported their driest April 1 – June 22 period on record. There have been some reports of corn rolling in some areas in New England. Maine in particular is seeing elevated impacts due to well above normal temperatures and lack of moisture in recent months, in addition to freezes in early- to mid-May. This has resulted in reduced spring grain yields and there are reported concerns about potential irrigation limitations. Farther southwest (Pennsylvania southward), a cutoff low over the eastern CONUS early in the week, followed by the passage of a frontal boundary later in the week, brought decent precipitation amounts to southern areas of the Northeast (1-2 inches, with locally higher amounts). This warranted some minor D0 removal in southern Pennsylvania and north-central Maryland.
Southeast
Heavy rain fell over parts of Virginia and North Carolina, with several locations receiving an estimated 4-8 inches of rainfall (and localized higher amounts), in association with a cutoff low early in the week. The rest of the Southeast saw near to below normal precipitation, warranting some D0 expansion and introduction in northern Alabama, as the precipitation was not enough to overcome short-term dryness (25-65 percent of normal precipitation in the past 60 days). A few streamflow gauges are also registering below normal streamflows the past 7 days in northern and western portions of Alabama. Further south, the central Gulf Coast received enough precipitation this week to warrant D0 and D1 removal over portions of southern Alabama and the western Florida Panhandle. However, more is needed as year-to-date (YTD) precipitation is still 65-75 percent of normal for areas with continued D0 coverage and 7-day USGS streamflows below normal (10th-24th percentile), and in a couple cases much below normal (below the 10th percentile).
South
South-central Oklahoma and northern Texas saw very heavy precipitation this week (4-8 inches). However, accumulations were lacking a bit in areas with D2 and D3 designations. Above-normal temperatures, high wind events, and below-normal precipitation leading up to this week has led to high evapotranspiration rates and hardened soils, increasing runoff. So more rainfall over extended periods is needed for improvement in some of the driest areas in the Central and Southern Plains. Elsewhere in the Southern Region, 30-60 day deficits continue to be the headliner. Although much of the region saw precipitation, many D0 and adjacent areas saw near to below normal rainfall, warranting some D0 expansion in the Tennessee Valley and eastern Texas.
Midwest
The Midwest saw widespread precipitation this week, with the heaviest rain falling in eastern Iowa and across central Wisconsin. Some minor D0 removal in western Iowa, corresponding to areas receiving 1.5-3 inches of rainfall. Some trimming of D0 and D1 in central Minnesota was also warranted, with the area receiving more than 1.5 inches of rainfall. However, D0 was expanded in eastern Minnesota into Pine and southern Carlton Counties, which received little to no rainfall this week. SPIs continue to remain negative (below -1.6 at 30 and 60 days; i.e. D3 and D4) and USGS 7-day average streamflows have fallen below the 10th percentile for these counties. Across the Corn Belt, the heaviest rainfall avoided many D0 and adjacent areas. For locations that did see precipitation, it was near to below normal for the 7-day period. As such, 30-60 day deficits continue to mount, warranting some D0 expansion into some of the drier locations this week. USGS streamflows are also continuing to fall below normal (10th-20th percentile), especially across Indiana.
High Plains
Similar to the Southern and Central Plains, many areas in the High Plains Region have fallen victim to above-normal temperatures, high winds, and a lack of precipitation in recent weeks. Some reduction in drought coverage in areas receiving the heaviest precipitation throughout the region, most notably central Kansas where many areas received 2-6 inches of rainfall. However, elsewhere 30 and 60 day deficits continue to increase, corresponding with D2-D4 equivalent SPIs and 25-50 percent of normal precipitation over the past 30 days across most areas depicted in drought. Soil moisture also continues to suffer across western North Dakota, much of Wyoming, and all of Colorado (CPC showing soil moisture below the 5th percentile for much of Colorado). There have been reports of low reservoir levels in North Dakota. Colorado has reported several episodes of 100-degree days in the southeast portion of the state in recent weeks, as well as cattle being sold and failing winter wheat crops. As such, severe drought (D3) is status quo this week for southern and southeastern Colorado.
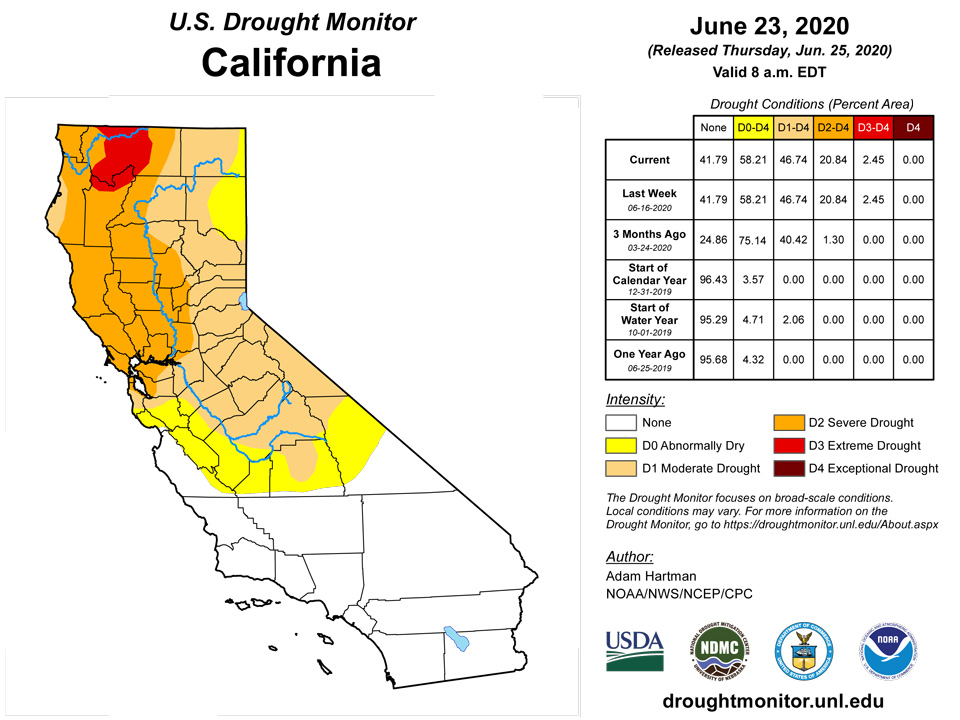
West
Much of the West remains status quo this week. Montana saw the most change, as 7-day rainfall accumulations over 1 inch were able to dig into some of the short-term departures, mainly in D0 areas. However, extreme eastern Montana missed out on rainfall this week. YTD SPIs are less than -2 in Richland County and USGS 7-day average streamflows are below normal (10th-24th percentile) near and just over the North Dakota/Montana state line, which warranted some D1 introduction there.
Alaska, Hawaii, and Puerto Rico
In Alaska, there is some dryness evident over various periods for a few locations on the Kenai and Alaska Peninsulas, but nothing to warrant any D0 introduction at this time. In Hawaii, small areas of D1 and D0 were introduced in southern and northeastern Kauai, respectively, in favor of NDVI and 7-day precipitation accumulations. SPIs in nearby locations also show dryness at 30 days. Puerto Rico saw its heaviest precipitation in the northwest (3-5 inches), which warranted only slight reduction in D0 coverage on the western coast of the island. Modest rainfall amounts were observed in southeastern Puerto Rico and were below normal (1-2 inch negative anomalies) for the week, bringing 30-day deficits to 4-8 inches and warranting the expansion of moderate drought (D1) to the southeast coast.
Pacific Islands
Several weather features competed across the U.S.-Affiliated Pacific Islands (USAPI) during this USDM week (6/17/20-6/23/20). At the surface, a dry trade-wind flow dominated northern and western portions of Micronesia. Differential wind speeds in the trade winds helped generate an Inter-Tropical Convergence Zone (ITCZ) over central to eastern Micronesia that occasionally extended into western Micronesia. Surface troughs, disturbances, and weak circulations moved through the trade-wind flow, enhancing precipitation generated by the wind speed convergence. Upper-level lows and troughs migrated westward generally north of 10 degrees North latitude, with their associated divergence aloft enhancing precipitation across northern, eastern, and extreme western parts of Micronesia. South of the equator, high pressure with a dry and stable air mass dominated the weather over American Samoa during the first half of the week. An active surface trough from the north brought heavy rain as it moved over the territory during the second half of the week.
Satellite-based estimates of 7-day precipitation (QPE) showed two continuous bands of precipitation, one extending eastward from Kosrae State in the eastern Federated States of Micronesia (FSM) just north of the equator (the ITCZ), and the second (South Pacific Convergence Zone, SPCZ) extending from Indonesia southeastward, passing just north of the Samoan Islands. Large areas of 2+ inches of rain were evident across Kosrae State and the Marshall Islands (RMI), with a smaller area of 2+ inches over Yap State south of Guam. The satellite QPE showed patchy areas of 0.5+ inches over Palau, the northern Marianas, Pohnpei State, and northern portions of Yap and Chuuk States. Little to no rain was detected by the satellite QPE over southern portions of Yap and Chuuk States. Large areas of 4+ inches of rain associated with the SPCZ were detected in the satellite analysis north and east of the Samoan Islands, with an area of 4+ inches extending right over American Samoa.
In the Republic of Palau, the Palau IAP reported 2.77 inches of rain for the week and Koror COOP station 2.43 inches, and both stations were over 8 inches for the month and wet in previous months, so D-Nothing continued. Home water catchments were likely dropping with the drier weather in other parts of the Republic, and a June 16 update from the Palau Public Utilities Corporation (PPUC) stated that Peleliu reservoir water levels were at 3.75 ft. with the maximum capacity at 5.4 ft.
Half an inch or less of rain was reported this week at the primary stations in the Marianas. Reports included 0.48 inch at the Guam IAP, 0.30 inch at the Saipan IAP, 0.26 inch at the Saipan NPS automated station, 0.17 inch at the Rota AP, 0.08 inch at the Saipan ASOS station, and 0.03 inch at Dededo (with 2 days missing). Monthly rainfall totals have been below the 4-inch monthly minimum since December 2019, with June marking the seventh dry month for Saipan; six of the last seven months have been dry at Guam and Rota. So the impacts indicator was changed to SL for all three stations. The Dx category did not change: D4-SL continues for Saipan, D3-SL continues for Rota, and D1-SL continues for Guam. If no more rain falls at Saipan for the rest of June, June 2020 would rank as the 4th driest June, while May-June, April-June, and March-June would be the driest such periods in the 40-year record. On-the-ground reports from Rota indicate that few impacts are being observed; in fact, vegetation has started turning green and there have not been any wildfires during the past week or so due to recent rains.
In the FSM, Kapingamarangi recorded only 0.33 inch of rain this week, and 2.63 inches so far in June. If no more rain falls this month, June 2020 would rank as the 2nd driest June and May-June 2020 as the driest May-June in the 30-year record. Reports from the island indicated that almost all of the household water tanks are near empty (observer estimated 10% left) and vegetation is yellowing. Based on the precipitation ranks and impacts, the status at Kapingamarangi was worsened to D2-S. Data from Fananu was missing for October 2019 through most of May 2020. But, according to on-the-ground reports, rains in recent months have improved conditions on the ground, thus ending drought. Rainfall reports have resumed at Fananu. Data are available now for the last 3 weeks, and they have each been dry (less than the 2-inch weekly minimum needed to meet most water needs). With the last 3 weeks dry, Fananu was analyzed as D0-S to reflect the recent lower rainfall. Yap received 2.16 inches of rain this week, which is above the 2-inch weekly minimum needed to meet most water needs, the last 3 weeks have been wet, and 14.12 inches of rain has fallen so far in June. The rain has improved groundwater levels, and the reservoir is full. With a wet (more than the 8-inch monthly minimum) June and wet May, and improving impacts, the status at Yap was improved to D0-S. Kosrae was wet this week and for the month, so D-Nothing continues. Chuuk, Pohnpei, Lukonor, Nukuoro, and Pingelap were dry this week, but wet during previous weeks and for the month, so D-Nothing continues. Ulithi (0.80 inch) and Woleai (1.29) were dry. D1-S continued at Ulithi, and D0-S continued at Woleai.
In the RMI, an ITCZ moved into the region near the end of the week, bringing wet conditions to southeastern locations. Weekly rainfall reports ranged from 4.10 inches at Ailinglapalap to 6.65 inches at Majuro and 8.96 inches at Mili. Jaluit reported 1.52 inches of rain this week and, further north, Kwajalein received 1.51 inches and Wotje 1.10 inches (with 2 days missing). The wet weather fell on locations that were not in drought or abnormally dry, while the islands in drought were dry this week (received less than the 2-inch weekly minimum needed to meet most water needs). The rains that have fallen recently at Wotje have been helpful, but all of the island’s water catchments are still only half full at best, and water conservation practices are still required as the rainfall has not been enough. No change was made to the depiction this week, with D3-SL continuing at Wotje, D1-SL continuing at Kwajalein, and D-Nothing at Ailinglapalap, Majuro, Jaluit, and Mili. No data was received from Utirik this week or prior weeks, so an analysis could not be made for that island.
The active trough dropped heavy rain as it moved over American Samoa this week. Weekly totals of more than ten inches were recorded at Pago Pago (12.08) and the automated station at Siufaga Ridge (10.43), while the automated station at Toa Ridge reported 7.89 inches. Data for the two automated stations were through only June 21 (missing 2 days). With this month continuing a string of wet months, D-Nothing continued for Tutuila.
Virgin Islands
The weather conditions across the U.S. Virgin Islands (USVI) during this USDM week (6/17/20-6/23/20) were dominated by a high pressure ridge which inhibited precipitation and brought above-normal temperatures. A substantial and extensive Saharan dust plume moved over the area with its dry air and dust further inhibiting precipitation and keeping temperatures warm. With these forces working against precipitation, the tropical waves which passed through the region generated limited shower activity.
Radar-based estimates of rainfall for the 7 days ending at 12z on Tuesday showed streamers of showers west of the USVI. About a fourth of an inch of rain was depicted over extreme western St. Thomas, but little to no rain was indicated for the rest of the islands.
On St. Croix, the Henry Rohlsen AP recorded 0.05 inch of rain this week, bringing the June total (through the 23rd) to 0.31 inch. This is only 17% of normal. When added to the dryness of the last two months, April 1-June 23, 2020 ranks as the driest such period on record. The year-to-date precipitation is 67% of normal. Rohlsen AP has had above-normal temperatures every day this week, with record maximums on the 19th (93 degrees F), 20th (94), 21st (93), and 22nd (93). The heat this week and previous weeks has resulted in the 2nd warmest June 1-23 and 2nd warmest April 1-June 23, based on maximum temperatures. East Hill recorded 0.12 inch this week and 0.29 inch so far this month, giving April 1-June 23, 2020 a rank of 2nd driest on record. CoCoRaHS stations at Christiansted 1.8 ESE and Christiansted 4.1 ESE reported 0.06 inch and no measurable precipitation, respectively, this week. Vegetation on St. Croix has turned brown. The USGS Adventure 28 well has had no data since April 25, 2020 due to malfunctioning equipment. The Standardized Precipitation Index (SPI) at Henry Rohlsen (Hamilton) AP was at D3 levels at the 3- and 9-month time scales, and the SPI at East Hill was at D3 level for the last 3 months and D2 level for the last 30 days. Based on deteriorating vegetation, SPI values, record dryness and record heat, the USDM status for St. Croix was worsened to D3-SL.
On St. Thomas, King AP and the CoCoRaHS station at Anna's Retreat 2.5 ESE had no measurable rain this week, while the CoCoRaHS station at Charlotte Amalie 1.4 NE recorded 0.26 inch. The monthly totals so far in June were 0.52 inch at King AP, 0.44 inch at Anna's Retreat, and 0.76 inch at Charlotte Amalie. The June monthly total at King AP was 27% of normal with a year-to-date total that was 69% of normal. April 1-June 23, 2020 ranked as the driest such period on record at King AP, although there were 6 days missing during this period due to instrument failure. The 3-month SPI at King AP was at D4 levels, but missing data may have contributed to that extreme value. The SPI at 9 months was only D1 and showed no drought or abnormal dryness at 6 and 12 months. The USGS Grade School 3 well level was steadily declining until the end of May; it has essentially leveled off during the last 4 weeks, but is still the lowest it's been in the last ten months. D2-S continued for St. Thomas.
On St. John, the CoCoRaHS stations at Cruz Bay 0.8 NE and Cruz Bay 1.6 E reported weekly rainfall totals of 0.10 inch and 0.06 inch, respectively. The June monthly total at Cruz Bay 0.8 NE was 0.44 inch, while the monthly total at Cruz Bay 1.6 E was unavailable due to missing data. The observer at Windswept Beach reported 0.14 inch for the week and 0.58 inch for the month. The monthly total is 27% of the long-term average. The 3-month SPI at Windswept Beach is at D3 levels. The USGS Susannaberg well level continues to decline, has been steadily declining since the end of January 2020, and is now the lowest it's been in almost 3 years (9/6/2017 was the last time it was lower). The low precipitation and groundwater levels, SPI, and suffering vegetation (which has been reported in previous weeks) prompted the USDM status to be worsened to D3-S.
Looking Ahead
June 25-29 shows increased probabilities for precipitation across much of the northern tier states (0.5-1 inch), Midwest (widespread 1-1.5 inches), and Gulf Coast states (1-2 inches, with locally higher amounts), according to the Weather Prediction Center’s (WPC) quantitative precipitation forecast. New England is likely to miss out on any meaningful precipitation (only 0.25-0.5 inch, with locally higher amounts favored). Lesser rainfall amounts are favored for the Southern and Central Plains, which does not bode well for areas experiencing severe and extreme drought. Positive temperature anomalies and high winds are also expected to continue over the High Plains and Central Plains, according to WPC’s 4-7 day gridded forecasts. Much of the Intermountain West are favored to see below normal temperatures.
The CPC 6-10 day outlook (June 30-July 4) shows a highly amplified pattern with mean troughing over the western CONUS and mean ridging over the eastern CONUS. This pattern favors enhanced odds for below normal temperatures over the western CONUS and above normal temperatures everywhere east of the Rockies, except for portions of the Southeast (near normal). Above normal precipitation is favored over the northern Rockies and Northern Plains, in association with the mean trough over the West. Above normal precipitation is also favored in the Ohio and Tennessee Valleys. Weak probabilities of below normal precipitation are favored in southeastern areas of the Four Corners Region and southern Texas, with enhanced probabilities for below normal precipitation in the northern Great Lakes, extending to the Northeast.
Author(s):
Adam Hartman, NOAA/NWS/NCEP/CPC
Richard Heim, NOAA/NCEI
Dryness Categories
D0 Abnormally Dry—used for areas showing dryness but not yet in drought, or for areas recovering from drought.
Drought Intensity Categories
D1 Moderate Drought
D2 Severe Drought
D3 Extreme Drought
D4 Exceptional Drought
Drought or Dryness Types
S Short-Term, typically less than 6 months (e.g. agricultural, grasslands)
L Long-Term, typically greater than 6 months (e.g. hydrologic, ecologic)
Source: National Drought Mitigation Center

