


California and National Drought Summary for June 30, 2020
Summary
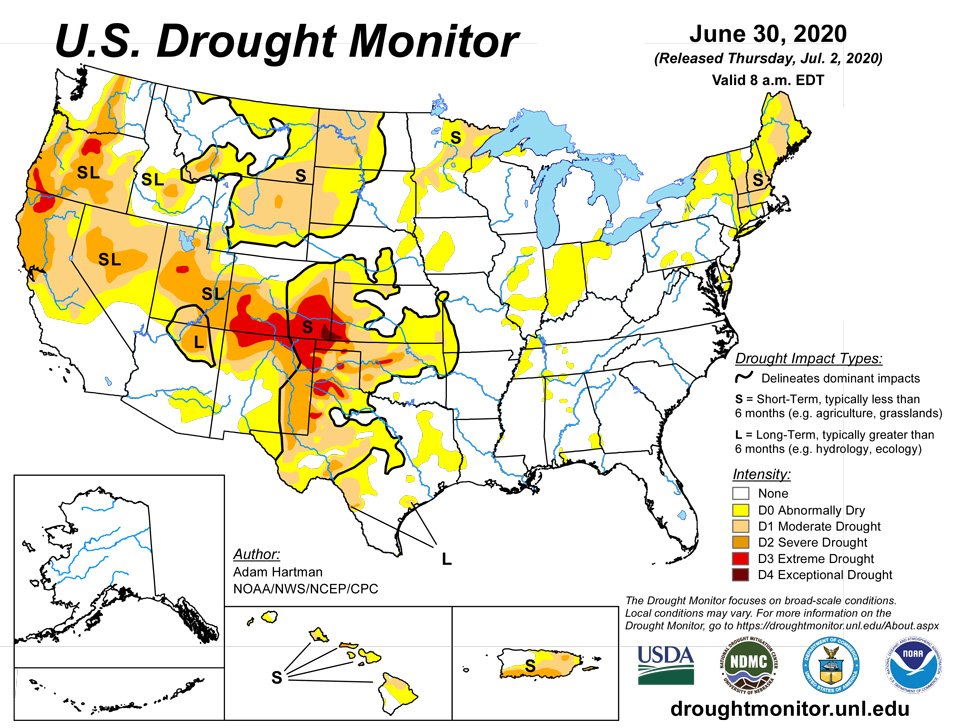
July 2, 2020 - Precipitation was hit-or-miss this week for many locations east of the Great Plains. Much of the Midwest, South, and Southeast saw combinations of D0 additions and removals based on 7-day rainfall accumulations. Most areas with D0 removal observed at least 2-3 inches of rainfall. Some short-term dryness crept into southern Georgia (isolated 2-4 inch 30-day deficits) and the Florida Gulf Coast (widespread 2-4 inch deficits over the last 14 days). The Mid-Atlantic coast saw some D0 expansion near the Delmarva Peninsula. Portions of New England saw more than 3 inches of rainfall, drastically reducing 30- and 60-day deficits and warranting some D1 removal. However, USGS 7-day average stream flows remain below normal for much of the Northeast. The High Plains and northern Rockies also received some beneficial rainfall. Many locations in Idaho saw 1-category improvements (D1 to D0 and D0 removal), but much of the northern High Plains Region did not receive enough rainfall for much improvement. Some degradation from D3 to D4 occurred in southeastern Colorado and southwestern Kansas in areas where little or no precipitation fell and temperatures averaged above normal for the week. The wildfire risk remains high for many locations that remain in drought, particularly in the West.
Northeast
Parts of New England received more than 3 inches of rainfall this week. Some locations in western Maine, eastern New Hampshire, and eastern Massachusetts had 30-day deficits reduced to around an inch, warranting an upgrade from D1 to D0 over western Maine. Precipitation deficits were totally removed near Norfolk, MA (7-day precipitation totals greater than 3 inches), leading to D0 removal. However, greater than 1.5 inch 60-day precipitation deficits remained for much of eastern Maine and USGS 7-day average stream flows remain below to much below normal (below the 24th percentile). In eastern Maine, despite light rainfall, D1 was expanded over Penobscot, Hancock, and Piscataquis Counties, in favor of D3-D4 SPIs at 30 and 60 days. D1 was also added near Jefferson County, NY, in support of a D3 60-day SPI nearby and 3-4 inch 60-day rainfall deficits. D0 was expanded across northern and southern New Jersey and the Delmarva Peninsula as 30-60 day precipitation deficits continue to mount. Many of the new D0 areas have seen 25-50 percent of normal precipitation over the last 60 days, diminishing to 10-25 percent of normal for several locations in the last 30 days. In addition, USGS 7-day average stream flows are below normal (10th-24th percentile) for D0 areas on the Delmarva and much below normal (less than the 10th percentile) for southern and northern New Jersey.
Southeast
Despite precipitation surpluses beyond 90 days, short-term dryness (30-60 days) remains the concern for many locations across the Southeast. This region again experienced a combination of D0 addition and removal, depending on where the heaviest precipitation fell. Parts of southeastern Alabama and southern Georgia have also experienced below normal precipitation over the last 30-60 day periods, as some stations are reporting D0, D1, and D2 SPIs for those periods. USGS 7-day average stream flows remain near and above normal for all of Georgia, so this week is status quo for much of the state. The exception being southwestern Georgia, where an area of D0 was introduced in southeastern Alabama and along the AL/GA border, where the area has received 25-50 percent of normal precipitation in the last 30 days, stream flows have fallen below normal (10th to 24th percentile), and soil moisture continues to decline. Many locations along Florida’s Gulf Coast saw a very dry last two weeks in June, with much of the coast experiencing 2-4 inch 14-day deficits. Scattered showers this week did little to help and USGS stream flows are mostly near normal, with the exception of the Tampa Bay area. 30-day SPIs are generally positive also, so no D0 introduction this week. However, the Florida Gulf Coast will need to be monitored closely in the coming weeks if the short-term dryness continues.
South
In the Southern Region, the story remains the short-term (30-60 day) dryness. Western Tennessee has missed out in recent weeks on the heaviest precipitation, warranting some D0 expansion (2-3 inch deficits going back 90 days). Northwestern Arkansas and northeastern Oklahoma saw D0 and D1 expansion, as little to no rain fell and most of these areas have received only 10-25 percent of normal precipitation in the last 30 days. 7 inch rainfall deficits in the last 60 days have been observed near Tulsa and Creek Counties in Oklahoma, warranting the addition of a small area of D2. USGS 7-day stream flows are also below normal (10th-24th percentile) for areas around Tulsa County, OK. In western areas of Texas and Oklahoma, heat, low humidity, and lack of rainfall continue to exacerbate existing drought conditions, leading to some D1, D2 and D3 expansion. Widespread D2-D4 SPIs over several time periods for many of these locations.
Midwest
The Midwest saw widespread precipitation where some locations received 3-6 inches of rain. D0 removal from much of the lower Ohio River Valley. The Corn Belt saw both expansion and reduction of D0, depending on where 7-day totals were below and above normal, respectively, adding to 1.5-3 inch 30-day deficits. The Arrowhead of Minnesota and northern Wisconsin saw D0 and D1 expansion, in favor of 3-5 inch 60-day departures, D3-D4 SPIs over several time periods, and much below normal (below the 10th percentile) USGS average 7-day stream flows.
High Plains
Above normal temperatures, low humidity, high winds, and below normal precipitation in recent weeks has led to continued degradation in southeastern Colorado and southwestern Kansas. Although some isolated convection occurred in southeastern Colorado, in areas that did not see precipitation and that continued to see above normal temperatures this week, D4 was introduced, which expanded into southwestern Kansas. However, some D0 and D2 reduction was warranted in western Kansas, as 7-day rainfall accumulations of more than 1.5 inches eliminated 30-day departures for several locations. Some areas of Nebraska saw expansion of existing D0 coverage, where 30-day dryness continues. There are concerns of potential flash drought in eastern Nebraska, where 30-day SPIs of D2 or greater are being reported. The northern High Plains saw enough rainfall this week (1.5-3 inches) to warrant D1 reduction in northwestern South Dakota and southwestern North Dakota. The remainder of the region was generally status quo.
West
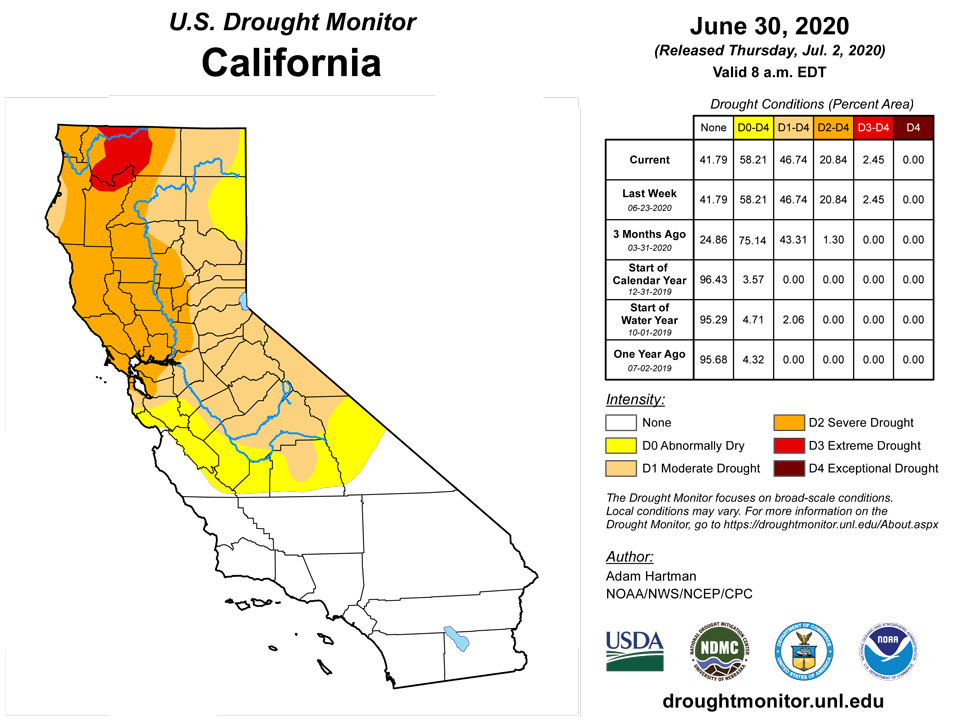
The Western Region is mainly status quo, except for the northern Rockies and Pacific Northwest, where an active storm track. Idaho benefitted the most, with several locations seeing 1-category improvements, particularly western Idaho, which received 0.5-1.5 inches of rainfall. Light showers in eastern Washington and northeastern Oregon led to slight reduction of D0 and D1 coverages. Soil moisture is below the 10th percentile in many areas across the Great Basin and northern California. USGS 7-day average stream flows also continue to be below to much below normal this week for much of the Four Corners Region, the Great Basin, and northern California.
Alaska, Hawaii, and Puerto Rico
In Alaska, rainfall has been near and above normal for many locations across the state going back 7-14 days, warranting status quo this week.
Hawaii remained dry again this week, with most locations seeing below normal precipitation for the 7-day period. Several stations in Oahu reported negative precipitation departures of more than 0.5 inches while northern portions of Maui also saw slight negative precipitation anomalies. As such, D1 was expanded eastward in Oahu to encompass locations seeing the greatest negative departures, and D0 was expanded to cover the remainder of the island. D0 was also expanded in Maui, in favor of slightly negative 30-day SPIs, below normal precipitation, and above normal temperatures this week.
D0-D2 reductions were made in western Puerto Rico, with several locations receiving 2-5 inches of rainfall this week. Many D2 locations along the southern coast of the have seen YTD deficits of 2-5 inches, with pockets of 5-10 inch deficits. Much of the eastern third of the island is seeing 25-50 percent of normal precipitation going back 90 days and USGS 7-day average stream flows are below the 10th percentile for much of the region. It was reported that the San Juan metro area will be implementing water rationing measures to cope with moderate and severe drought conditions in surrounding areas.
Pacific Islands
Surface and upper-atmosphere weather features brought rain to parts of the U.S.-Affiliated Pacific Islands (USAPI) during this USDM week (6/24/20-6/30/20). Surface troughs, trade-wind convergence, and tropical disturbances developed or migrated across Micronesia, mainly between the equator and 10 degrees North latitude. Upper-level troughs with embedded lows (Tropical Upper Tropospheric Troughs [TUTT cells]) traversed Micronesia, mainly north of 10 N. They provided divergence aloft which enhanced showers generated by the surface convergence. A dry trade-wind flow continued across the Marianas, with the dryness occasionally interrupted by showers triggered by migrating surface troughs and the upper-level features. The surface weather features across Micronesia are a manifestation of the climatological Inter-Tropical Convergence Zone (ITCZ) which straddles the equator across the globe. South of the equator, active surface troughs moved across the Samoan Islands, dropping abundant rainfall. These surface troughs are a component of the climatological South Pacific Convergence Zone (SPCZ).
Satellite-based estimates of 7-day precipitation (QPE) showed the ITCZ as a broken and narrowing band of precipitation across the Pacific mainly between the equator and 12 N. Across Micronesia, a large area of 2+ inches of precipitation was depicted over Palau and western Yap State, with narrower broken bands extending eastward across the Federated States of Micronesia (FSM) and Republic of the Marshall Islands (RMI). The rain bands became sparse farther east in the region. The QPE detected areas of 1+ inches of rain across the far northern Marianas associated with the TUTT cells. The SPCZ was depicted by a broken band of precipitation with embedded 2+ inch areas extending southeast from Indonesia to past the Samoan Islands. The QPE showed areas of 2+ inches of rain near the islands to the north, west, and south, with a heavy band extending across American Samoa.
This week was wet (more than the 2-inch weekly minimum needed to meet most water needs) in the Republic of Palau, with 3.56 inches of rain recorded at the Palau IAP and 2.62 inches at the Koror COOP station. With the monthly total at both stations (14.21 inches and 12.64, respectively) above the 8-inch monthly minimum, and April and May also wet, D-Nothing continued at Palau.
This week was another dry (below the 1-inch weekly minimum) week at Guam (0.67 inch), Rota (0.38), and Saipan. Two-thirds of an inch or less of rainfall was recorded at the Saipan IAP (0.51), Saipan ASOS station (0.63), and Saipan NPS station (0.20). Monthly totals were below the 4-inch monthly minimum at Guam (3.40 inches), Rota (2.33), Saipan IAP (1.96), Saipan ASOS (1.86), and Saipan NPS (1.53). With the continued dryness, D4-SL continued for Saipan, D3-SL continued at Rota, and D1-SL continued for Guam.
In general, the week was wet across western and some central portions of the FSM, with spotty wet conditions in the east and south. More than 2 inches of rain was reported at North Fanif (4.48 inches), Rumung (4.07), Yap (4.16), and Ulithi (2.95) in the west; Kosrae (7.12) and Mwoakilloa (2.62) in the east; Pohnpei (2.13) and Fananu (3.10) in the central region; and Kapingamarangi (3.24) and Nukuoro (5.60) in the south. Lukonor (0.99), Chuuk (1.32), Pingelap (1.40), and Woleai (1.70) had the lowest weekly rainfall reports. June monthly totals were above the 8-inch monthly minimum at most stations. Two changes were made this week compared to last week. Yap was improved from D0-S to D-Nothing and Ulithi was improved from D1-S to D0-S. This week marked the fourth consecutive week that Yap has been wet (more than 2 inches), and the monthly total for June is 18.56 inches and May had 8.22 inches, both above the monthly minimum. The value for June 2020 ranks as the 8th wettest June out of 69 years, and the May-June total (26.78 inches) ranks May-June 2020 as the 16th wettest May-June. At Ulithi, the 2.95 inches this week brings the monthly total to 8.67 inches, which is above the monthly minimum. May was also above with 9.90 inches. The last two weeks were dry at Woleai, so D0-S continues. Fananu recorded 3.10 inches of rain this week, which is above the weekly minimum of 2 inches. But the previous three weeks were dry, and the June monthly total is still only 7.19 inches, which is below the monthly minimum. Local reports indicate that the water supply is normal and food crops look normal. Fananu continued at D0-S to reflect the recent meteorological dryness. The rain this week at Kapingamarangi resulted in a monthly total for June of only 5.87 inches, which is well below the 8-inch monthly minimum, and previous weeks were very dry, so D2-S continued. D-Nothing continued elsewhere in the FSM.
In the RMI, Utirik has been missing for several weeks and thus could not be analyzed. The week was dry at Jaluit (0.91 inch) and Wotje (1.14), but wet at the rest of the regular reporting stations, with amounts ranging from 2.29 inches at Kwajalein to 6.67 inches at Ailinglapalap. The June total at Kwajalein was 6.09 inches, which is below the 8-inch monthly minimum, so D1-SL continued. This week was the fourth consecutive dry week at Wotje, and the monthly total is only 4.66 inches, so D3-SL continued. The monthly total at Jaluit was only 6.81 inches. The last two weeks were dry, but the previous week was wet. If the recent dryness continues, D0-S may be considered for Jaluit, but D-Nothing continued for now. June rainfall totals were above the monthly minimum at the remaining stations, where D-Nothing continued.
This was another wet week in American Samoa. Weekly rainfall totals were 3.83 inches at Pago Pago, 5.74 inches at the automated station at Siufaga Ridge, and 3.50 inches at the automated station at Toa Ridge. June monthly totals were 20.76, 22.19, and 14.73, respectively, which are above the 8-inch monthly minimum. With June continuing a string of wet to very wet months, D-Nothing continued at Tutuila.
Virgin Islands
The weather conditions across the U.S. Virgin Islands (USVI) during this USDM week (6/24/20-6/30/20) were dominated by two competing factors. A large Saharan dust layer moved across the region, bringing dry and stable air which inhibited precipitation. But a couple tropical waves injected moisture and instability at the lower levels, and a nearby upper-level trough and TUTT cell with their divergence aloft enhanced the precipitation which did develop.
Radar-based estimates of rainfall for the 7 days ending at 12z on Tuesday showed bands of 0.5-1.5 inches of precipitation across all three of the USVI.
A sharp gradient in rainfall occurred this week across St. Croix. An inch or more of rain was reported at the Henry Rohlsen AP (1.85 inches) and Christiansted 1.8 ESE CoCoRaHS station (1.02), with nearly an inch observed at the Christiansted 4.1 ESE CoCoRaHS (0.81) and East Hill (0.85) stations. The wettest station was the UVI Sheep Research Facility where 2.91 inches of rain was measured. This brought the monthly totals for June to 2.16 inches at Rohlsen AP, 1.14 inches at East Hill, and 3.36 inches at the UVI Sheep Research Facility. The monthly values for Rohlsen AP and East Hill are still below normal for the month, 94% and 52%, respectively. The last three months now rank as the 9th driest April-June in the 62-year record at Rohlsen and 6th driest out of 47 years at East Hill. But temperatures have been hot. Each day this week was above normal at Rohlsen AP, with record warm high temperatures occurring on the 25th (93 degrees F), 26th (93), 27th (94), and 28th (93). April 1-June 30 ranks as the 2nd hottest such period and June 2020 ranks as the hottest June when the average daytime maximum temperatures are examined. When daily highs and lows are taken into account, June 2020 ties with June 1980 as the hottest June. This week’s rain improved the Standardized Precipitation Index (SPI) at Rohlsen AP to D2 levels at the 3-month time scale, but it was still D3 at the 9-month time scale. And observer reports from St. Croix include low or dried up ponds and brown vegetation; farmers have no water or grass to feed cattle. The USGS Adventure 28 well has had no data since April 25, 2020 due to equipment malfunction. The impacts to farmers, and continued 9-month dryness, justified continuation of the D3-SL status for St. Croix.
Over an inch of rain was observed on St. Thomas this week, with King AP reporting 1.59 inches and the CoCoRaHS station at Anna's Retreat 2.5 ESE receiving 1.19 inches. Less than an inch (0.72) was recorded at the Charlotte Amalie 1.4 NE CoCoRaHS station. The rain this week raised the June monthly total at King AP to 2.11 inches, but this is still only 83% of normal. April 1-June 30, 2020, at King AP was the third driest such period on record, but six days were missing. The USGS Grade School 3 well level was steadily declining until the end of May; it has risen about half a foot in since last week, but is still the lowest it's been in the last ten months. The 3-month SPI at King AP improved to D2 level. D2-S continued on St. Thomas.
On St. John, 0.63 inch of rain was reported this week at the Windswept Beach CoCoRaHS station, 0.94 inch at the CoCoRaHS station at Cruz Bay 1.6 E, and 1.22 inches at the CoCoRaHS station at Cruz Bay 0.8 NE. The monthly total at Windswept Beach increased to 1.21 inches, but this is still well below normal – only 43% of the long-term average. The USGS Susannaberg well has been steadily declining since the end of January; last week was the lowest it's been in almost 3 years (9/6/2017 was the last time it was lower), but there is no data this week due to equipment malfunction. The SPI at Windswept Beach improved to D2 level at the 3-month time scale, but worsened to D1 at the 9-month time scale. Considering the continued poor condition of vegetation, D3-S continued for St. John.
Looking Ahead
During the next 5 days (July 2-6), WPC’s QPF showed increased probabilities for precipitation across many of the northern tier states, much of the Mississippi Valley, and Southeast, where many areas are favored to receive up to and exceeding 1 inch of precipitation. The Northern High Plains and the Middle Mississippi Valley are expected to see some of the heaviest rainfall (2-4 inches in some cases). Probabilities drop off quite a bit for many locations just east of the Rockies, where below normal precipitation, high winds, low relative humidity, and above normal temperatures continue to be the driving factors for maintenance and exacerbation of drought conditions. Luckily, temperature anomalies are favored to be near to slightly above normal for much of the next week over the western Plains. Much of the Great Lakes is also favored to miss out on some beneficial rainfall in the upcoming week, in addition to positive temperature anomalies of 8-10 °F.
The Climate Prediction Center’s 6-10 day outlook (July 7-11) shows an amplified pattern with a mean ridge over the central CONUS, and troughing over the West Coast and over the eastern CONUS. Enhanced probabilities of below normal temperatures are favored along the West Coast and interior Pacific Northwest, in association with a mean mid-level trough over the West. Above normal temperatures and below normal precipitation are favored in much of the central CONUS, with probabilities for above normal temperatures extending to the Great Lakes and Northeast, underneath a mean ridge. The active storm track is favored to continue for the northern tier states, with elevated odds for above normal precipitation centered over the Upper Midwest and Great Plains.
Author(s):
Adam Hartman, NOAA/NWS/NCEP/CPC
Richard Heim, NOAA/NCEI
Dryness Categories
D0 Abnormally Dry—used for areas showing dryness but not yet in drought, or for areas recovering from drought.
Drought Intensity Categories
D1 Moderate Drought
D2 Severe Drought
D3 Extreme Drought
D4 Exceptional Drought
Drought or Dryness Types
S Short-Term, typically less than 6 months (e.g. agricultural, grasslands)
L Long-Term, typically greater than 6 months (e.g. hydrologic, ecologic)
Source: National Drought Mitigation Center

