


IMPORTANT NOTE: The employment data for the month of July 2020 is taken from the survey week including July 12. Data for the survey week including August 12 is scheduled for release on September 18.
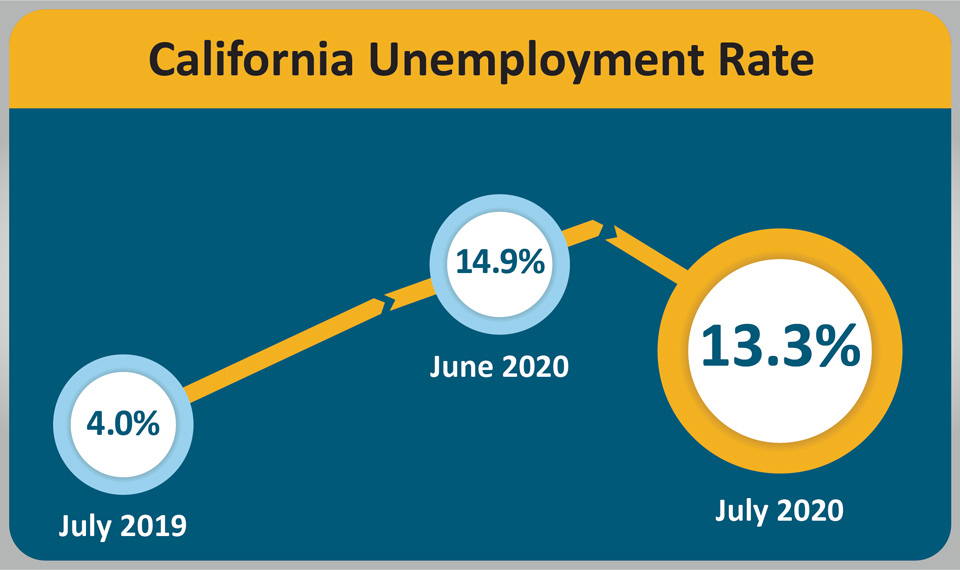
August 23, 2020 - SACRAMENTO – California’s unemployment rate improved to 13.3 percent in July as the state’s employers added 140,400 jobs1, according to data released on Friday by the California Employment Development Department (EDD) from two surveys. This comes after June’s record2 gain of 542,500 jobs and record losses from March and April in a data series that dates back to 1976. California has now regained nearly a third (31.1 percent) of the 2,625,500 nonfarm jobs lost during March and April as a direct result of the COVID-19 pandemic.

California’s Labor Market, by the Numbers...
- Despite the unemployment rate of 13.3 percent3 being noticeably lower than the record high of 16.4 percent from April and May, it is still above the 12.3 percent mark set during the height of the Great Recession (March, October, and November 2010).
- The month-over decrease in California’s unemployment rate (-1.6 percentage points) was larger than that of the nation as a whole (-0.9 percentage point).
- Nine of California’s 11 industry sectors gained jobs last month. Trade, Transportation, & Utilities (+40,900) had the largest job gain due to the performance of motor vehicle and professional equipment wholesalers, as well as automobile dealers.
- The growth in Government (+36,000) was thanks to gains in state government.
- Losses in Construction (-14,800) were largely due to weak hiring in residential construction despite hiring in non-residential construction being strong.
1. The nonfarm payroll job numbers come from a federal survey of 80,000 California businesses.
2. California’s current payroll jobs data date back to 1990.
3. The unemployment rate comes from a separate federal survey of 5,100 California households.
Data Trends about Jobs in the Economy
Total Nonfarm Payroll Jobs
This information comes from a monthly survey of approximately 80,000 California businesses that estimates jobs in the economy – seasonally adjusted.
- Month-over – Total nonfarm jobs in California’s 11 major industries totaled 15,796,100 in July – a net gain of 140,400 jobs from June. This followed a downward- revised (-15,700) gain of 542,500 jobs in June.
- Year-over – Total nonfarm jobs decreased by 1,643,600 (a 9.4 percent decrease) from July 2019 to July 2020 compared to the U.S. annual loss of 11,371,000 jobs (a 7.5 percent decrease).

Total Farm jobs – The number of jobs in the agriculture industry increased by 22,400 jobs from June to 335,500. The agricultural industry has lost 85,900 farm jobs since July 2019.
Data Trends about Workers in the Economy
Employment and Unemployment in California
This information is based on a monthly federal survey of 5,100 California households which focuses on workers in the economy.
- Employed – The number of Californians holding jobs in July was 16,293,900, an increase of 153,700 from June, but down 2,315,400 from the employment total in July of last year.
- Unemployed – The number of unemployed Californians was 2,510,100 in July, a decrease of 320,800 over the month, but up by 1,738,500 compared with July of last year.

Unemployment Insurance Claims (Not Seasonally Adjusted)
The following data is from a sample week that includes the 19th of each month: In related data that figures into the state’s unemployment rate, there were 3,144,098 people certifying for Unemployment Insurance benefits during the July 2020 sample week. That compares to 2,778,771 people in June 2020 and 308,212 people in July 2019. Concurrently, 244,506 initial claims were processed in the July 2020 sample week, which was a month-over decrease of 39,794 claims from June 2020 but a year-over increase of 205,016 claims from July 2019.

| COUNTY | LABOR FORCE | EMPLOYMENT | UNEMPLOYMENT | RATE |
|---|---|---|---|---|
| STATE TOTAL | 18,885,200 | 16,294,200 | 2,591,000 | 13.7% |
| ALAMEDA | 820,600 | 722,500 | 98,100 | 12.0% |
| ALPINE | 480 | 410 | 70 | 14.1% |
| AMADOR | 14,230 | 12,540 | 1,690 | 11.9% |
| BUTTE | 93,200 | 82,900 | 10,400 | 11.1% |
| CALAVERAS | 20,600 | 18,610 | 1,980 | 9.6% |
| COLUSA | 9,950 | 8,430 | 1,520 | 15.3% |
| CONTRA COSTA | 545,600 | 480,100 | 65,500 | 12.0% |
| DEL NORTE | 9,290 | 8,240 | 1,050 | 11.3% |
| EL DORADO | 89,500 | 80,300 | 9,200 | 10.3% |
| FRESNO | 447,400 | 387,000 | 60,400 | 13.5% |
| GLENN | 11,930 | 10,640 | 1,290 | 10.8% |
| HUMBOLDT | 58,900 | 52,800 | 6,000 | 10.2% |
| IMPERIAL | 71,500 | 52,300 | 19,200 | 26.8% |
| INYO | 8,250 | 7,480 | 770 | 9.4% |
| KERN | 370,000 | 308,800 | 61,200 | 16.5% |
| KINGS | 56,500 | 49,100 | 7,400 | 13.1% |
| LAKE | 26,920 | 23,790 | 3,130 | 11.6% |
| LASSEN | 8,870 | 8,110 | 760 | 8.6% |
| LOS ANGELES | 4,940,000 | 4,042,500 | 897,500 | 18.2% |
| MADERA | 60,800 | 52,900 | 7,900 | 13.0% |
| MARIN | 133,700 | 122,000 | 11,700 | 8.8% |
| MARIPOSA | 7,970 | 7,110 | 860 | 10.8% |
| MENDOCINO | 36,820 | 32,790 | 4,030 | 10.9% |
| MERCED | 112,300 | 96,000 | 16,300 | 14.5% |
| MODOC | 3,020 | 2,750 | 270 | 8.8% |
| MONO | 6,900 | 5,750 | 1,150 | 16.6% |
| MONTEREY | 198,400 | 174,400 | 24,000 | 12.1% |
| NAPA | 72,700 | 65,100 | 7,600 | 10.4% |
| NEVADA | 43,840 | 39,190 | 4,650 | 10.6% |
| ORANGE | 1,578,600 | 1,384,200 | 194,400 | 12.3% |
| PLACER | 182,600 | 164,800 | 17,800 | 9.8% |
| PLUMAS | 7,330 | 6,490 | 840 | 11.4% |
| RIVERSIDE | 1,098,200 | 947,900 | 150,300 | 13.7% |
| SACRAMENTO | 709,600 | 621,200 | 88,400 | 12.5% |
| SAN BENITO | 31,100 | 27,400 | 3,700 | 11.9% |
| SAN BERNARDINO | 958,300 | 833,200 | 125,100 | 13.1% |
| SAN DIEGO | 1,576,700 | 1,382,700 | 194,000 | 12.3% |
| SAN FRANCISCO | 573,900 | 511,200 | 62,700 | 10.9% |
| SAN JOAQUIN | 322,400 | 274,700 | 47,700 | 14.8% |
| SAN LUIS OBISPO | 131,200 | 118,200 | 13,000 | 9.9% |
| SAN MATEO | 445,000 | 403,800 | 41,100 | 9.2% |
| SANTA BARBARA | 215,200 | 193,700 | 21,400 | 10.0% |
| SANTA CLARA | 1,036,600 | 940,100 | 96,500 | 9.3% |
| SANTA CRUZ | 130,000 | 115,500 | 14,600 | 11.2% |
| SHASTA | 71,700 | 64,100 | 7,500 | 10.5% |
| SIERRA | 1,210 | 1,100 | 110 | 9.3% |
| SISKIYOU | 16,210 | 14,390 | 1,820 | 11.2% |
| SOLANO | 203,200 | 178,100 | 25,100 | 12.4% |
| SONOMA | 253,000 | 228,300 | 24,700 | 9.8% |
| STANISLAUS | 236,000 | 203,800 | 32,200 | 13.6% |
| SUTTER | 42,400 | 36,600 | 5,700 | 13.5% |
| TEHAMA | 24,050 | 21,400 | 2,650 | 11.0% |
| TRINITY | 4,450 | 4,070 | 380 | 8.6% |
| TULARE | 191,100 | 160,200 | 30,900 | 16.2% |
| TUOLUMNE | 19,780 | 17,290 | 2,480 | 12.6% |
| VENTURA | 412,200 | 365,800 | 46,400 | 11.3% |
| YOLO | 104,600 | 94,700 | 9,900 | 9.5% |
| YUBA | 28,300 | 24,500 | 3,800 | 13.5% |
Source: EDD

