


California and National Drought Summary for August 25, 2020
Summary
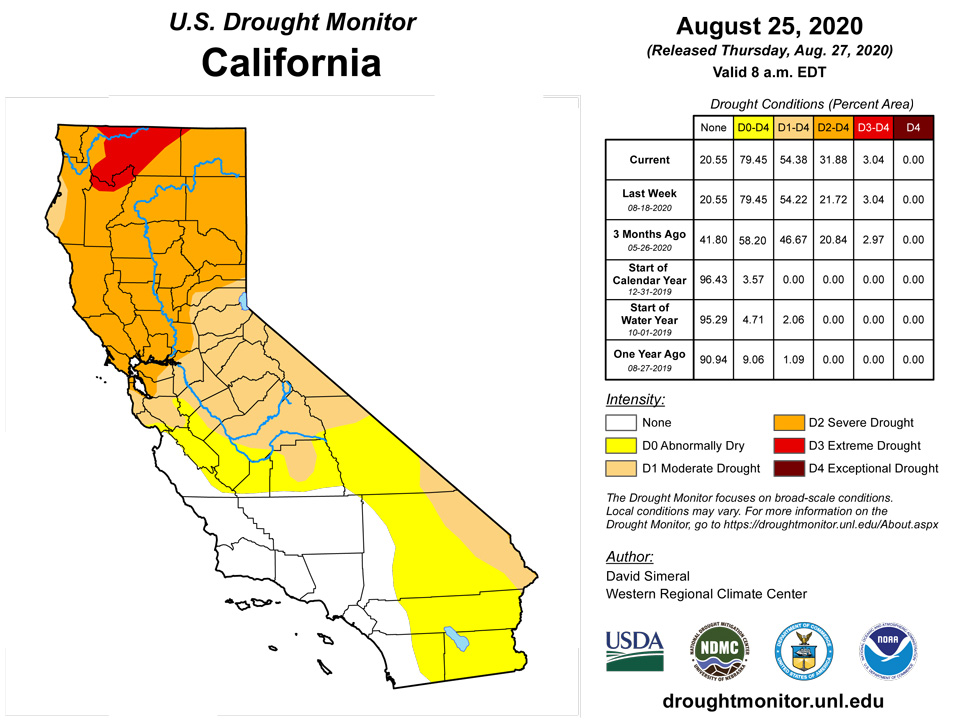
August 27, 2020 - This U.S. Drought Monitor week saw continued intensification of drought across parts of the western U.S. including Northern California, the Great Basin, Southwest, and parts of the Intermountain West where hot and dry conditions continued and large wildfires burned in California and Colorado. In Northern California, the National Interagency Coordinator Center is reporting 34 uncontained large fires with approximately 1,276,751 cumulative acres burned (all active fires) and more than 11,000 personnel deployed to the region. Further east, drought-related conditions continued to deteriorate in areas of West Texas where significant rainfall deficits (4 to 8 inches) have been mounting during the past 90 days as well as extreme heat and drying winds that have stressed crops and degraded rangeland conditions. In the Trans Pecos region of western Texas, the August 2019 to July 2020 period was the warmest on record—according to the National Oceanographic and Atmospheric Administration (NOAA) National Centers for Environmental Information (NCEI). Along the Gulf Coast of Louisiana, Tropical Storm Marco made landfall this week, but fortunately weakened before making landfall causing no significant damage. A much more powerful storm, Hurricane Laura (Category 4), is expected, however, to make a Gulf Coast landfall along the border of Louisiana and Texas on Thursday (August 27)—where a life-threatening storm surge, hurricane-force winds, and widespread flash flooding are expected. In the Midwest, above-normal temperatures and dryness in Iowa during the past 90-day period (3-to-7 inch rainfall deficits) led to expansion of areas of drought statewide. In the Northeast, areas of drought intensified in portions of the region including New Hampshire where streamflow levels were well-below-normal level (<10th percentile) and reports of some agricultural impacts emerged.
Northeast
On this week’s map, areas of Severe Drought (D2) and Moderate Drought (D1) expanded in southern New Hampshire and western Connecticut. In New Hampshire, gauging stations were reporting well-below-normal groundwater and streamflow levels including numerous rivers across the state reporting 7-day flows in the <10th percentile range. According to the U.S. Department of Agriculture (USDA) for the week ending August 23, the percentage of topsoil moisture in New Hampshire rated short to very short was 91% while neighboring Maine was rated 87% short to very short. For the week, some light precipitation (generally <1 inch) was observed across the region; and average temperatures were 1-to-4 degrees above normal across much of Pennsylvania, Connecticut, Massachusetts, and southern portions of Vermont and New Hampshire. Cooler than normal temperatures (1-to-4 degrees) were observed in parts of New York, northern Vermont, northern New Hampshire, and Maine. According to NOAA NCEI, Connecticut, Massachusetts, New Jersey, and Pennsylvania all experienced their warmest July on record while New York, Massachusetts, Rhode Island, and Vermont had their 2nd warmest on record. During the 2-month period of June-July 2020, Connecticut and Massachusetts had their warmest average temperatures on record.
Southeast
During the past week, scattered showers and thunderstorms across much of the region led to removal of areas of Moderate Drought (D1) in west-central Florida, southeastern Alabama, and southern Georgia where rainfall accumulation ranged from 3 to 6 inches. Additionally, areas of Abnormally Dry (D0) were removed across Alabama, Georgia, and South Carolina as a result of rainfall during the past week. According to NOAA NCEI, Florida observed its 5th warmest July on record; and the period from August 2019 to July 2020 was the warmest on record.
South
On Monday, Tropical Storm Marco made landfall near the mouth of the Mississippi River after weakening significantly thus sparing the residents of the Gulf Coast of Louisiana any significant impacts while a strengthening Hurricane Laura is expected to make landfall as a dangerous hurricane early Thursday morning. On this week’s map, drought intensified (due to continued hot temperatures and mounting precipitation deficits) across Texas with western Texas as a focal point of deterioration. According to NOAA NCEI, the Trans Pecos Climate Division (Texas, Division 5) observed its warmest July on record as well as its warmest August-July period on record. Elsewhere in the region, drought intensified on the map in southwestern Oklahoma where 4-to-6 inch rainfall deficits, since June 1, exist and rangelands reportedly are in poor condition. For the week, average temperatures continued to be above normal (2 to 8 degrees) across Far West Texas while areas to the east were below normal (2 to 8 degrees). In terms of precipitation, moderate accumulations (2 to 5 inches) were observed in portions of eastern Louisiana and southern Mississippi while some light precipitation (generally <1 inch) was observed along the Texas Gulf Coast and central Texas.
Midwest
On this week’s map, areas of Severe Drought (D2), Moderate Drought (D1), and Abnormally Dry (D0) expanded in Iowa as well as areas of Moderate Drought (D1) in west-central and northern Illinois, northern Indiana, Ohio, southern Michigan, and southwestern Missouri. In southern Michigan, some agricultural impacts are being reported including stress on crops including corn and soybeans—resulting from high evaporative demand, dry soils, and dryness dating back to mid-June. In central and western Iowa, farmers are experiencing significant impacts from below-normal precipitation during the past 60 days (3-to-7+ inch deficits) and from the devastating impacts of the derecho event (straight-line wind storm) on August 10 and 11 that caused severe damage to the state’s corn crop. According to the USDA (for the week ending August 23), the percentage of topsoil moisture in Iowa rated short to very short was 76%. For the week, light-to-moderate precipitation (1 to 3 inches) was observed in parts of Minnesota, northern Wisconsin, Upper Peninsula Michigan, southern Indiana, Ohio, and Kentucky while average temperatures where above normal (2-to-10 degrees) across the northern half of the region and below normal (2-to-8 degrees) across the southern portion.
High Plains
On this week’s map, areas of Moderate Drought (D1) expanded in the following areas: northwestern and central North Dakota, southwestern and eastern South Dakota, and eastern and western portions of Nebraska. In eastern South Dakota, corn has been drying prematurely as a result of the recent heat and strong winds. For the week, average temperatures were well above normal across the Dakotas, Nebraska, and the plains of Colorado, Wyoming, and Montana—ranging from 2-to-10+ degrees above normal. Further south, Kansas experienced cooler-than-normal temperatures (2-to-6 degrees) for the week. Overall, the region was mainly dry with some light accumulations (generally < 1.5 inches) observed in eastern North Dakota, southern South Dakota, and western Nebraska.
West
During the past week, numerous large wildfires continued to burn across California leading to mandatory evacuations in some communities around the Bay Area and in other locations in Northern California. The wildfires have been creating unhealthy air quality conditions downwind of the fires in California as well as in western Nevada, and southern Oregon —with smoke plumes extending as far as away as the Midwest. During the past week, the West saw some minor cooling compared to the record-setting heat of last week; but average temperatures were still well above normal across the most of the region. On the map, areas of drought expanded and intensified across California, Nevada, and the Four Corners States. In the Four Corners states, a combination of factors have led to the current drought depiction on the map—starting with an extended period of above-normal temperatures across Arizona, Colorado, and New Mexico beginning in mid-April and extending into mid-June. This warming triggered a premature melting of the snowpack across the mountain ranges of the Colorado River Basin. As summer continued, the extreme heat and a weak monsoon exacerbated the situation with numerous heat-related records broken across the region during July and August. According to NOAA NCEI, the April-July 2020 period was the 2nd driest on record in the Southwest Climate Region (Arizona, Colorado, New Mexico, Utah) while on a state level, the May-July 2020 period was the 2nd warmest on record for both Arizona and New Mexico. In terms of precipitation, April-July 2020 was the 3rd driest on record for Colorado, 4th driest for New Mexico, 5th driest for Colorado, and 6th driest on record for Utah. As of August 1, statewide reservoir storage was slightly below normal in California, Colorado, Nevada, and Oregon with New Mexico worse off at ~50% of normal while above-normal levels were observed in Arizona, Idaho, Montana, Utah, Washington, and Wyoming.
Alaska, Hawaii, and Puerto Rico
In the Hawaiian Islands, areas of Abnormally Dry (D0) and Moderate Drought (D1) expanded on the map on the Big Island around Mauna Kea, Mauna Loa, and along the Humuula Saddle. For the week, the island chain was very dry with the exception of some light rainfall accumulations (<1.5 inches) on the windward slopes of the Big Island as well as along the Kona Coast. Average temperatures were near-to-above normal across the islands with the greatest temperature departures (3-to-5 degrees above normal) observed on Lanai and Maui. In Alaska, average temperatures for the week were above normal (2-to-8 degrees) across most of Alaska with the exception of Southeast Alaska, that was slightly below normal. Most of the state was dry for the week except for far southern portions of Southeast Alaska with observed precipitation accumulations ranging from 2-to-4 inches. On the map, warm and dry conditions led to introduction of an area of Abnormally Dry (D0) in Northwest Alaska where precipitation during the past 30-day period has been less than half of normal. On Kodiak Island, year-to-date precipitation is currently ~20 inches below normal leading to the introduction of Moderate Drought (D1) on this week’s map.
Pacific Islands
The weather across the U.S.-Affiliated Pacific Islands (USAPI) during this USDM week (8/19/20-8/25/20) consisted of an arching pattern of troughs from the Republic of Palau and western Yap State in the west, stretching north across the Marianas, then southward again into Pohnpei and Kosrae States and the Marshall Islands (RMI). The surface troughs were bracketed by, or joined by, a disorganized and weak monsoon trough in western Micronesia and the leading element of an Inter-Tropical Convergence Zone (ITCZ) in eastern Micronesia. Upper-level lows and TUTT (Tropical Upper Tropospheric Trough) cells provided divergence aloft which aided surface convergence, especially near the Marianas but mostly just north of the Micronesia region. Weak circulations accompanied some of the surface troughs and there was some trade-wind convergence, but the flow regime was mostly weak and chaotic with high pressure ridging alternating with the surface troughs. High pressure dominated southern portions of the Federated States of Micronesia (FSM) for most of the week. South of the equator, a surface ridge brought a dry airmass and stable weather to American Samoa for most of the week, except when the ridge weakened, allowing a trough to move over the region in the middle of the USDM week.
Satellite-based estimates of 7-day precipitation (QPE) showed an arching pattern of precipitation across Micronesia with areas of 1+ inches of rain over Palau and western Yap State, near (east of) the Marianas, north of Pohnpei, and over and east of the southern RMI. The satellite analysis revealed little to no rain over southern portions of the FSM. Areas of 2+ inches of rain were north and south of the Samoan Islands, with a bridge of precipitation across the region joining the two wet areas. The satellite QPE depicted the ITCZ between roughly 5 and 10 degrees North latitude extending eastward from just east of the RMI. The South Pacific Convergence Zone (SPCZ) could be identified on the QPE as an east-west band stretching from Indonesia eastward between roughly 5 and 10 degrees South latitude.
Palau had 1.89 inches of rain for the week, however, the month-to-date is over 20 inches of rain. There are no concerns of drought development at the moment in Palau.
Guam had over 2 inches of rain this week at 2.30 inches and the month-to-date precipitation (MTD) total was over 5 inches. This was the second consecutive month with over 4-inches of rain. However, locals report that the precipitation has been very spotty across the island and it hasn't been enough to replenish streams. So, Guam remained in abnormally dry conditions this week. Rota and Saipan had a little over 1 inch of rain this week. The month-to-date precipitation total for both locations were above the 4-inches threshold to meet most water needs, marking the second consecutive month that the threshold has been met or surpassed. For this reason, Rota and Saipan had a one-category drought improvement this week to moderate drought.
This was a dry week for most of FSM, with Kapingamarangi, Nukuoro, and Lukunor, receiving little to no rain. The month-to-date precipitation total for Kapingamarangi was only 2.86 inches of rain, well below the 8-inches threshold to meet most water needs. For this reason, moderate drought persisted at Kapingamarangi this week. Meanwhile, Lukunor and Nukuoro continued to be in drought free conditions. Woleai had only 0.72 inches of rain this week, however, the last two weeks have been very wet with precipitation totals above 3 inches and the MTD precipitation total is over 9 inches. For this reason, Woleai remains drought free. Pohnpei, Chuuk, and Fananu had over 1 inch of rain and continued to be in drought free conditions this week. Yap, Kosrae, Pingelap, and Uithi were the only stations to have over 2 inches of rain. So, drought free conditions persist in these locations.
During the week, several stations across the Marshall Islands had less than their 2 inches of rain threshold to meet most water needs. The station with the least precipitation was Ailinglapalap with only 0.20 inch of rain. Since this is only Ailinglaplap's second consecutive week with precipitation totals below half an inch, drought free conditions were unchanged this week. Meanwhile, Majuro, Mili, and Wotje had the most precipitation at 2.66, 2.71, and 2.39 inches of rain, respectively. Even though Wotje had over 2 inches of rain and a little over 7 inches of rain last week, its drought classification remained at severe drought this week since vegetation could still be recovering after months of low precipitation totals. With only 1.07 inches of rain for the week, Kwajalein continued to be abnormally dry. With 1.20 inches of rain this week, Jaluit remained drought free.
Pago Pago had nearly 2 inches of rain this week, while Suifaga Ridge and Toa Ridge had over half an inch of rain. Since all three locations had close to or over double the monthly threshold of 4 inches to meet most water needs, drought free conditions were unchanged.
Virgin Islands
Tropical Storm Laura brought some much needed rain to parts of the USVI this week. Precipitation totals ranged from 1.0-3.5 inches at the airports and 0.9 to over 3 inches at the CoCoRaHS stations.
St. Thomas weekly values were 1.0 inch at the airport and between 0.9 inch to 1.55 inches at the CoCoRaHS stations. The month-to-date (MTD) precipitation total was 54.4% of normal precipitation at the airport, while year-to-date (YTD) precipitation total was 84.7% of normal. SPI values at the 1, 3, and 9 months were indicative of drought free conditions, while at the 6 and 12 months SPI values were indicative of abnormally dry to moderate drought conditions. For this week, St. Thomas’ drought classification of abnormally dry conditions was unchanged.
St. Croix had a total of 2.69 inches of rain this week at the airport, over 2 inches of rain at several CoCoRaHS stations, and over 3 inches at the UVI sheep research facility (17.7160N, 64.7958W) this week. MTD precipitation total was 122.6% of normal at the airport, while precipitation totals for the month were close to or over 3 inches of rain at the different CoCoRaHs stations. YTD precipitation was 84.7% of normal precipitation at the airport. SPI values at 1, 3, 6, and 9 months were indicative of drought free conditions, while the 12-month SPI value was indicative of severe drought. Due to the beneficial rains, St. Croix’s drought classification was improved by one category to abnormally dry conditions.
Similarly, St. John had precipitation totals above 3 inches at the airport and above 2 inches at the CoCoRaHS stations. The MTD precipitation total at the airport was 105.8% of normal and above 3 inches at the different CoCoRaHS stations. SPI values at the 1 and 9 months were indicative of drought free conditions, abnormally dry at the 3 month period, and moderate drought at the 6 and 12 months. A one-category drought improvement was made to St. John this week.
Looking Ahead
The NWS WPC 7-Day Quantitative Precipitation Forecast (QPF) calls for very heavy rainfall accumulations in association with Hurricane Laura making landfall along the Gulf coast of Louisiana and Texas. Along the coast, rainfall accumulations are expected to range from 3 to15 inches while areas inland in the Lower Mississippi River Basin are expected to see moderate-to-heavy accumulations (2-to-10 inches). In the Midwest, moderate rainfall accumulations (2-to-5 inches) are expected across parts of the region including Missouri, Iowa, Minnesota, Wisconsin, and Michigan as well as in parts of the Northeast. Out West, generally dry conditions are forecasted with the exception of some light precipitation (generally <1inch accumulations) in isolated areas of Arizona, New Mexico, and Colorado. Further northward, isolated mountain showers and thunderstorms are expected in the Northern Rockies of Wyoming and Montana with light accumulations (generally <1 inch). The CPC 6-10-day Outlook calls for a moderate-to-high probability of above-normal temperatures in the Far West, Southwest, South, Southeast, and Mid-Atlantic states, while a high probability of below-normal temperatures are expected across the remainder of the West, Plains states, and the Midwest. In terms of precipitation, there is a moderate-to-high probability of above-normal precipitation across most of the eastern half of the U.S., Northern Rockies, and Alaska. Drier-than-normal conditions are forecast for the Pacific Northwest, Four Corners states, and the Gulf Coast region of Texas and Mississippi.
Author(s):
David Simeral, Western Regional Climate Center
Ahira Sanchez-Lugo, NOAA/NCEI
Dryness Categories
D0 Abnormally Dry—used for areas showing dryness but not yet in drought, or for areas recovering from drought.
Drought Intensity Categories
D1 Moderate Drought
D2 Severe Drought
D3 Extreme Drought
D4 Exceptional Drought
Drought or Dryness Types
S Short-Term, typically less than 6 months (e.g. agricultural, grasslands)
L Long-Term, typically greater than 6 months (e.g. hydrologic, ecologic)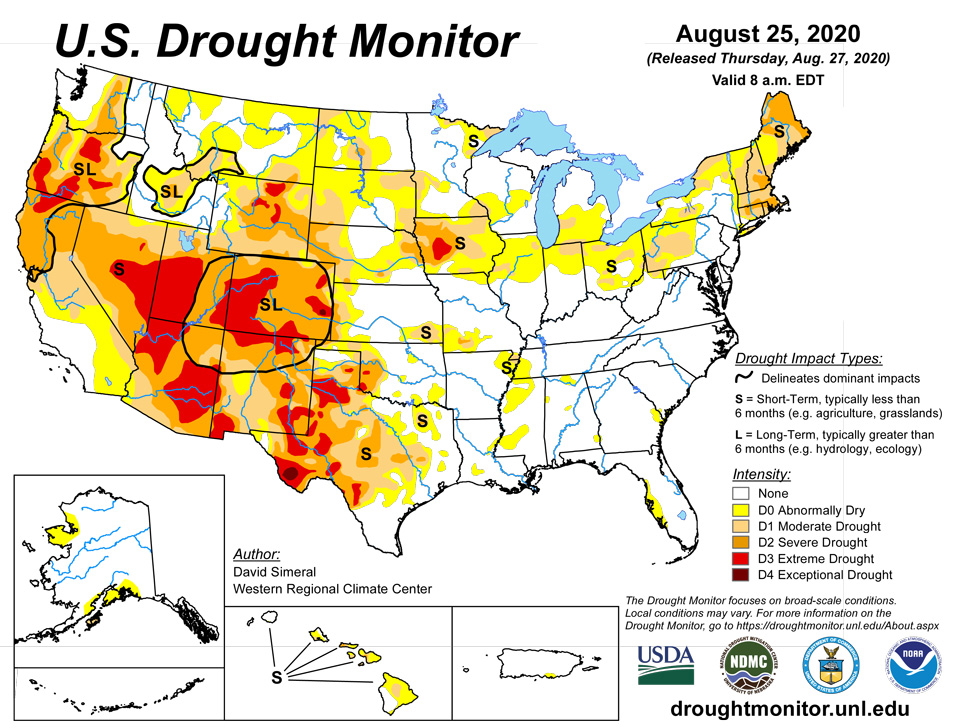
Source: National Drought Mitigation Center

