


California and National Drought Summary for September 22, 2020
Summary
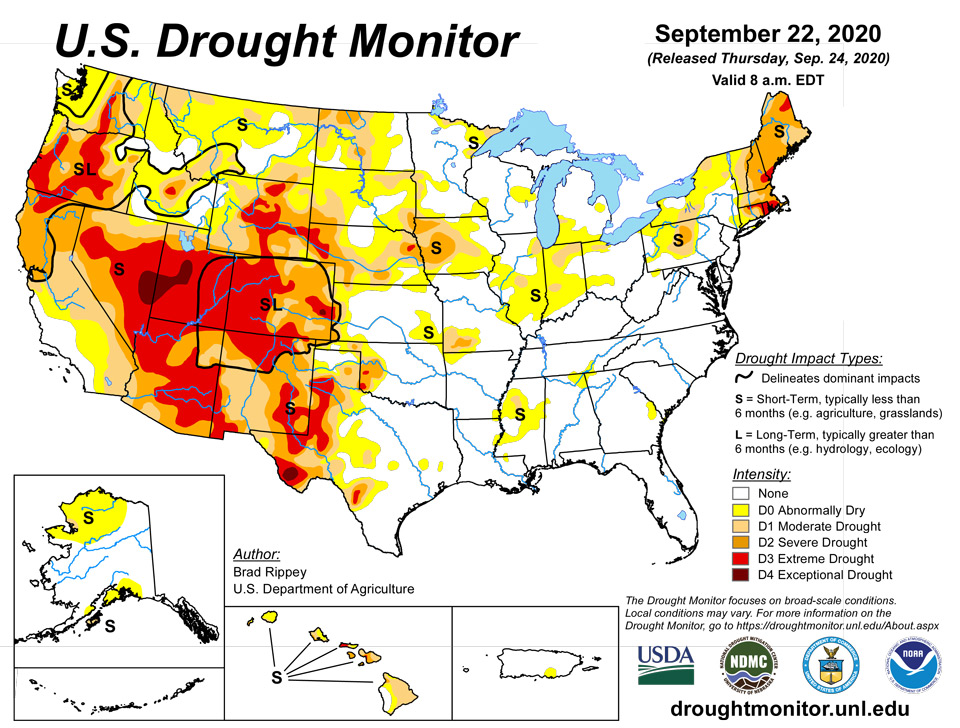
September 24, 2020 - Category 2 Hurricane Sally made landfall on September 16 near Gulf Shores, Alabama, around 4:45 am CDT, with sustained winds near 105 mph. Torrential rainfall across southern Alabama and western Florida sparked major to record flooding, while wind-related damage and power outages were common. Once inland over the Southeast, Sally quickly weakened but continued to produce heavy rain, extending as far north as southern Virginia. Mostly dry weather covered the remainder of the country, except for showers in the Pacific Northwest and heavy rain in the western Gulf Coast region associated with the arrival of Tropical Storm Beta along the middle Texas coast. Beta, the 23rd named storm of the Atlantic hurricane season—behind only 28 tropical cyclones in 2005—made landfall at 10:00 pm CDT on September 21 near Port O’Connor, Texas, with sustained winds near 45 mph. Meanwhile, drought remained entrenched across much of the western half of the country and parts of the Northeast. In the latter region, growing season-ending freezes (starting September 19) may limit re-growth of drought-stressed pastures, even if widespread precipitation returns during autumn. Western wildfires continued to degrade air quality across a vast area, with approximately six dozen fires in various stages of containment by September 22.
Northeast
Dry weather persisted in much the Northeast, although Hurricane Teddy grazed eastern Maine with some gusty winds and mostly light rain on September 22-23. However, cooler weather replaced previously warm conditions, with many locations reporting an end to the growing season due to sub-freezing temperatures. Sub-freezing, daily-record lows for September 19 included 21°F in Saranac Lake, New York, and 27°F in Montpelier, Vermont. In areas where pastures are stressed by drought and hard freezes occurred, significant re-growth of grass may not occur this autumn even if widespread precipitation returns. On September 20, the U.S. Department of Agriculture rated 100% of Rhode Island’s pastures in very poor to poor condition. Pastures were rated 90% very poor to poor in Connecticut and Massachusetts. On the same date, USDA topsoil moisture was rated 100% very short to short in Maine and New Hampshire. Streamflow in many areas of the Northeast is very low for this time of year. Some of the areas hardest hit by drought are reporting wells going dry and new wells needing to be dug. Given the mounting drought impacts, significant deterioration was shown in several areas from Pennsylvania to Maine. Notably, a new area of extreme drought (D3) was introduced in southern sections of Maine and New Hampshire.
Southeast
After making landfall on September 16 in southern Alabama, Hurricane Sally rapidly weakened but nevertheless drenched parts of the Southeast. Patchy dryness (D0) was largely eradicated from Georgia, South Carolina, and central and southern Alabama. A small amount of D0 persisted near the Atlantic Coast in Georgia and South Carolina, while dryness expanded in the vicinity of the Alabama-Georgia-Tennessee triple point. Short-term dryness continued to evolve in many other areas of northern Alabama, where September 1-22 rainfall totaled just 0.18 inch (7% of normal) in Huntsville.
South
Tropical Storm Beta made landfall on September 21 along the middle Texas coast, resulting in eradication of dryness (D0) and moderate drought (D1) in the western Gulf Coast region. Torrential rain fell mainly north of Beta’s center of circulation, including parts of the Houston metropolitan area. Numerous reports of at least 10 inches of rain were received from Harris County, Texas, where Houston’s William P. Hobby Airport netted 12.24 inches from September 20-22. Farther inland, additional improvements were introduced across central Texas in the wake of last week’s heavy rain, as drought impacts further faded. Meanwhile, a pesky area of dryness (D0) and moderate drought (D1) remained centered over Mississippi, with some further intensification noted. On September 20, USDA topsoil moisture in Mississippi was rated 56% very short to short. September 1-22 rainfall totals in Mississippi included 0.10 inch (5% of normal in Vicksburg and 0.22 inch (9%) in Meridian. (September 23-24 rainfall in Mississippi and neighboring states associated with the remnants of Beta fell too late to be considered for this week’s report.) Elsewhere, ongoing dry weather in western sections of Texas and Oklahoma led to some modest expansion of dryness (D0) and moderate to extreme drought (D1 to D3). For the year to date through September 22, precipitation in Midland, Texas, has totaled just 6.84 inches (62% of normal). Dalhart, Texas, is faring about as poorly, with 8.81 inches (60% of normal) falling from January 1 – September 22. The Vegetation Health Index (VHI) indicates that rangeland and pastures are significantly stressed across large sections of the southern High Plains, including much of western Texas.
Midwest
Mostly tranquil weather prevailed in the wake of the previous week’s significant precipitation event. However, recent rain bypassed a large area stretching from east-central Missouri into southwestern Ohio. A new area of short-term moderate drought (D1) was introduced in west-central Indiana, while dryness (D0) was broadly expanded where little rain has fallen for more than a month. September 1-22 rainfall totaled just 0.04 inch (2% of normal) in Indianapolis, IN, and 0.50 inch (22%) in Saint Louis, Missouri. An area farther north, mainly in eastern Minnesota and northwestern Wisconsin, is also being monitored for the need to introduce abnormally dry conditions. Meanwhile, patchy dryness (D0) and moderate drought (D1) conditions exist in northern Minnesota, where Duluth reported a January 1 – September 22 precipitation sum of 14.62 inches (61% of normal).
High Plains
Western portions of the High Plains continued to experience serious drought impacts, including severely stressed rangeland and limited soil moisture for the germination and establishment of recently planted winter wheat. On September 20, according to USDA, topsoil moisture was rated at least one-half very short to short in Colorado (68%), Wyoming (65%), Nebraska (52%), and South Dakota (51%). On the same date, Wyoming led the region with rangeland and pastures rated 71% very poor to poor, followed by Colorado at 51%. Colorado led the nation—among major production states—in very poor to poor ratings for corn (35%). Most of the region’s weekly changes indicated worsening drought, amid mostly dry weather and above-normal temperatures.
West
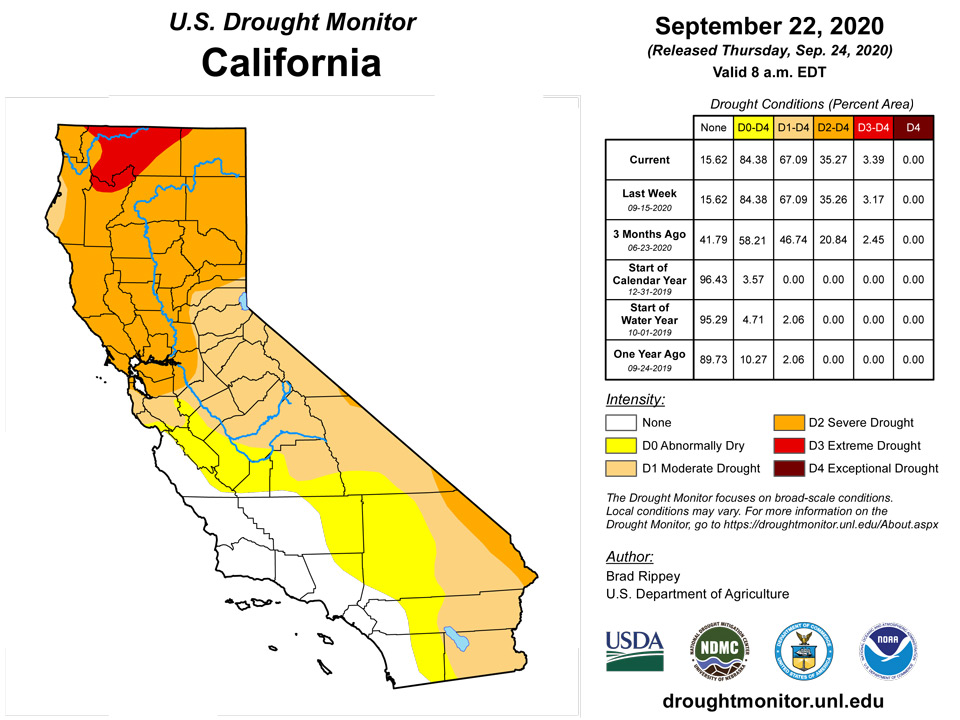
Much-needed precipitation began to overspread the Pacific Northwest, signaling the change in seasons that should eventually deliver drought relief. For now, though, the Northwestern precipitation merely stabilized conditions in some areas and aided wildfire containment efforts. The Northwestern rain led to a daily-record sum of 1.14 inches on September 18 in smoke-plagued Eugene, Oregon. The National Weather Service office in Seattle, Washington, reported a record-setting total (1.35 inches) for September 19. However, the remainder of the West remained mostly dry. Ground reports and the Vegetation Health Index (VHI) continued to indicate severe stress on native vegetation, as well as rangeland. Very poor to poor ratings were indicated by USDA on September 20 on at least 40% of rangeland and pastures in every Western State except Idaho, led by Oregon (84% very poor to poor). On the same date, topsoil moisture was at least 60% very short to short in every Western State except Arizona, led by New Mexico (91% very short to short). Water Year 2020 (October 1, 2019 – September 30, 2020) will soon end, with preliminary summaries indicating a dire drought situation in much of the region and some areas continuing to observe drought expansion or intensification. More than six dozen wildfires remained active across the West, with the greatest concentration of fires (and poor air quality) persisting in the Pacific Coast States. The latest wildfires to surpass 100,000 acres of vegetation burned were both in California: Bobcat Fire, northeast of Pasadena, less than 20% contained, and the August Complex West Zone, near Covelo, about 40% contained.
Alaska, Hawaii, and Puerto Rico
Following some heavy precipitation in parts of western Alaska on September 14, when Nome’s 1.27-inch total represented its wettest day since August 2, 2019, drier weather returned across many areas of the state. As a result, there were no further changes to Alaska’s depiction of dryness (D0) and drought (D1). In Hawaii, however, very warm, mostly dry weather persisted. Among Hawaii’s numerous daily-record highs were readings of 96°F (on September 18) in Kahului, Maui, and 89°F (on September 17, 18, and 19) in Lihue, Kauai. On the Big Island, Hilo attained the 90-degree mark (90°F on September 19) for the first time since July 26. Through September 22, month-to-date rainfall in Hilo totaled 3.32 inches (46% of normal). Kahului’s September 1-22 rainfall totaled 0.01 inch (4% of normal). Changes in Hawaii were numerous, but included expansion of dryness (D0) and moderate drought (D1) on Kauai; an increase in the coverage of D1 on Oahu and Maui; a growing area of moderate to extreme drought (D1 to D3) on Molokai; and several areas of drought deterioration on the Big Island. Reasons included low streamflow, poor vegetative health, and declining pasture conditions. Elsewhere, there were no changes in Puerto Rico, where a spot of abnormal dryness (D0) exists at various time scales along the southern coast.
Pacific Islands
The weather across the U.S.-Affiliated Pacific Islands (USAPI) during this USDM week (9/16/20-9/22/20) was characterized mainly by several surface troughs, some trade-wind convergence, and weak circulations. Upper-level lows or troughs also moved over parts of western Micronesia during the week, providing divergence aloft which enhanced precipitation triggered by surface features. A series of weak trade-wind disturbances interacted with copious tropical moisture and divergence aloft to produce substantial rainfall over the Marianas. Late in the week, Tropical Storm 14W developed well northwest of the Marianas. The eastern end of a monsoon trough teased Palau and western Yap State early in the week, then, in conjunction with TS 14W, returned at the end of the week, this time to the Marianas. A meteorological Inter-Tropical Convergence Zone (ITCZ) developed briefly over parts of eastern Micronesia. Transient ridges separated the migrating surface troughs, but a large surface ridge of high pressure built up over parts of western Micronesia near the end of the week. Very dry weather dominated southern portions of Micronesia as a La Nina-like synoptic pattern has developed in recent weeks. South of the equator, a dry air mass controlled the weather over American Samoa until a surface trough oscillated across the territory during the last half of the week.
Satellite-based estimates of 7-day precipitation (QPE) showed a band of rain (the South Pacific Convergence Zone, SPCZ) extending from Indonesia southeastward, passing south of the Samoan Islands. Another broken band extended eastward from Indonesia, looping through Micronesia before stretching eastward as the climatological ITCZ. The satellite analysis revealed patchy 1-inch areas of rain over parts of the Federated States of Micronesia (FSM); areas with 2+ inches over the Marianas, Kosrae State, and parts of the Marshall Islands (RMI); and very little rain in between these patchy areas, and especially over southern Micronesia. The QPE indicated a large band of 1-4 inches of rain south of the Samoan Islands, with the edge of this band brushing Tutuila.
In the Republic of Palau, based on data through September 22, the Palau International Airport station reported 2.20 inches of rain this week (which is above the weekly minimum of 2 inches needed to meet most water needs) and the COOP station at Koror recorded 4.97 inches. The monthly totals were 4.78 inches at the Palau IAP and 8.50 inches at Koror COOP. With the last 2 weeks wet and the previous 3 months wet, D-Nothing continued at Palau.
This week was wet (above the 1-inch weekly minimum needed to meet most water needs) across the board at the primary reporting stations in the Marianas. Rota recorded 8.00 inches for the week, bringing the monthly total (through the 22nd) to 11.52 inches which is almost 3 times the monthly minimum of 4 inches needed to meet most water needs and close to the full 30-day monthly normal. Dededo received 6.59 inches for the week (with 1 day missing) and 10.09 inches for the month so far, Agat recorded 4.01 inches for the week and 10.57 inches for September, and Guam reported 5.89 inches for the week and 8.80 inches for the month. Tinian had 5.25 inches for the week and 8.90 inches for the month. On Saipan, the Saipan IAP reported 4.96 inches of rain this week, bringing the monthly total to 7.37 inches; 4.65 inches fell at the ASOS station, bringing the monthly total for September to 7.13 inches; and the numbers were 5.34/9.79 for the NPS station. These are all well above the 1-inch minimum weekly and 4-inch minimum monthly thresholds. With each of the last 6 weeks wet, and July, August, and September wet, the USDM status at Saipan was changed from abnormally dry to no drought or abnormal dryness, making D-Nothing the status across the board at Saipan, Rota, and Guam.
In the Federated States of Micronesia, some stations were missing 1 or 2 days of data for the week while other stations had no missing days. The week was dry in southern portions of the FSM and in some parts to the north. Kapingamarangi and Nukuoro recorded no rain for the week, while Woleai reported 0.07 inch, Ulithi 0.44 inch, Lukonor 0.86 inch (with 1 day missing), and Fananu 0.88 inch (2 days missing). Kosrae almost reached the 2-inch weekly minimum with 1.89 inches (and 1 day missing). Other stations were wet (above the 2-inch weekly minimum needed to meet most water needs), with amounts ranging from 2.10 inches at Pingelap to 4.27 inches at Pohnpei and 4.61 inches at Rumung. The 0.63 inch monthly total (through September 22nd) at Kapingamarangi ranks September 2020 as the second driest September in the 29-year historical record (when compared to full 30-day Septembers). The 3.57 inches for August-September 2020 ranks as the driest August-September on record. June-September and July-September 2020 rank as the second driest, while December-September through May-September all rank as the driest on record. D2-S continued for Kapingamarangi, but the island will be watched for possible D3-S in the coming weeks if the dryness continues or impacts worsen. D-Nothing continued at the rest of the FSM stations. At Nukuoro, no rain fell this week but last week was wet, so D-Nothing continued; however, 4 of the last 5 weeks were dry so D0-S may be considered if the dryness continues. Last week was wet at the other stations that were dry this week.
In the Marshall Islands, no data was received from Utirik for the last 3 months so an analysis could not there. All of the other analyzed stations were missing one day this week except Kwajalein which had complete data. The week was wet (more than the 2-inch weekly minimum) at Ailinglaplap (3.80 inches) but dry at the rest of the stations. Weekly rainfall totals ranged from 0.67 inch at Jaluit to 1.26 inches at Mili. D0-S continued at Jaluit where the monthly precipitation total was only 3.10 inches and D2-SL continued at Wotje where the monthly total was 5.05 inches, both of which were below the monthly minimum at this point in the month. Even though the rainfall totals at Wotje have been below minimums, they have been getting rain. If rain continues to fall on a regular basis, the status at Wotje may be improved in coming weeks. D-Nothing continued at the remaining RMI stations.
In American Samoa, weekly rainfall totals have been well above the 1-inch weekly minimum at Pago Pago (2.66 inches) and the automated stations at Siufaga Ridge (3.01) and Toa Ridge (2.59). With September monthly totals two or three times the 4-inch monthly minimum, D-Nothing continued on Tutuila.
Virgin Islands
The weather conditions across the U.S. Virgin Islands (USVI) during this USDM week (9/16/20-9/22/20) were dominated by relatively dry air and high pressure. In competition to the dry air, moisture associated with the remnants of Tropical Storm Rene brought some showers to the USVI early in the week while a tropical wave moved over the area later in the week. In addition, a TUTT (Tropical Upper Tropospheric Trough) low came near the area before fizzling out. The week ended with a cold front approaching the region from the north.
Radar-based estimates of rainfall for the 7 days ending at 12z on Tuesday showed patchy 1-inch areas of rainfall on each island, with the heaviest values (2 inches) touching St. Thomas. But the rainfall was spotty, with other parts of the islands receiving much less rain.
Showers were scattered and localized on St. Croix, with over 2 inches reported by the CoCoRaHS stations at Christiansted 1.8 ESE (2.30 inches) and Christiansted 1.6 E (2.46), but about half an inch or less at the Henry Rohlsen AP (0.63) and the CoCoRaHS stations at Christiansted 4.1 ESE (0.50), Frederiksted 0.5 N (0.28), and Frederiksted 2.3 N (0.15). Rohlsen AP had 1.51 inches for the month so far, which is about 43% of normal. April 1-September 22, 2020, was the tenth driest such period in the 62-year record at Rohlsen, which equates to the 16th percentile or D1 level, while the year-to-date ranked 22nd driest out of 63 years and was about 80% of normal. The Standardized Precipitation Index (SPI) values for Rohlsen AP were at D0 level for 1 month, D1 for 6 months, and D3 for 12 months, but no drought or abnormal dryness for 3 and 9 months. The station at East Hill recorded 1.04 inches for the week, which was near normal, but only 2.27 inches for the month so far, which is 67% of normal. April 1-September 22 was the tenth driest such period in the 48-year record at East Hill, which equates to the 21st percentile or D0 level. The SPI at East Hill was at D0 level for 6 months and D1 for 12 months, but no drought or abnormal dryness at 1, 3, and 9 months. D0-L continued for St. Croix.
On St. Thomas, half an inch or more of rain was recorded this week at the King AP station (0.53 inch) and the CoCoRaHS stations at Charlotte Amalie 5.1 E (0.62), Charlotte Amalie 1.4 NE (0.76), and Anna's Retreat 2.5 ESE (1.15). King AP had 3.60 inches for the month so far (through September 22), but this was still below normal (only 91%), and the year to date was about 84% of normal. Lesser amounts for the month to date were recorded at Anna's Retreat 2.5 ESE (2.73), Charlotte Amalie 1.4 NE (1.29), and Charlotte Amalie 5.1 E (1.02). The SPI values for King AP were at D1 level for 6 months and D0 level at 12 months, but no drought or abnormal dryness for 1, 3, and 9 months. The USDM status continued at D0-L for St. Thomas.
It was mostly dry this week on St. John. The CoCoRaHS station at Cruz Bay 1.6 E reported half an inch (0.54 inch) of rain, but the CoCoRaHS stations at Cruz Bay 0.8 NE (0.20) and Windswept Beach (0.05) were much drier. The long-term average (“normal”) for the week at Windswept Beach is about 1.40 inches. The month-to-date totals were 3.76 inches at Cruz Bay 0.8 NE, 2.51 inches at Cruz Bay 1.6 E, and 1.50 inches at Windswept Beach. This equated to about 37% of the long-term average for Windswept Beach. The SPI at Windswept Beach was at D2 levels at the 1-month time scale, D0 at 3 months, and D1 at 6, 9, and 12 months. Windswept Beach has been dry (well below the weekly long-term average) for each of the last 4 weeks. The USDM status for St. John was changed from D0-L to D0-SL to reflect both the short-term as well as long-term dryness. The “wetter” conditions at the other two stations prevented the status from going to D1-SL.
Looking Ahead
The remnants of Tropical Storm Beta will drift generally northeastward and continue to weaken, although additional Southeastern rainfall could total 3 to 5 inches or more. Meanwhile, a series of cold fronts will cross the Midwest, generating scattered showers. Some of the most significant rain, 1 to 2 inches over the next 5 days, should fall in the vicinity of the Great Lakes. Farther west, mostly dry weather will continue during the next 5 days from California to the Plains and middle Mississippi Valley. In the Northwest, however, frequent showers—especially west of the Cascades—should provide relief from a dry summer and aid wildfire containment efforts. Aside from a surge of cool air into the Northwest, much of the country will experience near- or above-normal temperatures during the next several days.
The NWS 6- to 10-day outlook for September 29 – October 3 calls for the likelihood of above-normal temperatures in Maine and throughout the West, while cooler-than-normal conditions will cover most of the eastern half of the country. Meanwhile, near- or below-normal precipitation across most of the nation should contrast with wetter-than-normal weather in southern Florida and from the Great Lakes region into the northern and middle Atlantic States.
Author(s):
Brad Rippey, U.S. Department of Agriculture
Richard Heim, NOAA/NCEI
Dryness Categories
D0 Abnormally Dry—used for areas showing dryness but not yet in drought, or for areas recovering from drought.
Drought Intensity Categories
D1 Moderate Drought
D2 Severe Drought
D3 Extreme Drought
D4 Exceptional Drought
Drought or Dryness Types
S Short-Term, typically less than 6 months (e.g. agricultural, grasslands)
L Long-Term, typically greater than 6 months (e.g. hydrologic, ecologic)
Source: National Drought Mitigation Center

