


IMPORTANT NOTE: The employment data for the month of November 2020 is taken from the survey week including November 12. Data for the month of December is scheduled for release on January 22, 2021.
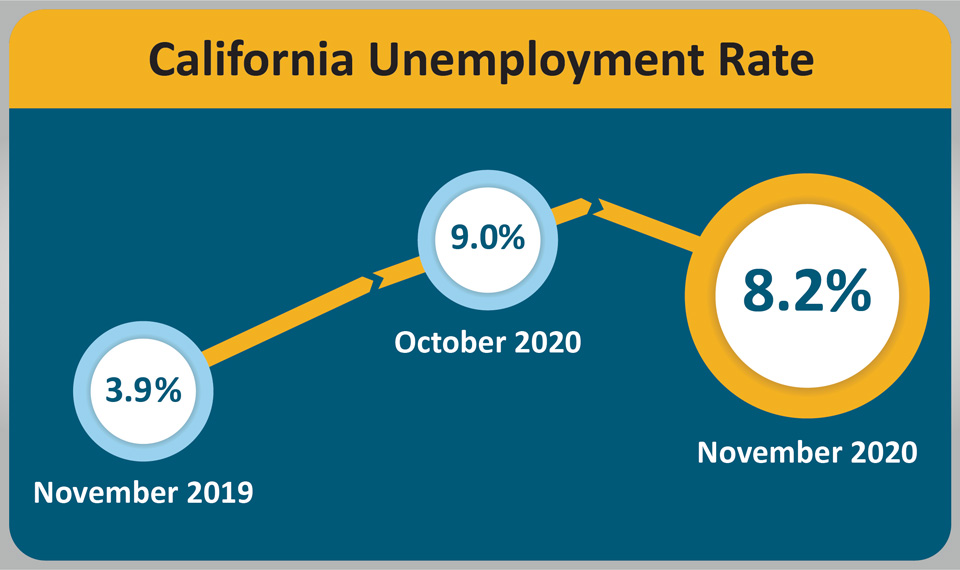
December 19, 2020 - SACRAMENTO – California’s unemployment rate dropped 0.8 percent to 8.2 percent in November as the state’s employers added 57,100 jobs1, according to data released on Friday by the California Employment Development Department (EDD) from two surveys. This comes after October’s upward-revised gain of 145,600 jobs (+100 jobs). California has now regained approximately 46 percent of the 2,615,800 nonfarm jobs that were lost due to the COVID-19 pandemic in March and April.

California’s Labor Market, by the Numbers...
- At 8.2 percent2 in November, California’s unemployment rate is at the lowest level it has been since 5.5 percent in March 2020. November also marks the sixth straight month the unemployment rate fell below the all-time unemployment rate high of 16.4 percent set in April and May of this year.
- Nine of California’s 11 industry sectors gained jobs last month. For the third consecutive month, Leisure & Hospitality posted the largest job sector gain with an increase of 27,800 jobs, thanks in part to the resilience shown throughout the fall season by the Arts, Entertainment, and Recreation subsector.
- Trade, Transportation & Utilities posted an increase of 19,700 jobs and was boosted by sizeable gains in the Transportation, Warehousing, and Utilities subsector.
- For the third straight month, Government posted the largest industry job loss with a decline of 10,200 in November due to sizeable losses in Federal Government employment.
1. The nonfarm payroll job numbers come from a federal survey of 80,000 California businesses.
2. The unemployment rate comes from a separate federal survey of 5,100 California households.
Data Trends about Jobs in the Economy
Total Nonfarm Payroll Jobs
This information comes from a monthly survey of approximately 80,000 California businesses that estimates jobs in the economy – seasonally adjusted.
- Month-over – Total nonfarm jobs in California’s 11 major industries totaled 16,191,400 in November – a net gain of 57,100 jobs from October. This followed an upward-revision of 100 jobs for a revised gain of 145,600 jobs in October.
- Year-over – Total nonfarm jobs decreased by 1,336,700 (a 7.6 percent decrease) from November 2019 to November 2020 compared to the U.S. annual loss of 9,185,000 jobs (a 6.1 percent decrease).

Total Farm jobs – The number of jobs in the agriculture industry increased by 20,900 from October 2020 to 356,500 jobs in November. The agricultural industry has lost 73,600 farm jobs since November 2019.
Data Trends about Workers in the Economy
Employment and Unemployment in California
This information is based on a monthly federal survey of 5,100 California households which focuses on workers in the economy.
- Employed – The number of Californians with jobs in October was 17,347,000, a decrease of 141,500 jobs from October’s total of 17,488,500, and down 1,386,900 from the employment total in November of last year.
- Unemployed – The number of unemployed Californians was 1,542,100 in November, a decrease of 186,000 over the month, and up by 788,400 in comparison to November of last year.

Unemployment Insurance Claims (Not Seasonally Adjusted)
The following data is from a sample week that includes the 19th of each month: In related data that figures into the state’s unemployment rate, there were 1,278,200 people certifying for Unemployment Insurance benefits during the November 2020 sample week. That compares to 1,650,946 people in October 2020 and 293,595 people in November 2019. Concurrently, 168,998 initial claims were processed in the November 2020 sample week, which was a month-over increase of 16,347 claims from October 2020, and a year-over increase of 119,552 claims from November 2019.

| COUNTY | LABOR FORCE | EMPLOYMENT | UNEMPLOYMENT | RATE |
|---|---|---|---|---|
| STATE TOTAL | 18,928,800 | 17,437,200 | 1,491,600 | 7.9% |
| ALAMEDA | 815,200 | 760,200 | 55,000 | 6.7% |
| ALPINE | 520 | 480 | 40 | 7.1% |
| AMADOR | 14,190 | 13,200 | 990 | 7.0% |
| BUTTE | 93,000 | 86,700 | 6,300 | 6.8% |
| CALAVERAS | 20,130 | 18,950 | 1,190 | 5.9% |
| COLUSA | 9,630 | 8,590 | 1,040 | 10.8% |
| CONTRA COSTA | 542,200 | 505,100 | 37,100 | 6.8% |
| DEL NORTE | 9,050 | 8,370 | 680 | 7.6% |
| EL DORADO | 90,100 | 85,000 | 5,100 | 5.7% |
| FRESNO | 440,000 | 402,200 | 37,800 | 8.6% |
| GLENN | 12,480 | 11,730 | 750 | 6.0% |
| HUMBOLDT | 60,300 | 56,700 | 3,600 | 6.0% |
| IMPERIAL | 65,400 | 54,700 | 10,700 | 16.4% |
| INYO | 8,230 | 7,750 | 480 | 5.8% |
| KERN | 370,900 | 335,900 | 35,000 | 9.4% |
| KINGS | 54,700 | 49,800 | 4,800 | 8.9% |
| LAKE | 28,710 | 26,620 | 2,080 | 7.3% |
| LASSEN | 9,650 | 9,140 | 510 | 5.3% |
| LOS ANGELES | 4,986,500 | 4,459,100 | 527,400 | 10.6% |
| MADERA | 60,000 | 55,100 | 4,800 | 8.1% |
| MARIN | 134,400 | 128,100 | 6,300 | 4.7% |
| MARIPOSA | 7,230 | 6,680 | 550 | 7.6% |
| MENDOCINO | 36,010 | 33,570 | 2,440 | 6.8% |
| MERCED | 112,000 | 101,900 | 10,100 | 9.0% |
| MODOC | 3,060 | 2,870 | 190 | 6.2% |
| MONO | 7,310 | 6,720 | 590 | 8.1% |
| MONTEREY | 188,300 | 173,800 | 14,500 | 7.7% |
| NAPA | 71,000 | 66,700 | 4,300 | 6.0% |
| NEVADA | 46,430 | 43,810 | 2,620 | 5.6% |
| ORANGE | 1,592,400 | 1,490,700 | 101,700 | 6.4% |
| PLACER | 184,000 | 174,400 | 9,600 | 5.2% |
| PLUMAS | 7,400 | 6,870 | 530 | 7.2% |
| RIVERSIDE | 1,101,000 | 1,015,000 | 86,000 | 7.8% |
| SACRAMENTO | 709,500 | 657,300 | 52,200 | 7.4% |
| SAN BENITO | 30,700 | 28,600 | 2,100 | 6.9% |
| SAN BERNARDINO | 970,900 | 893,600 | 77,300 | 8.0% |
| SAN DIEGO | 1,582,500 | 1,477,300 | 105,200 | 6.6% |
| SAN FRANCISCO | 566,500 | 534,100 | 32,400 | 5.7% |
| SAN JOAQUIN | 321,500 | 292,500 | 29,000 | 9.0% |
| SAN LUIS OBISPO | 131,800 | 124,600 | 7,100 | 5.4% |
| SAN MATEO | 444,700 | 422,000 | 22,700 | 5.1% |
| SANTA BARBARA | 213,600 | 201,300 | 12,300 | 5.8% |
| SANTA CLARA | 1,042,700 | 989,600 | 53,100 | 5.1% |
| SANTA CRUZ | 128,100 | 119,500 | 8,600 | 6.7% |
| SHASTA | 73,100 | 68,300 | 4,800 | 6.5% |
| SIERRA | 1,280 | 1,210 | 60 | 5.0% |
| SISKIYOU | 15,880 | 14,720 | 1,160 | 7.3% |
| SOLANO | 203,600 | 188,300 | 15,300 | 7.5% |
| SONOMA | 250,200 | 236,400 | 13,800 | 5.5% |
| STANISLAUS | 233,700 | 214,300 | 19,400 | 8.3% |
| SUTTER | 40,900 | 37,400 | 3,500 | 8.6% |
| TEHAMA | 24,400 | 22,740 | 1,660 | 6.8% |
| TRINITY | 4,240 | 3,980 | 260 | 6.1% |
| TULARE | 191,500 | 172,700 | 18,800 | 9.8% |
| TUOLUMNE | 19,670 | 18,200 | 1,460 | 7.4% |
| VENTURA | 412,600 | 386,700 | 25,900 | 6.3% |
| YOLO | 105,700 | 99,600 | 6,100 | 5.8% |
| YUBA | 28,300 | 25,800 | 2,500 | 8.7% |
Source: EDD

