


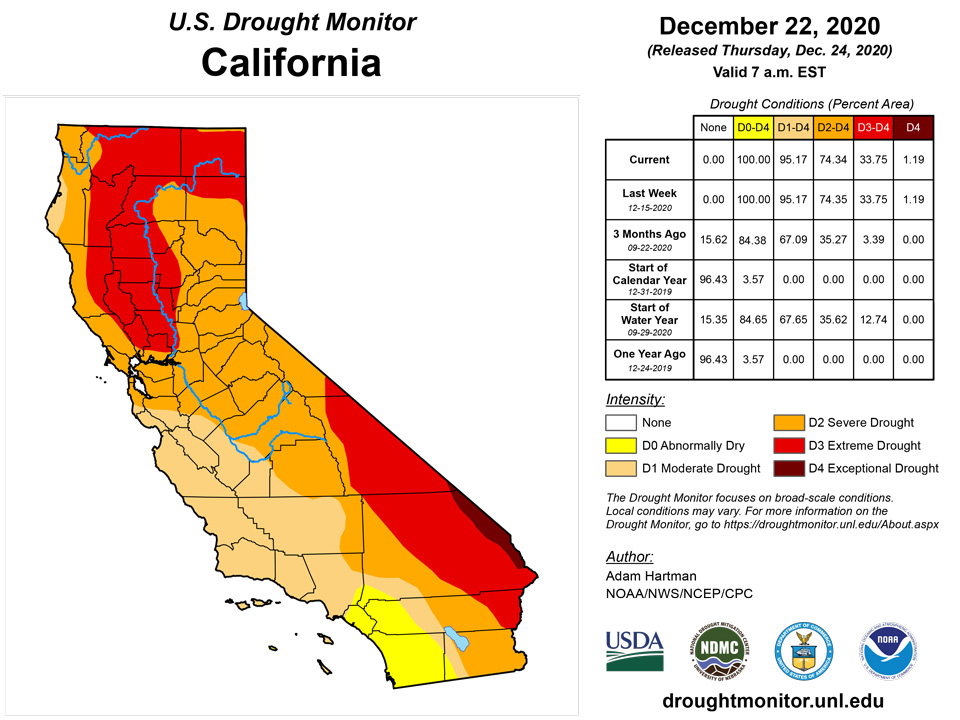
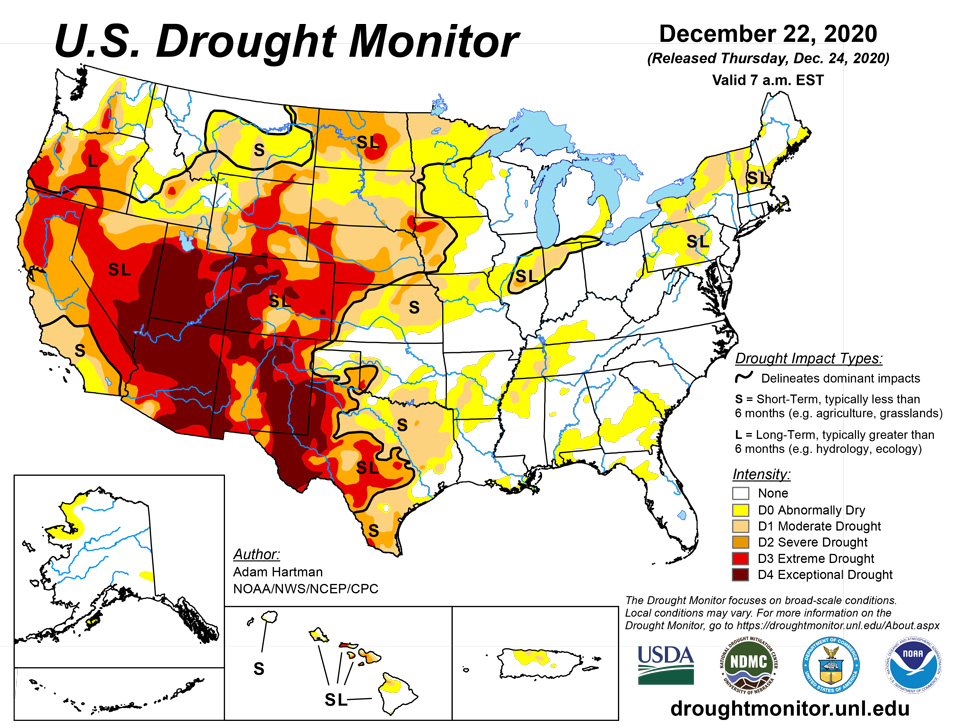
California and National Drought Summary for December 22, 2020
Summary
December 24, 2020 - Most of this week’s precipitation across the CONUS fell on portions of the Pacific Northwest, Southeast, and Northeast. Typical of La Nina conditions, the northward displacement of the storm track across the West so far this season has resulted in near to above-normal snowpack across the Pacific Northwest and northern Rockies, and below-normal southward. This week mainly saw a continuation of that seasonal signal, with above-normal precipitation falling again along coastal ranges and the Cascades from central Oregon northward to Canada, leading to some minor improvements, mainly in northwestern Oregon. However, this week did see a slight southward shift in the storm track, providing central and northern California some much needed, albeit below near-normal, precipitation. Over the eastern United States, a storm system developed over the Southeast early in the period and transitioned into a strong Nor'easter that impacted much of the Mid-Atlantic and Northeast, with a swath of 1 to 2 feet of snowfall extending northeastward from southern Pennsylvania into southern Maine. In the wake of that system, several short-wave troughs provided some additional precipitation across the Great Lakes and Northeast. Elsewhere in the CONUS, several areas of the High Plains, Southwest, and western sections of the Midwest saw little to no precipitation. However, the time of year has minimized degradation of drought in many of these areas with low temperatures, frozen ground, and little or no evapotranspiration. Additionally, temperatures averaged near to below-normal across the southern tier of States, further minimizing any deteriorations.
Much of Alaska has received near to above-normal precipitation during the first half of Fall, with some sporadic stations depicting some minor dryness in the last month. However, snowpack is above-normal everywhere south of the Brooks Range for the season as a whole, limiting impacts and warranting D0 removal in the Yukon Flats. In Hawaii, the Big Island received beneficial rainfall after a dry first half of December. However, farther west, southwestern Oahu has shown a drying trend over the past 90 days, resulting in some D1 expansion. Puerto Rico experienced a dry final 4-6 weeks of its wet season, which ended at the start of December. Some expansion of abnormal dryness (D0) was warranted, including some D1 introduction in counties with some locally higher deficits.
Northeast
Last week's winter storm left much of the Northeast blanketed in snow, with a swath of 1 to 2 feet (locally exceeding 40 inches), extending from southern Pennsylvania into southern Maine. Synoptic forcing and widespread snowpack led to below-normal average high temperatures (slightly above freezing to below freezing) for much of the region, resulting in little to no snowmelt and reducing any meaningful recharge of soil moisture. Additionally, this snowpack limits any direct evaporation from soils. Despite a very weak response in some of the 7-day average stream flows, no major region-wide adjustments were warranted this week, with the exception of southern New Hampshire, where D2 was improved to D1. In addition to above-normal precipitation the past 1 to 2 months across southern New Hampshire, ground reports have indicated much improved water tables and near-normal water levels in nearby lakes, ponds, and streams.
Southeast
The Southeast saw much of its precipitation early in the period (the precursor to the Nor’easter), and later in the week along a frontal boundary associated with a fast-moving short-wave during the weekend. In northern Florida and southern Georgia, D0 removal was warranted in areas receiving more than 1.5 inches of rainfall since Tuesday. D0 remains in surrounding areas, as several areas have 2 to 4 inch rainfall deficits going back 60 days, with localized 4 to 6 inch deficits going back 90 days. Near to below-normal precipitation fell over the remainder of the Southeast; however, amounts were large enough to stave off any further degradation across the region.
South
Much of the region saw below-normal temperatures, and the largest precipitation amounts fell across southeastern Texas, extending eastward to Louisiana and northeastward to the Tennessee Valley. Locations east of Austin, Texas, and along the western Gulf Coast, saw above-normal precipitation (1 to 1.5 inch totals, with some localities receiving more than 2 inches), leading to some D1 and D2 improvement near Austin and a reduction in D0 coverage in southern Louisiana. Western and central Texas saw some degradation in D1-D3 areas, with lack of precipitation (less than 10 percent of normal precipitation in the last 90 days) and low relative humidity. Some slight trimming of the abnormally dry (D0) area in north-central Oklahoma, with 0.25 to 0.5 inches of precipitation falling last week, near-normal average temperatures, and 30-60 day precipitation totals ranging between 150 and 175 percent of normal. Some D0 reduction was also warranted in northern Louisiana and central Mississippi, as SPIs across several time periods show mixed weak above and below-normal signals, indicating near-normal conditions. Some expansion of D0 conditions occurred in north-central and central Arkansas, in favor of D0-D1 SPIs across various periods, coupled with 90-day deficits of 4 to 6 inches (localized 6 to 8 inches). Some southward D1 expansion in southern Tennessee was also warranted in areas missing out on relatively higher rainfall this week, continuing to add to deficits there (6 to 8 inch deficits going back 90 days).
Midwest
In the Midwest, most precipitation fell over the Great Lakes and across the Corn Belt, resulting in near-normal precipitation across the Great Lakes, but slightly below-normal precipitation in the Corn Belt. However, average high temperatures hovered between 30°F and 40°F, minimizing meaningful evaporation from the soils, resulting in no degradation of existing drought or abnormally dry (D0) areas. Farther west, however, some D0 expansion was warranted in southern Minnesota, as this area has experienced a slow drying out over the last 30 days (30-day SPIs of D3-D4). Above-normal temperatures (and average high temps above freezing), in addition to below-normal snowpack and windy conditions, have allowed for additional evaporation of topsoil moisture due to increased surface exposure.
High Plains
The mountainous areas of Colorado and Wyoming saw some additions to their snowpack this week, but amounts were near-normal at best. Above-normal temperatures were widespread across the region, with the highest positive average temperature anomalies (greater than 8°F) across the Dakotas. These positive anomalies can mainly be attributed to below-normal snowpack across much of the Northern Plains. Liquid-equivalent precipitation amounts averaged between 0.01 and 0.25 inches across several locations in the High Plains Region, with several spotty near-normal amounts reported in the Central Plains (co-located with areas seeing the highest average high temperatures) and portions of the Dakotas, reducing further impacts and degradation. Several USGS stations across the region are reporting near and above-normal 7-average stream flows. As such, no changes to drought coverage are warranted this week across the High Plains Region.
West
Many improvements in the Western Region this season have been designated to the Pacific Northwest due to typical La Nina conditions aiding in a northward-displaced mean storm track. As a result, the Cascades and northern Rockies have accumulated above-normal snowpack, with snow water equivalent (SWE) of 100%-125%. Meanwhile, areas southward have experienced below-normal precipitation and reduced snowpack, ranging from 75% of normal in the central Rockies to less than 25% of normal in the Southwest. This week saw a continuation of the La Nina projection on seasonal precipitation, with the heaviest precipitation (150%-300% of normal) in the coastal ranges and Cascades, resulting in some localized D1 and D2 improvement in western and northeastern Oregon. Additionally, USGS 7-day average stream flows are above-normal, and these same areas are showing surpluses in water year-to-date (WYTD) precipitation estimates. Some precipitation also fell across northern and central California, the Great Basin, and central Rockies. However, amounts were modest, resulting in no major changes this week. Despite the Southwest missing out on precipitation this week, precipitation from the prior week and below-normal average temperatures this week warranted no further degradation.
Alaska, Hawaii, and Puerto Rico
Removal of the area of D0 near the Yukon Flats in Alaska was warranted this week. Despite the area receiving 30 percent of normal precipitation in the last 30 days as a whole, precipitation normals are relatively low this time of year and above-normal precipitation was reported by a nearby station the past couple of weeks. SWE is also above-normal for the season so far, resulting in minimal impacts from short-term deficits.
The east side of the Big Island of Hawaii received some beneficial rainfall after being dry for much of early December. Further westward along the island chain, however, some westward expansion of D1 was warranted in southwestern Oahu due to a drying trend over the past 90 days and 30-day SPIs hovering in the D1-D2 range. Additionally, a nearby USGS station is reporting much below-normal (less than 10 percent of normal) 7-day average stream flow.
Some westward expansion of D0 was warranted into northern Lares, northeastern San Sebastian, and Quebradillas Counties in Puerto Rico, along with southeastward D0 expansion into northern Barranquitas and much of Naranjito Counties, as these areas depict below-normal precipitation (greater than 4 inch 90-day rainfall deficits). Areas of D1 drought designation were added in Arecibo County and near Morovis County, as these areas have 8-12 inch precipitation deficits going back 90 days (per Advanced Hydrological Prediction Service estimates). Additionally, a few nearby USGS stations are reporting below-normal (10-24 percent of normal) 7-day average stream flows.
Pacific Islands
The weather conditions across the U.S.-Affiliated Pacific Islands (USAPI) during this USDM week (12/16/20-12/22/20) were dominated by a near-equatorial trough in western Micronesia and trade-wind convergence across eastern Micronesia. A dissipating cold front/shear line lingered across parts of the Marianas. Tropical Cyclone Yasa and an associated monsoonal trough moved further southwest away from American Samoa, while a high pressure ridge approached from the northeast. Before it moved out of the area, the monsoonal trough gave the Samoan Islands several inches of rain.
Satellite-based estimates of 7-day precipitation (QPE) showed a broad band of 2+ inches of rain across Palau and Yap State, with lesser amounts extending from the equator to 10 degrees North latitude. The band narrowed across Chuuk, Pohnpei, and Kosrae States in the Federated States of Micronesia (FSM) and across the Marshall Islands (RMI), extending roughly from 4 to 7 degrees N latitude. Little to no rain was indicated north and south of the band in eastern Micronesia. Little to no precipitation was indicated across the Marianas. South of the equator, the monsoonal trough was part of the South Pacific Convergence Zone (SPCZ). The SPCZ extended from roughly Indonesia southeastward to south of the Samoan Islands. The satellite QPE showed 2 to locally 4+ inches of rain within the SPCZ, with American Samoa being brushed by the edge of this mass of rain.
The Republic of Palau was wet (more than the 2-inch weekly minimum needed to meet most water needs) this week, with over 3 inches of rain reported at Palau IAP (4.29 inches) and Koror COOP (3.50). Monthly totals so far were over the 8-inch monthly minimum needed to meet most water needs: 12.08 inches at Palau IAP and 9.51 at Koror COOP. D-Nothing continued at Palau.
In the Marianas, less than half an inch of rain was recorded at Guam (0.30 inch), Rota (0.19), Saipan IAP (0.37), Saipan ASOS (0.48), and Saipan NPS station (0.34). This week marked the second dry (less than the one inch weekly minimum) week at Saipan and Rota. But monthly totals for December (through the 22nd) have been wet, well above the 4-inch monthly minimum at Guam (7.06 inches), Saipan IAP (6.52), and the Saipan ASOS station (7.17). With 3.33 inches so far this month, Rota is above the minimum for this point in the month. D-Nothing continues across the Marianas.
Trade-wind convergence brought abundant rainfall across a swath of the FSM this week. Weekly rain gauge totals ranged from 2.24 inches at Ulithi to 5.55 inches at Yap (1 day missing), 5.90 inches at Pingelap, and 6.30 inches at Lukonor. But it was drier to the north and south of this wet band. The drier weekly precipitation totals included 1.31 inches at Chuuk, 0.41 inch at Kapingamarangi, 1.06 inches at Nukuoro (1 day missing), and 1.85 inches at Woleai. Fananu recorded no measurable rain this week, based on 5 days of data. But the previous week and/or the month so far have been wet (above minimums) at most of these stations, so D-Nothing continued. The only exception was Kapingamarangi, where D4-SL continued. The 0.41 inch of rain which fell at Kapingamarangi this week brought the monthly total to 2.05 inches, and both of these are still below their respective minimums. The last 3 weeks have been below the weekly minimum, and the last 8 months have been dry at Kapingamarangi. According to the latest report from Kapingamarangi officials received by the National Weather Service, there is only one public water tank left for the island which is about 10 to 15% full and the other full tank that was on the report last week is contaminated and is not safe for use. Private water catchment tanks are now at 20% average capacity and there is a drought relief request from the Kapingamarangi municipal office to the Governor's office.
In the Marshall Islands, no data was received from Mili or Utirik this week or the last several weeks, so an analysis could not be made for these stations. The reservoir level at Majuro was below the 80%-of-maximum threshold for concern for the last 7 days, but over 3 inches of rain (3.06) was observed this week and the monthly total rainfall (through December 22) was 10.82 inches, which is over the monthly minimum, so D-Nothing continued. Jaluit reported 5.45 inches of rain for the week and 10.08 inches for the month (but with December 6 missing), and Ailinglaplap recorded 3.15 inches for the week and 14.43 inches for the month, so D-Nothing continued at these 2 stations. The convergence rain band was situated over southern portions of the RMI but left northern islands dry. Kwajalein received 0.73 inch of rain this week and only 2.69 inches of rain so far this month (through the USDM cutoff of December 22), and the last 3 weeks have each been below the weekly minimum to meet most water needs. The monthly total so far at Wotje is 3.82 inches (which is below the monthly minimum needed to meet most water needs) and no measurable rain has fallen for the last 16 days. D0-S was introduced at Kwajalein and Wotje.
SPCZ rains kept American Samoa wet this week, with over 2 inches of rain reported at the automated stations at Toa Ridge (2.58 inches) and Siufaga Ridge (3.12 inches) and at Pago Pago (4.50). With this month and the last several months wet, D-Nothing continued at Tutuila.
Virgin Islands
A mid-level ridge with dry air at the mid-levels over the Caribbean basin inhibited precipitation over the USVI during this USDM week (12/16/20-12/22/20). At lower levels, weak trade wind perturbations brought showers, but precipitation amounts were generally light.
Radar-based estimates of rainfall for the 7 days ending at 12z on Tuesday depicted up to half an inch of rain over parts of St. John and St. Thomas. Less than a fourth of an inch was indicated over western portions of St. Croix with little to no rain over the eastern portions.
Scattered showers produced a range of rainfall totals in the station gauges across St. Croix this week. Amounts ranged from about a tenth of an inch at Rohlsen AP (0.09 inch) and the CoCoRaHS station at Frederiksted 0.5 N (0.09) to two-thirds of an inch at Christiansted 1.6 E (0.63). Monthly totals (through December 22) ranged from 1.17 inches at East Hill to 3.12 inches at Frederiksted 2.3 N. The 1.17 inches at East Hill was 55% of normal and the 1.58 inches at Rohlsen AP was 72% of normal. USGS well data are available again. The Adventure 28 USGS well level has been steady over the last couple of weeks and is at its highest level since July 2019. The year-to-date rainfall total at Rohlsen AP is 29.80 inches, which is 8.11 inches below normal or 79% of normal. The 1-month Standardized Precipitation Index is -1.03 at Rohlsen AP and -1.04 at East Hill, and the 9-month SPI is -0.84 at Rohlsen AP; these values are at D1 levels. But the SPI values at the other time frames are either wet or barely D0. The USDM status of D0-SL continued for St. Croix.
On St. Thomas, weekly gauge rainfall totals ranged from a fifth of an inch at King AP (0.21 inch) and the CoCoRaHS stations at Charlotte Amalie 5.1 E (0.18) and Anna's Retreat 2.5 ESE (0.22), to half an inch at Charlotte Amalie 1.4 NE (0.45). Monthly totals for December (so far) were barely an inch at King AP (0.92 inch), Charlotte Amalie 5.1 E (1.05), and Charlotte Amalie 1.4 NE (0.95), and well less than an inch at Anna's Retreat 2.5 ESE (0.81). The monthly total at King AP is 43% of normal, but the yearly total (35.68 inches) is 93% of normal or just 2.86 inches below normal and the SPI values are not yet at any Dx level. The Grade School 3 USGS well has been declining during the last 2 weeks, but is still at its highest level in last 9 months. With dry (below normal) weather the last 3 weeks and declining well levels, St. Thomas will be watched for possible D0-S, but for now D-Nothing continues.
On St. John, the station at Windswept Beach reported 0.43 inch of rain this week, bringing the December total (through the 21st) to 2.47 inches. The long-term average for December is 3.83 inches which gives a long-term weekly average of about 0.86 inch. These data indicate that this week (and last week), as well as the month so far, were drier than average. The CoCoRaHS stations at Cruz Bay 0.8 NE and Cruz Bay 1.6 E had weekly totals of 0.19 and 0.42 inch, respectively, and monthly totals of 2.10 and 3.04 inches, respectively. The CoCoRaHS station at Coral Bay 0.7 WSW reported 0.14 inch for the week and 2.23 inches for the month. The SPI values at Windswept Beach were not yet at any Dx level. The Susannaberg DPW 3 USGS well has been declining during the last 2 weeks, but it is still at the highest level it has been in the last 2 years. Consequently, the USDM status for St. John continues at D-Nothing.
Looking Ahead
The 5-day Quantitative Precipitation Forecast (QPF) from the NWS Weather Prediction Center (December 24-28) depicts the heaviest precipitation fall across the eastern and western CONUS. In the eastern CONUS, a strong low pressure system is expected to develop over the Midwest, with a trailing frontal boundary extending southward along the Mississippi Valley to the Gulf Coast, and move eastward early in the period, intensifying as it reaches the East Coast. Heavy precipitation is likely along and ahead of the frontal boundary, along with a strong moderation of temperatures, with some snowfall on the backside of the system. After the system’s departure, below-normal temperatures are favored to last through Saturday, before moderating again near the beginning of next week. In the West, a series of low pressure systems are expected to move into the West Coast bringing more than 1.5 inches of precipitation to many areas from Washington to central California, with some much needed precipitation also making into southern California. Later in the period, some of this energy is expected to move across the Southwest and into the Great Plains, increasing chances of precipitation in those regions.
The 6-10 day outlook (December 29, 2020 - January 2, 2021) favors amplified mean troughing across much of the CONUS, with the greatest negative 500-hPa height anomalies centered over the Southwest. This pattern favors an active storm track across the CONUS and above-normal precipitation extending from the eastern Rockies to the East Coast, with enhanced probabilities of above-normal precipitation over the Central Plains and Middle Mississippi Valley. Above-normal precipitation is also favored along the southern Alaska coast and the Pacific Northwest, with mean onshore mid-level flow. Mean surface high pressure over Canada tilts odds toward below-normal precipitation from Montana to northern Minnesota. In association with negative mid-level height anomalies, below-normal temperatures are favored from the Great Basin eastward to the Great Plains. Above-normal temperatures are favored for the eastern CONUS, associated with mean southerly mid-level flow ahead of the trough. Mean onshore mid-level flow from the Pacific increases odds of above-normal temperatures for much of Alaska, with weaker odds in the Pacific Northwest due to a larger northerly component to the flow.
Author(s):
Adam Hartman, NOAA/NWS/NCEP/CPC
Richard Heim, NOAA/NCEI
Dryness Categories
D0 Abnormally Dry—used for areas showing dryness but not yet in drought, or for areas recovering from drought.
Drought Intensity Categories
D1 Moderate Drought
D2 Severe Drought
D3 Extreme Drought
D4 Exceptional Drought
Drought or Dryness Types
S Short-Term, typically less than 6 months (e.g. agricultural, grasslands)
L Long-Term, typically greater than 6 months (e.g. hydrologic, ecologic)
Source: National Drought Mitigation Center

