


California and National Drought Summary for December 29, 2020
Summary
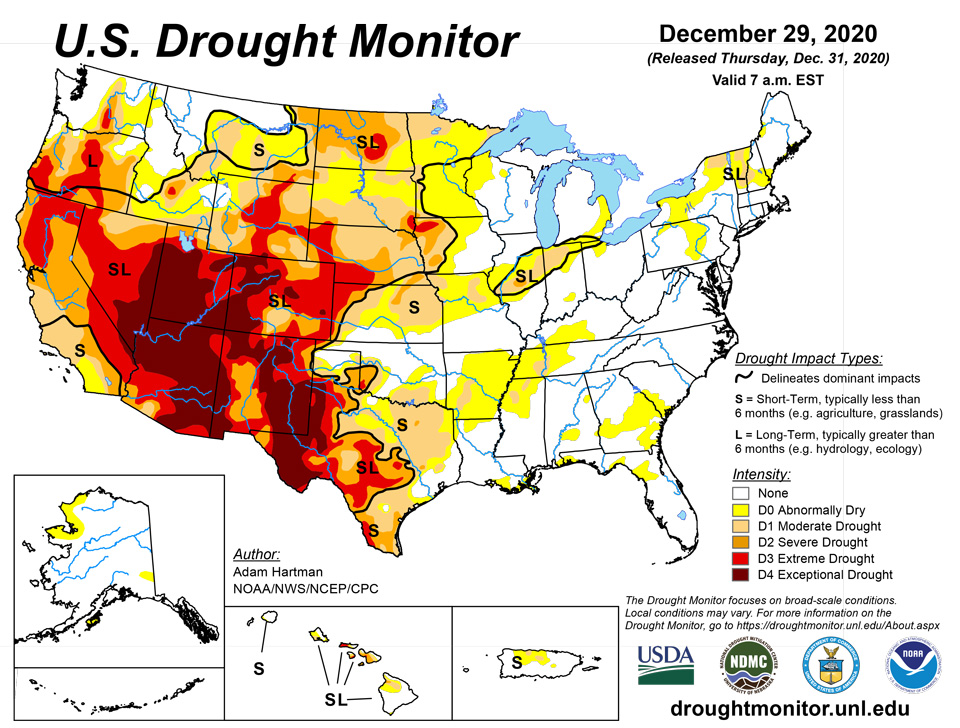
December 31, 2020 - Precipitation fell across much of the United States this week, with widespread moderate amounts (1-2 inches) falling on the eastern third of the CONUS, as a strong storm system moved eastward and exited the Northeast early in the week (Dec. 24-25). Ahead of the frontal boundary associated with this system, strong southerly flow resulted in a rapid warm up and heavy rainfall (2-3 inches, with locally heavier totals), leading to increased snowmelt throughout the Northeast. Behind this system, and in the following days due to lake effect, new snow blanketed many of the same locations that experienced the rapid snowmelt. Toward the end of the week, moderating temperatures led to additional snowmelt across the region. As a result, much of the Northeast saw 1-category improvements (D1 to D0, and D0 to removal). The Southeast also saw improvements in D0 coverage as the frontal boundary from this system extended all the way to the Gulf Coast as it tracked eastward. In the western CONUS, only minor improvements were made in Oregon as long-term indicators (going back to last year’s below normal rainy season) have improved enough to warrant some reduction in extreme drought (D3) coverage. Late in the week (Dec. 28-29), a storm system finally tracked southward this season, bringing above-normal weekly precipitation to coastal southern California. Unfortunately, long-term deficits (beyond 60 days) remained, foregoing D1 improvement. Status-quo was warranted from the Great Basin eastward to the Great Plains as the energy from this system propagated eastward, building upon snow water equivalent (SWE) values and preventing further deterioration; however, the precipitation that did fall was not enough to improve conditions either. In the Northern Plains, snowpack remains well below-normal, leading to some minor degradation in areas where temperatures averaged above freezing and winds were gusty. Elsewhere, the time of year has minimized degradation of drought in many locations, with low temperatures, little or no evapotranspiration, and frozen ground (upper Midwest and Great Plains).
Much of Alaska has received near to above-normal precipitation during the first half of Fall, with some sporadic stations depicting some minor dryness in the last month. However, snowpack is above-normal everywhere south of the Brooks Range for the season as a whole. Hawaii has experienced a dry December and this has led to some D0 degradation to D1 on the Big Island, as pasture conditions have begun to worsen. Puerto Rico observed below-normal precipitation in areas already experiencing abnormal dryness and moderate drought (D0 and D1, respectively), but USGS 7-day average stream flows remain steady from last week.
Northeast
A powerful storm system moved through the Northeast December 24-25, dropping widespread 1.5 to 2.5 inches of rainfall ahead of the frontal boundary, resulting in rapid snowmelt and near-record to record high USGS stream flows. On the backside of the system, additional snowfall fell across many of these same areas, with additional amounts from lake effect snow. However, temperatures moderated (daytime highs averaging 5°F to 10°F above freezing in many locations) after the passage of this system, leading to additional snowmelt. Across most of the region, USGS 7-day average stream flows are well above-normal (above the 90th percentile). Despite some lag in ground water replenishment and deeper layers of soil, agricultural and hydrological impacts across the region are minimal, resulting in 1-category improvements across Pennsylvania, much of New York, and portions of southern New England and coastal Maine.
Southeast
The Southeast saw widespread 1 to 2 inches of rainfall this week, leading to D0 removal in areas receiving locally higher amounts (greater than 2 inches). Despite beneficial rainfall for the region as a whole, D0 remained at many locations as amounts were not enough to erase 90-day deficits (2-4 inch shortages). Groundwater has also not responded adequately enough at this point (D0-D1 in many areas) to warrant additional removal.
South
Most of the precipitation fell on the eastern third of the Southern Region associated with a frontal boundary during Wednesday and Thursday (Dec. 23-24). This led to some minor trimming of D0 in south-central Tennessee and extreme northwestern Alabama which received 1.5 to 2 inches of rain. However, locations along and west of the Mississippi River observed below-normal weekly totals, warranting further expansion of D0 in eastern and northern Arkansas. Some slight improvement (D1 to D0) and removal (D0) north of Houston was also justified in localized areas that received more than 1.5 inches of rainfall. Light precipitation fell over parts of Oklahoma and Texas Monday into Tuesday (Dec. 28-29) as energy exiting the southern Rockies and intensified across the Central and Southern Plains. Despite the late arrival of the system in the Plains this week, the previous week’s release of the Drought Monitor remained representative of conditions across Oklahoma and most of Texas. However, southern Texas saw some slight degradation along the Lower Rio Grande Valley, with D3 expanded northward from Starr County to Webb County, and D2 expansion southward into southeastern Hidalgo and western Cameron Counties. This region has experienced low relative humidity and topsoil moisture. NASA SPoRT soil moisture data depicts the top 10 cm of soil below the 2nd percentile in areas where D3 was expanded, and between the 5th and 10th percentiles where D2 was expanded. NASA GRACE ground water data and the National Land Data Assimilation System (NLDAS) also support this deterioration.
Midwest
The Midwest region saw modest precipitation this week region-wide, except for northern Missouri, southern Iowa, and west-central Illinois, which missed out entirely. Slight surpluses in precipitation were observed mainly from southern Minnesota northeastward to the Arrowhead, northwestern Wisconsin, and the Upper Peninsula of Michigan, but given low normals (liquid water equivalent amounts of 0.1 to 0.5 inches) across the upper Midwest, these small gains resulted in status quo this week. Further south and east through the Corn Belt where precipitation was lacking, some D0 expansion was warranted from central Missouri to northwest Ohio, as well as targeted D0 introduction in southern Indiana as SPIs have trended toward further degradation (widespread D0 and D1 depictions in the last 60 and 30 days, respectively). USGS 7-day average stream flows have also fallen below-normal (10th to 24th percentile). D1 was also expanded southwestward to Pike County in western Illinois and southward to northern Boone and Audrain Counties in northern Missouri for similar reasoning. Additionally, these areas experienced temperatures 6°F to 12°F above-normal this week (and above freezing), along with high winds early in the period.
High Plains
A low pressure system developed over the Central Plains on Monday, associated with energy exiting the eastern Rockies Monday into Tuesday (Dec. 28-29). This provided above-normal precipitation, mostly in the form of snow, across the central and eastern High Plains Region (liquid water equivalent precipitation greater than 200 percent of normal). Despite below-normal precipitation southward, it was enough to stave off degradation across Kansas and Colorado. Further north, however, in northwestern South Dakota and southwestern North Dakota, average maximum temperatures remained above freezing, aided by reduced seasonal snowpack. Additionally, high winds, mainly early in the period, and 1 to 2-month SPEIs ranging from D1 to D4, led to degradation to D1, extending westward into southeastern Montana. SWE percent of normal values have continued to improve; however, most basins in the High Plains Region remained below-normal for the season. The exception was in southern Colorado (near to above-normal SWE) where near to above-normal weekly precipitation added to the snowpack.
West
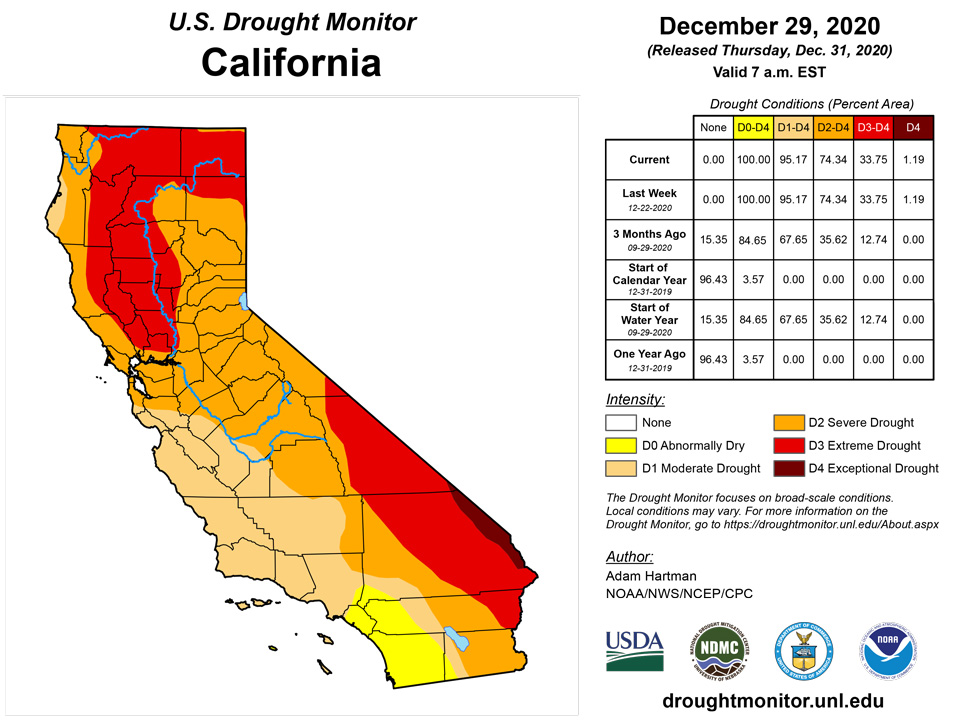
Despite near to below-normal precipitation across the Pacific Northwest this week, precipitation for the season as a whole has finally improved long-term SPIs and SPEIs below D3 status, warranting some minor reduction in D3 (extreme drought) coverage. Ground water has been slower to recover, but given the continued region-wide improvements to SWE, the various indicators supported the improvement this week. Further south, coastal areas of southern California saw above-normal weekly rains late in the period, from San Luis Obispo County southward to the Mexico border. The heaviest rainfall was observed in Santa Barbara County, with some southeastern locations receiving more than 4 inches. However, this was not enough rainfall to overcome long-term deficits (2 to 4 inch deficits going back 60 days). Elsewhere in the Western Region, much-needed precipitation fell across the Great Basin and the Four Corners Region, adding some additional snowpack and preventing further degradation this week. Basin SWE values remain below 75 percent of normal for the southern Great Basin and the Four Corners, but some gains were made in northeastern New Mexico and southern Colorado.
Alaska, Hawaii, and Puerto Rico
Precipitation anomalies across southern Alaska were location-dependent this week, with a mix of above and below-normal observed precipitation. All basins are now reporting near or above-normal SWE, except for Koyukuk River Basin in the central Alaska Mainland, where SWE is 74 percent of normal. As such, Alaska remains as status quo this week.
Hawaii saw below-normal rainfall over most of the state, further increasing seasonal rainfall deficits (1.5 inch and greater deficits state-wide), except for localized spots in Oahu. Natural Resources Conservation Service (NRCS) is reporting worsening pasture conditions on the Big Island, warranting D1 expansion eastward to Mauna Kea. Despite the deficits, USGS 7-day average stream flows remain near-normal throughout much of the state.
Puerto Rico saw below-normal precipitation across many areas currently depicted in D0 and D1, with some localized 1 to 2 inch negative departures from 7-day averages along the northern coast this week. However, given last week’s targeted introduction of D1 coinciding with some of the largest negative departures, and no major changes in USGS 7-day average stream flows, no further degradation was warranted this week.
Pacific Islands
The weather across the U.S.-Affiliated Pacific Islands (USAPI) during this USDM week (12/23/20-12/29/20) was dominated by converging trade winds and trade-wind surges within an Inter-Tropical Convergence Zone (ITCZ) across eastern Micronesia and a near-equatorial trough and weak circulations and converging winds over western Micronesia. At times the surface convergence coupled with divergent winds aloft. A cold front/shear line or small trade-wind disturbances brought showers to the Marianas. A surface trough teased the Samoan Islands with showers, but high pressure and drier air aloft limited rainfall amounts.
Satellite-based estimates of 7-day precipitation (QPE) showed bands of precipitation extending from Indonesia and the Philippines eastward just north of the equator (the climatological ITCZ) and southeastward south of the equator (the climatological South Pacific Convergence Zone, SPCZ). The ITCZ consisted of a near-continuous area of 2+ inches of rain extending across Micronesia, from about 4 to 8 degrees North latitude at the eastern end over the Marshall Islands (RMI), widening to near the equator to about 12 N at the western end in the vicinity of Palau and western Yap State. Large areas of 4+ inches of rain were embedded within the broader band. Little to no precipitation was seen north or south of the main ITCZ band. A sliver of half inch rain was indicated bisecting the Marianas Island chain. South of the equator, the satellite QPE showed areas of 2+ inches of rain surrounding the Samoan Islands, with half an inch or less over the main islands.
With more than the 2-inch weekly minimum (needed to meet most water needs) falling at the Palau IAP (3.25 inches) and Koror COOP station (2.83), and more than the 8-inch monthly minimum occurring so far this month (through December 28) at Palau IAP (15.33) and Koror COOP (12.34), D-Nothing continued at Palau.
In the Marianas, Rota recorded 4.04 inches of rain this week while Guam (0.79 inch) and Saipan were dry (below the 1-inch weekly minimum). Nearly an inch (0.99) fell at the Saipan IAP while less than an inch was recorded at the Saipan ASOS (0.74) and NPS (0.32) automated stations. But monthly totals for December and previous months were above the 4-inch monthly minimum, so D-Nothing continued for Guam, Rota, and Saipan.
Most of the stations in the Federated States of Micronesia (FSM) were wet (above the 2-inch weekly minimum), while the southern stations continued dry. Kapingamarangi received only 0.02 inch of rain this week, bringing the monthly total to only 2.07 inches, so D4-SL continued. If no more rain falls for the rest of this month at Kapingamarangi, December 2020 will rank as the second driest December in a 29-year record; November-December, October-December, and September-December will each rank as second driest, and August-December and July-December as the driest on record. Nukuoro recorded 1.87 inches, and this week marked the second consecutive dry week, but the monthly total (through December 29) was 12.74 inches, so D-Nothing continued. D-Nothing continued at the rest of the FSM stations. Weekly rainfall totals included 7.18 inches at Yap (2 days missing), 3.87 inches at Fananu (1 day missing), 6.30 inches at Pingelap (1 day missing), 6.97 inches at Kosrae, 6.91 inches at Ulithi, and 7.72 inches at Pohnpei. All of the regular reporting stations (except Kapingamarangi) were at or above the monthly minimum precipitation total for December.
The ITCZ brought abundant rain to southern portions of the RMI, while northern portions were dry. D0-S continued at Kwajalein and Wotje. Kwajalein recorded 1.31 inches of rain for the week, which marks the fourth consecutive dry (below the 2-inch minimum) week. The monthly total was 4.00 inches, which is exactly half of the monthly minimum. At Wotje, 2.32 inches of rain fell on December 2 and 1.50 inches on December 6, but no measurable rainfall has occurred in the last 3 weeks. D0-S continued this week, but watch for D1 in coming weeks if no rain or insufficient rain falls. No data was available for Mili or Utirik due to no observer, so an analysis could not be made for those two locations. It was wet this week at Jaluit (4.78 inches), Ailinglaplap (5.37), and Majuro (5.11), with monthly precipitation totals well over the 8-inch monthly minimum, and the Majuro reservoir storage on December 29 was 28.4 million gallons, which is above the 80% threshold for concern, so D-Nothing continued for those locations.
This week broke a string of wet weeks in American Samoa. An inch or less of rain was measured at the automated stations at Toa Ridge (0.99 inch) and Siufaga Ridge (0.60), while less than half an inch was recorded at Pago Pago (0.40). But monthly totals for December and previous months were well above the monthly minimum, so D-Nothing continued at Tutuila.
Virgin Islands
An easterly disturbance brought showers to the USVI early this USDM week (12/23/20-12/29/20) and a surface trough induced by a cold front moving off the U.S. mainland triggered showers later in the week. The surface features were opposed by upper-level ridging and drier air aloft.
Radar-based estimates of rainfall for the 7 days ending at 12z on Tuesday showed half an inch or more of precipitation across western portions of St. Croix and parts of St. Thomas, a fourth to half an inch over St. John, and less than a fourth of an inch over the eastern end of St. Croix.
Western parts of St. Croix were wet this week while eastern parts were dry. Weekly rainfall totals recorded by CoCoRaHS stations ranged from 0.25 inch at Christiansted 1.8 ESE (through December 27), 0.34 inch at Christiansted 4.1 ESE, and 0.51 inch at Frederiksted 0.5 N to 0.69 inch at Christiansted 1.6 E and 1.28 inches at Frederiksted 2.3 N. Rohlsen AP reported 0.44 inch, which is below normal for the week, and 2.02 inches for the month, which is 0.79 inch below normal or 72% of normal. East Hill recorded 0.78 inch for the week and 1.95 inches for the month, which is 71% of the month-to-date normal. Standardized Precipitation Index (SPI) values for Rohlsen AP were at D0 and D1 levels for the 3- and 9-month time scales, respectively, and no drought or abnormal dryness (but very close to D0) at the other time scales. The USGS Adventure 28 well has been holding steady the past 3 weeks, and was at the highest level it’s been since early July 2019. The USDM status for St. Croix continued at D0-SL.
On St. Thomas, weekly rainfall totals had a large range from dry to wet, with CoCoRaHS stations reporting 0.45 inch at Charlotte Amalie 5.1 E, 0.84 inch at Charlotte Amalie 1.4 NE, and 1.54 inches at Anna's Retreat 2.5 ESE. King AP recorded 0.45 inch for the week, which is below normal, and 1.37 inches for the month so far, which is 1.43 inches below normal or 49% of normal. Each of the last 4 weeks has been drier than normal at King AP. SPI values at King AP were at D1 levels for the 1-month time scale and D0 at 9 months, but neutral at the other time scales. The USGS Grade School 3 well continued its steady decline over the last 3 weeks, but was still at its highest level since March 2020. There appeared to be early signs of vegetation stress in an aerial photograph of Inner and Outer Brass, islands just off the north shore of St. Thomas. With this being the dry season, D-Nothing continued on St. Thomas this week, but the island will be watched for possible D0-S in the weeks ahead if pronounced dryness develops.
On St. John, rainfall amounts at the CoCoRaHS stations ranged from two-thirds of an inch at Cruz Bay 0.8 NE (0.65 inch), Cruz Bay 1.6 E (0.69 inch), and Coral Bay 0.7 WSW (0.67 inch), to almost an inch (0.94) at Windswept Beach which was above the long-term average. Monthly totals ranged from 2.75 inches (at Cruz Bay 0.8 NE), to 3.41 inches (at Windswept Beach) and 3.73 inches (Cruz Bay 1.6 E). The Windswept Beach value for the month was near the long-term average for December. The 12-month SPI value at Windswept Beach was at D0 levels, but the other time scales were at no drought or abnormal dryness, or even on the wet side of the scale. The USGS Susannaberg DPW 3 well continued its steady decline over the last 3 weeks, but was still at its highest level since early February 2020. D-Nothing continued at St. John.
Looking Ahead
The 5-day Quantitative Precipitation Forecast (QPF) from the NWS Weather Prediction Center (December 31, 2020 – January 4, 2021) depicted heavy precipitation along the West Coast, from northern California northward to Vancouver Island, associated with a series of potent storm systems. Across the eastern CONUS, an active storm track favors widespread precipitation totals exceeding an inch from the Southern Great Plains eastward and northeastward to the Atlantic Coast, excluding the Florida Peninsula. This is in addition to precipitation falling in the first 2 days of the period across many of these same areas. Heavier precipitation (more than 3 inches) is likely from eastern Texas to the Tennessee Valley over the next 5 days, and west of the Big Bend area in Florida. Little to no precipitation is expected from the Four Corners Region to the Northern Plains and Upper Midwest. A southern shift in the western storm track is expected to occur toward day 5, leading to below-normal temperatures across the southwestern CONUS. The lack of seasonal snowpack is expected to remain intact across the Northern Plains, contributing to large positive temperature anomalies. In the eastern CONUS, mean southerly flow is expected to dominate, keeping temperatures anywhere from 5°F to 10°F above-normal.
The 6-10 day CPC extended range outlook (January 5-9, 2021) favored amplified mean troughing from Alaska southeastward to the southwestern CONUS, indicating a southward shift in the storm track along the West Coast. Ridging is favored to dominate much of the eastern CONUS, with the highest mean mid-level positive geopotential height anomalies over the Great Lakes and Northeast. Below-normal temperatures and precipitation are favored over western and northern Mainland Alaska, respectively, while odds tilt toward above-normal precipitation along the southern Alaska coast. Increased odds of below-normal temperatures in the southwest CONUS are associated with below-normal mid-level heights. Ahead of the mean trough over the West, above-normal precipitation is favored over the Central Plains and western Corn Belt. Additionally, southerly to southwesterly mean flow enhances odds of above-normal temperatures across much of the eastern two-thirds of the CONUS. With the amplified troughing across the western CONUS, enhanced odds of above-normal precipitation extend along the entire West Coast and into the Great Basin and Four Corners region. Probabilities of below-normal precipitation are increased for the Northeast, underneath positive mean mid-level height anomalies, and in Florida and southeastern Georgia, as any passing frontal boundaries are expected to remain farther north.
Author(s):
Adam Hartman, NOAA/NWS/NCEP/CPC
Richard Heim, NOAA/NCEI
Dryness Categories
D0 Abnormally Dry—used for areas showing dryness but not yet in drought, or for areas recovering from drought.
Drought Intensity Categories
D1 Moderate Drought
D2 Severe Drought
D3 Extreme Drought
D4 Exceptional Drought
Drought or Dryness Types
S Short-Term, typically less than 6 months (e.g. agricultural, grasslands)
L Long-Term, typically greater than 6 months (e.g. hydrologic, ecologic)
Source: National Drought Mitigation Center

