


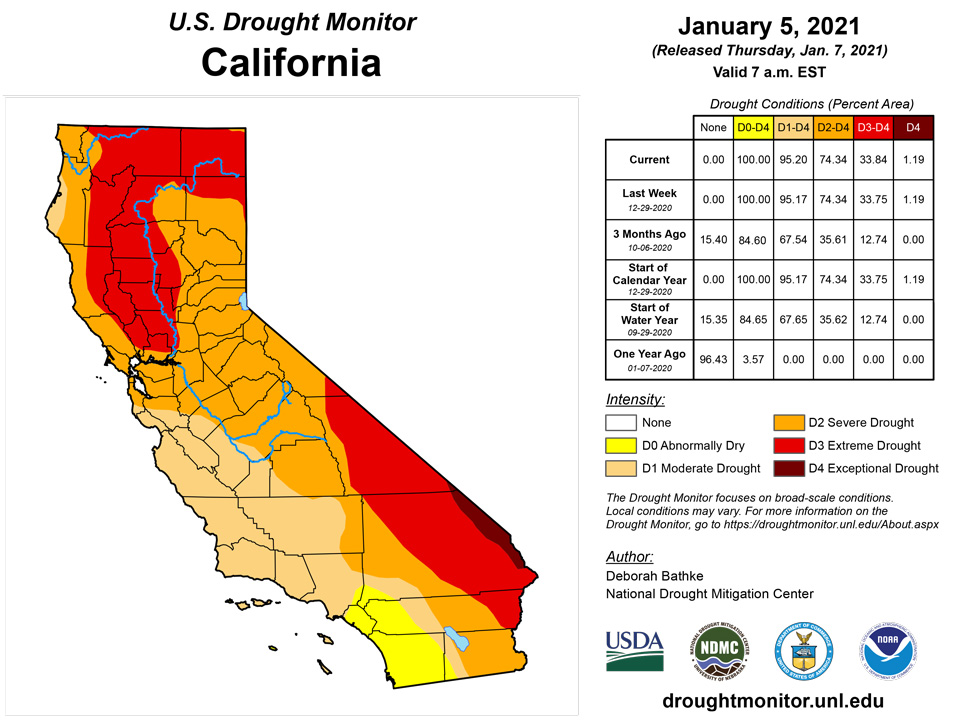
California and National Drought Summary for January 5, 2021
Summary
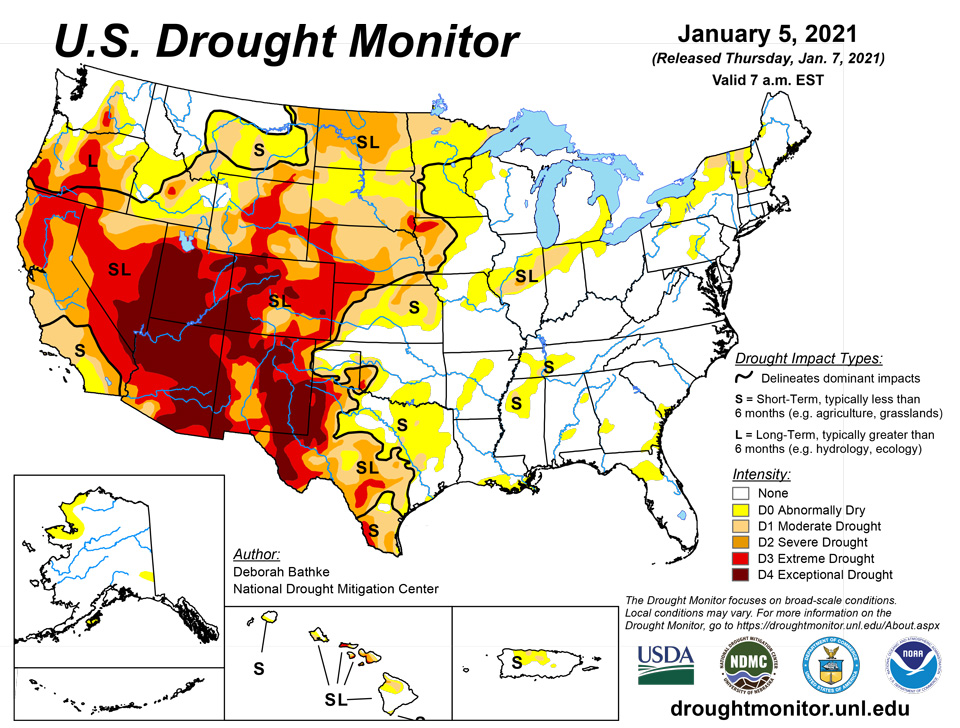
January 7, 2021 - Since the release of last week’s map, several storm systems impacted the Lower 48. The first spread snowfall across the Rockies and into the Plains and Midwest. The second spread snow and ice from Texas across the central U.S. and into the Northeast. Meanwhile the Pacific Northwest was battered with a series of strong Pacific storms that brought heavy rain and mountain snow. The overall effect generally brought improvements in drought conditions to the Northwest and across an area extending from Texas to Pennsylvania. Deteriorating conditions were minimal and limited to areas such as the Pacific Northwest, North Dakota and Hawaii, where moisture deficits continued to increase. In all, the percent area of the U.S. experiencing moderate drought or worse stands at 45.76%, down from 48.99% last week.
Northeast
Rain and snow this week helped erase short-term precipitation deficits across much of the region, helping return streamflow to normal conditions. Because dryness is still apparent beyond 60 days, areas of moderate drought are still depicted in northern New York, Vermont and New Hampshire. However, the designation has been switched from “SL” to “L” indicating that longer-term time scale of the drought.
Southeast
Above normal rainfall stretched from the Florida Panhandle to coastal Virginia, with totals ranging from 2 to more than 6 inches. The rain helped eliminate all but a few remaining pockets of abnormal dryness (D0) in Georgia, Florida and South Carolina where deficits remain at 90 days and longer. D0 expanded in north central Florida, which missed out on last week’s rain.
South
Widespread above normal precipitation fell across the region resulting in large swaths of drought improvements. In Texas, this week’s winter storm brought 1 to 4 inches of precipitation, more than what is normally received in an entire month this time of year. This resulted in one-category, and localized two-category improvements to drought areas in all but the far western part of the state, the Panhandle and South Texas. Moderate drought (D1) was removed from southeast Oklahoma and Arkansas and reduced in Mississippi and Tennessee where rainfall exceeded more than three times the normal amount. In addition to helping chip away at short- and long-term precipitation deficits across the region, soil moisture and streamflow showed recovery.
Midwest
Rain and snow in the Midwest exceed more than 200% of normal in the drought areas of northern Missouri, Illinois and Indiana. This resulted in the removal of moderate drought (D1) from Missouri. In Illinois and Indiana, the areas of moderate (D1) and severe (D2) drought remain unchanged. These areas are labeled with an “SL” to indicate that, in addition to short-term moisture deficits, long-term dryness also exists. Here, precipitation deficits of more than 5 inches are apparent at six months and streamflow and soil moisture remain low.
High Plains
With this week’s band of heavy precipitation falling to the south, the drought status over much of the High Plains remains unchanged this week. Most locations received near-to-below normal amounts. Catching the northern edge of the heavy rain band, one-category improvements were made in southeast Kansas. In North Dakota, extreme drought (D3) was removed from the east central part of the state, since precipitation, soil moisture, streamflow and well data no longer supported the depiction. Severe drought (D2) was expanded in the northwest corner of the state, where moisture deficits have been building for the last six months.
West
A series of storms brought excess rain and snow to parts of the Pacific Northwest. Washington and parts of Oregon saw precipitation in excess of 200% of normal resulting in local one-category improvements to drought areas where precipitation deficits over the last six to 12 months decreased and streamflow and soil moisture showed recovery. Conditions deteriorated in south central Oregon, with the expansion of severe drought (D3). This area has missed out on most of the rain after a very dry year. Much of the rest of the West was relatively dry last week. State drought teams noted that in areas where rain and snow fell, it wasn’t enough to increase moisture availability; in areas where it didn’t the dryness didn’t yet warrant additional degradations.
In Hawaii, rainfall continued to favor the east-facing windward slopes of the state while leeward areas continued to dry out. As a result, abnormal dryness (D0) was expanded on Kauai to cover all of the southern slopes of the island; moderate drought (D1) was expanded on Oahu to cover the west-facing slopes of the Waianae Range and near South Point on the Big Island. Finally, extreme drought (D3) was expanded on Maui and introduced on Kahoolawe. No changes were made to the maps this week in Alaska. The state continues to be free of drought with areas of abnormal dryness near the Wrangell Mountains, in the Far North, and on Kodiak Island. The map also remained unchanged in Puerto Rico with abnormal dryness and pockets of moderate drought (D1) in the north central part of the island.
Pacific Islands
A very dynamic weather pattern dominated the USAPI region this past drought week. Multiple surface troughs/shear lines, a cold front, and the InterTropical Convergence Zone (ITCZ, especially from central Micronesia eastward across the RMI), contributed to the development of rain and thunderstorms across much of this region. Trade wind surges helped to push the ITCZ southward across the northern Federated States of Micronesia (FSM) and the northern Republic of the Marshall Islands (RMI), followed by dry northeasterly trade wind flow. South of the equator, several weak cyclonic circulations embedded within an active South Pacific Convergence Zone (SPCZ), affected the Southwest Pacific. Despite the fact that much of the heavier precipitation fell to the east, south, and southwest of American Samoa, the territory still received well over the minimum rainfall threshold to meet most water needs.
The 7-day satellite-based QPE showed a broad band of heavy rain (2"+) and embedded thunderstorms that extended from the vicinity of Palau eastward across the southern FSM and the southern RMI. Three-quarters of an inch of rain or less fell across Guam and the Commonwealth of the Northern Mariana Islands (CNMI) and the Northern RMI (including Kwajalein and Wotje). South of the equator, rainfall estimates from the SPoRT QPE tool indicated American Samoa had missed out on most of the heavy precipitation located not far to its east, south, and southwest. However, ground-based gauges recorded 3.0-4.5 inches in American Samoa, suggesting much of this week's rainfall was produced by orographic lifting.
The Palau International Airport (IAP) received 1.60 inches of rain this past drought week, with a total of 15.82 inches of rain falling in the month of December. The Koror COOP measured 1.00-inch this past week, and 12.46 inches during December. Palau reached or surpassed the 8-inch monthly rainfall minimum that is required to meet most water needs each month from April through December 2020. Drought-free conditions continue at Palau.
Precipitation amounts were generally light this week across the CNMI and Guam, as the heavy rainfall band remained south of this area, with none of the commonly reporting stations seeing anywhere near the 1-inch minimum rainfall threshold considered adequate to meet most water needs for the week. Guam reported 0.72-inch of rain this drought week, and 8.03 inches for the month of December. Each month from July through December 2020 was wet (i.e. reached or exceeded the minimum threshold of 4 inches). Rota recorded only 0.18-inch of rain this week, and 6.97 inches in December. Similar to Guam, Rota experienced 6 consecutive wet months, from July through December 2020. In Tinian, two-thirds of an inch of rain fell this week. On Saipan, a manual rain gauge at the International Airport observed 0.35-inch of rain this past week, and 7.52 inches in December. Other measurements taken on Saipan included 0.20-inch of rain (ASOS), and 0.28-inch at a National Park Service site. At the ASOS site, each month from February through June 2020 was dry (i.e. receiving insufficient rainfall to meeet most water needs), and each month from July through December was wet. No changes were required to the drought-free designations in Guam and the CNMI.
In western Micronesia, Yap received 2.50 inches of rain (2 days missing) this past week, and nearly 17 inches (16.99) in December. Other locations in the region with their weekly and December rainfall totals include: Rumung (2.19 inches with 4 days missing, and 12.73 inches), Ulithi (1.06 inches with 2 days missing, and 12.42 inches), and Woleai (0.86-inch with 2 days missing, and 8.47 inches). In central Micronesia, Fananu (just north of the main rain band) reported 0.31-inch of rain (1 day missing) during the week, and 16.36 inches in December. Each month from July through December 2020 was wet. Chuuk Lagoon measured 5.08 inches of rain this week, and 20.70 inches in December; while Lukunor received 1.64 inches (2 days missing) of rain this past drought week, 24.71 inches in December, and was wet each month from March through December 2020. Nukuoro measured 6.15 inches of rain this week, 14.50 inches in December, and was wet each month from March through December (except in September, when 5.92 inches of rain fell). In Kapingamarangi, 1.91 inches of rain was observed this week, and 3.71 inches of rain fell during December. Kapingamarangi has been at D4(SL) for a while, by far the most severe drought condition in the entire USAPI region, with its last wet month being April 2020, when 17.06 inches of precipitation was recorded. Despite this week's rainfall total approaching the 2-inch weekly minimum threshold value, it will take substantially more precipitation to begin to overcome the severity and duration of this drought. Eastern Micronesia, being influenced more frequently by the meandering North Pacific ITCZ, saw greater rainfall totals than most of Micronesia. Pohnpei measured 6.00 inches of rain this past week, 26.98 inches in December, and every month from February through December was wet. Pingelap reported 7.29 inches of rain this week, 28.57 inches in December, and most months from February through December 2020 easily met or surpassed the 8-inch monthly minimum rainfall threshold. Even these precipitation totals were exceeded in Kosrae, with 9.46 inches and 29.77 inches reported for the past week, and December, respectively. The weekly value of 9.46 inches comfortably exceeds the monthly minimum threshold (8 inches) for this station! Every month from February through December 2020 was wet in Kosrae. There was no need to change the drought-free designation at nearly all stations this week, except for Kapingamarangi which continues at D4(SL).
In the northern portion of the RMI, drier conditions prevailed as trade wind surges pushed the ITCZ farther south. Kwajalein and Wotje, for example, measured only 0.07-inch and 0.00-inch of rain this drought week. For December, the respective accumulations were 4.03 and 3.82 inches. Ailinglaplap reported 1.19 inches (1 day missing) this week, and 20.03 inches in December. Nearby Jaluit saw similar precipitation totals, 0.93-inch (2 days missing) and 15.19 inches, respectively. Being located deeper within the main rainband this past week, Majuro measured 2.48 inches (1 day missing), 16.95 inches in December, and nearly all months from February through December 2020 were wet, with the exception of March when 5.32 inches of rain fell. Reservoir storage in Majuro currently stands at 28.55 million gallons, which is 79.3 percent of maximum capacity (36 million gallons). No rainfall data was available this week at either Utirik or Mili. No changes were made to the drought depiction this week. Wotje and Kwajalein continue at D0(S), and drought-free conditions continue elsewhere within the RMI.
Though American Samoa missed out on the heavier rainfall totals to its east, south, and southwest, reporting stations still received more than enough precipitation to meet most water needs this week. Pago Pago saw 4.37 inches of rain this week, and 14.55 inches in December. Interestingly, the higher elevation National Park Service sites of Siufaga Ridge and Toa Ridge recorded less rainfall than Pago Pago (3.16 inches and 3.17 inches of rain) during this drought week. The December rainfall totals were 12.77 and 10.02 inches, respectively. No change in Tutuila's drought-free designation was warranted.
Virgin Islands
The Cyril E. King Airport on the island of St. Thomas reported 0.19-inch of rain yesterday, and 0.30-inch of rain so far this month. Since December 1st, this location received 1.74 inches of rain, which is 1.66 inches below normal. CoCoRaHS station VI-ST-1 (Anna's Retreat 2.5 ESE) measured 0.03-inch of precipitation this drought week, while VI-ST-4 (Charlotte Amalie 5.1 E) measured 0.19-inch of rain. The USGS Grade School 3 Well in Charlotte Amalie recently resumed transmission of groundwater data. Provisional data shows the well water level is slightly over 9.0 feet below the land surface. The 1,3,6,9, and 12-month SPI values for the King Airport are -0.86, +0.01, +0.06, -0.52, and -0.28, respectively. Conditions on St. Thomas are being monitored for possible deterioration in the near future. For this week, however, available data supports drought-free conditions.
On the island of St. John, Windswept Beach (CoCoRaHS station VI-SJ-3) reported 0.11-inch of rain this drought week. The precipitation totals for October, November, and December 2020 were 7.96 inches, 7.38 inches, and 3.55 inches, respectively. The 2020 annual rainfall total for this location is 44.67 inches. Elsewhere on the island, no rain was reported at VI-SJ-1 (Cruz Bay 1.8 NNE) during this past drought week, and only 0.02-inch was measured at VI-SJ-6 (Coral Bay 0.7 WSW). Provisional well data at the Susannaberg DPW 3 Well indicates the well water level is slightly over 9.0 feet below the land surface, similar to the Grade School 3 Well on St. Thomas. The 1,3,6,9, and 12-month SPI values for Windswept Beach are -0.84, +0.54, +0.01, -0.52, and -0.53, respectively. Conditions on St. John are being monitored for possible deterioration in the near future. For this week, however, available data supports drought-free conditions.
The Henry E. Rohlsen Airport on St. Croix observed a hundredth of an inch of rain yesterday, and 0.39-inch of rain so far this month. Since December 1st, 2.48 inches of rain fell, which is 0.87-inch below normal. CoCoRaHS stations VI-SC-8 (Christiansted 1.8 ESE) and VI-SC-10 (Christiansted 1.6 E) measured 0.51-inch and 0.55-inch of rain, respectively, this drought week. On the western side of the island, VI-SC-11 (Frederiksted 0.5 N) reported 0.62-inch of rain. The USGS Adventure 28 Well located just north of the Rohlsen Airport reported a provisional well water level near 18.7 feet below the land surface. The UVI sheep farm facility reported 4.36 inches of rain for the month of December (though several days of data were missing early in the month), and 5.90 inches of rain for the month of November. The 1,3,6,9, and 12-month SPI values for the Rohlsen Airport are +0.03, -0.83, -0.51, -0.85, and -0.58, respectively. The drought designation at St. Croix continues to be D0(SL). As with other parts of the USVI, the dry season effectively began following the heavy rain event on December 7th.
Looking Ahead
The National Weather Service Weather Prediction Center forecast for the remainder of the week calls for continued storminess in the Pacific Northwest. Heavy rain is expected along the coastal ranges of Washington, Oregon and northern California, with snow at higher elevations. As the storms move eastward, snow is forecast for the northern and central Rocky Mountains while the northern Plains are expected to receive a wintry mix of rain, snow and/or ice. Forecasts for the southern Plains, South and Southeast call for showers and thunderstorms. Areas from the mid-Mississippi Valley to the Mid-Atlantic can also expect a wintry mix of precipitation while light snow is forecast for the Great Lakes region, Northeast and central Appalachians. Moving into next week, the Climate Prediction Center 6- to 10-day outlook (valid January 12-16) favors above normal temperatures for the Southwest and much of the northern part of the country. Below-normal temperatures are expected in the southern and Mid-Atlantic States. The greatest probabilities for above-normal precipitation are expected in the Pacific Northwest and Northern Plains.
Author(s):
Deborah Bathke, National Drought Mitigation Center
Anthony Artusa, NOAA/NWS/NCEP/CPC
Dryness Categories
D0 Abnormally Dry—used for areas showing dryness but not yet in drought, or for areas recovering from drought.
Drought Intensity Categories
D1 Moderate Drought
D2 Severe Drought
D3 Extreme Drought
D4 Exceptional Drought
Drought or Dryness Types
S Short-Term, typically less than 6 months (e.g. agricultural, grasslands)
L Long-Term, typically greater than 6 months (e.g. hydrologic, ecologic)
Source: National Drought Mitigation Center

