


IMPORTANT NOTE: The employment data for the month of December 2020 is taken from the survey week including Dec. 12. Data for the month of January is scheduled for release on March 12, 2021.
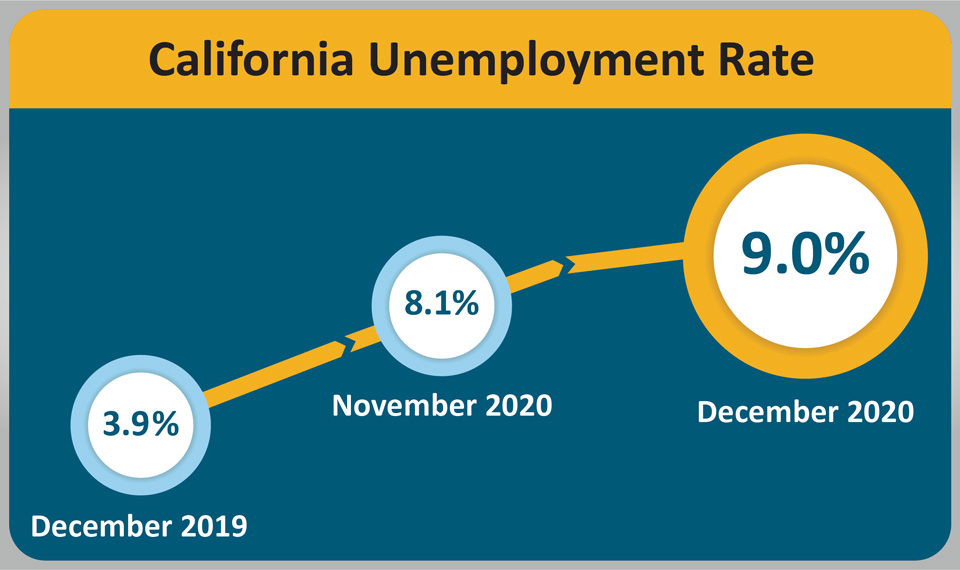
January 24, 2021 - SACRAMENTO – California’s unemployment rate rose 0.9 percentage points to 9.0 percent in December as the state’s employers lost 52,200 jobs1, according to data released on Friday by the California Employment Development Department (EDD) from two surveys. This comes after the state saw a job gain in November (+5,200 jobs). Despite December’s losses, California has regained more than 44 percent of the 2,615,800 nonfarm jobs that were lost due to the COVID-19 pandemic in March and April.

California’s Labor Market, by the Numbers...
- California’s month-over unemployment rate increased from 8.1 percent in November to 9.0 in December2 marking the state’s first month-over rate increase since April 2020.
- Despite the decline, six of California’s 11 industry sectors saw job gains last month. Construction had the state’s largest month-over increase (+31,600) thanks to strong gains in Specialty Trade Contractors and Construction of Buildings.
- Professional and Business Services had the state’s second-largest month-over increase (+29,600) due to large gains in Accounting, Tax Preparation, and Bookkeeping, as well as Management, Scientific, and Technical Consulting.
- Leisure and Hospitality suffered the largest month-over loss (-117,000) largely due to severe losses in Accommodation and Food Services, which accounted for 83.2 percent of the industry sector’s overall loss.
1. The nonfarm payroll job numbers come from a federal survey of 80,000 California businesses.
2. The unemployment rate comes from a separate federal survey of 5,100 California households.
Data Trends about Jobs in the Economy
Total Nonfarm Payroll Jobs
This information comes from a monthly survey of approximately 80,000 California businesses that estimates jobs in the economy – seasonally adjusted.
- Month-over – Total nonfarm jobs in California’s 11 major industries totaled 16,144,400 in December – a net loss of 52,200 jobs from November. This followed an upward-revision of 5,200 jobs for a revised gain of 62,300 jobs in November.
- Year-over – Total nonfarm jobs decreased by 1,410,000 (an 8.0 percent decrease) from December 2019 to December 2020 compared to the U.S. annual loss of 9,374,000 jobs (a 6.2 percent decrease).

Total Farm jobs – The number of jobs in the agriculture industry increased by 24,300 from November 2020 to 380,800 jobs in December. The agricultural industry has lost 49,300 farm jobs since December 2019.
Data Trends about Workers in the Economy
Employment and Unemployment in California
This information is based on a monthly federal survey of 5,100 California households which focuses on workers in the economy.
- Employed – The number of Californians with jobs in December was 17,260,100, a decrease of 91,700 jobs since November, and down 1,469,000 from December of last year.
- Unemployed – The number of unemployed Californians was 1,700,400 in December, an increase of 163,700 over the month, and up by 945,700 in comparison to December of last year.

Unemployment Insurance Claims (Not Seasonally Adjusted)
The following data is from a sample week that includes the 19th of each month: In related data that figures into the state’s unemployment rate, there were 1,007,331 people certifying for Unemployment Insurance benefits during the December 2020 sample week. That compares to 1,278,220 people in November 2020 and 327,751 people in December 2019. Concurrently, 159,092 initial claims were processed in the December 2020 sample week, a month-over decrease of 9,896 claims from November 2020, but a year-over increase of 108,976 claims from December 2019.

| COUNTY | LABOR FORCE | EMPLOYMENT | UNEMPLOYMENT | RATE |
|---|---|---|---|---|
| STATE TOTAL | 18,916,400 | 17,246,800 | 1,669,600 | 8.8% |
| ALAMEDA | 819,800 | 757,100 | 62,700 | 7.6% |
| ALPINE | 630 | 580 | 50 | 7.3% |
| AMADOR | 14,290 | 13,090 | 1,200 | 8.4% |
| BUTTE | 93,800 | 86,100 | 7,700 | 8.2% |
| CALAVERAS | 20,410 | 18,920 | 1,490 | 7.3% |
| COLUSA | 9,660 | 8,160 | 1,500 | 15.5% |
| CONTRA COSTA | 545,800 | 502,800 | 43,000 | 7.9% |
| DEL NORTE | 9,230 | 8,390 | 850 | 9.2% |
| EL DORADO | 90,800 | 84,400 | 6,300 | 7.0% |
| FRESNO | 445,500 | 399,300 | 46,200 | 10.4% |
| GLENN | 12,610 | 11,640 | 970 | 7.7% |
| HUMBOLDT | 60,700 | 56,200 | 4,500 | 7.5% |
| IMPERIAL | 67,100 | 55,300 | 11,900 | 17.7% |
| INYO | 8,230 | 7,660 | 570 | 6.9% |
| KERN | 377,500 | 334,900 | 42,600 | 11.3% |
| KINGS | 56,000 | 49,900 | 6,200 | 11.0% |
| LAKE | 28,610 | 26,050 | 2,560 | 9.0% |
| LASSEN | 9,290 | 8,630 | 660 | 7.1% |
| LOS ANGELES | 4,896,200 | 4,374,500 | 521,600 | 10.7% |
| MADERA | 61,500 | 55,400 | 6,100 | 9.9% |
| MARIN | 134,100 | 126,800 | 7,400 | 5.5% |
| MARIPOSA | 7,160 | 6,420 | 740 | 10.3% |
| MENDOCINO | 36,300 | 33,370 | 2,920 | 8.1% |
| MERCED | 113,600 | 100,500 | 13,100 | 11.5% |
| MODOC | 3,060 | 2,780 | 270 | 8.9% |
| MONO | 8,300 | 7,570 | 740 | 8.9% |
| MONTEREY | 188,700 | 167,200 | 21,500 | 11.4% |
| NAPA | 71,100 | 65,900 | 5,200 | 7.3% |
| NEVADA | 47,420 | 44,180 | 3,230 | 6.8% |
| ORANGE | 1,598,700 | 1,479,700 | 119,100 | 7.4% |
| PLACER | 184,900 | 173,400 | 11,500 | 6.2% |
| PLUMAS | 7,310 | 6,530 | 780 | 10.7% |
| RIVERSIDE | 1,108,600 | 1,008,300 | 100,400 | 9.1% |
| SACRAMENTO | 714,700 | 653,600 | 61,100 | 8.5% |
| SAN BENITO | 30,800 | 28,100 | 2,700 | 8.7% |
| SAN BERNARDINO | 977,800 | 887,700 | 90,000 | 9.2% |
| SAN DIEGO | 1,593,900 | 1,466,500 | 127,400 | 8.0% |
| SAN FRANCISCO | 566,200 | 529,900 | 36,300 | 6.4% |
| SAN JOAQUIN | 325,500 | 290,800 | 34,700 | 10.6% |
| SAN LUIS OBISPO | 131,700 | 122,800 | 8,900 | 6.7% |
| SAN MATEO | 444,300 | 418,600 | 25,700 | 5.8% |
| SANTA BARBARA | 211,500 | 195,500 | 16,100 | 7.6% |
| SANTA CLARA | 1,040,900 | 979,000 | 61,900 | 5.9% |
| SANTA CRUZ | 127,600 | 116,700 | 10,800 | 8.5% |
| SHASTA | 73,400 | 67,500 | 5,900 | 8.0% |
| SIERRA | 1,290 | 1,200 | 90 | 7.0% |
| SISKIYOU | 15,160 | 13,540 | 1,620 | 10.7% |
| SOLANO | 206,100 | 187,900 | 18,200 | 8.8% |
| SONOMA | 250,600 | 234,400 | 16,200 | 6.5% |
| STANISLAUS | 235,100 | 211,700 | 23,400 | 9.9% |
| SUTTER | 41,700 | 37,200 | 4,500 | 10.9% |
| TEHAMA | 24,040 | 21,960 | 2,090 | 8.7% |
| TRINITY | 4,250 | 3,900 | 360 | 8.4% |
| TULARE | 194,100 | 171,200 | 22,900 | 11.8% |
| TUOLUMNE | 19,680 | 17,810 | 1,870 | 9.5% |
| VENTURA | 413,800 | 382,700 | 31,100 | 7.5% |
| YOLO | 106,500 | 99,100 | 7,500 | 7.0% |
| YUBA | 28,800 | 25,800 | 3,000 | 10.4% |
Source: EDD

