


California and National Drought Summary for February 2, 2021
Summary
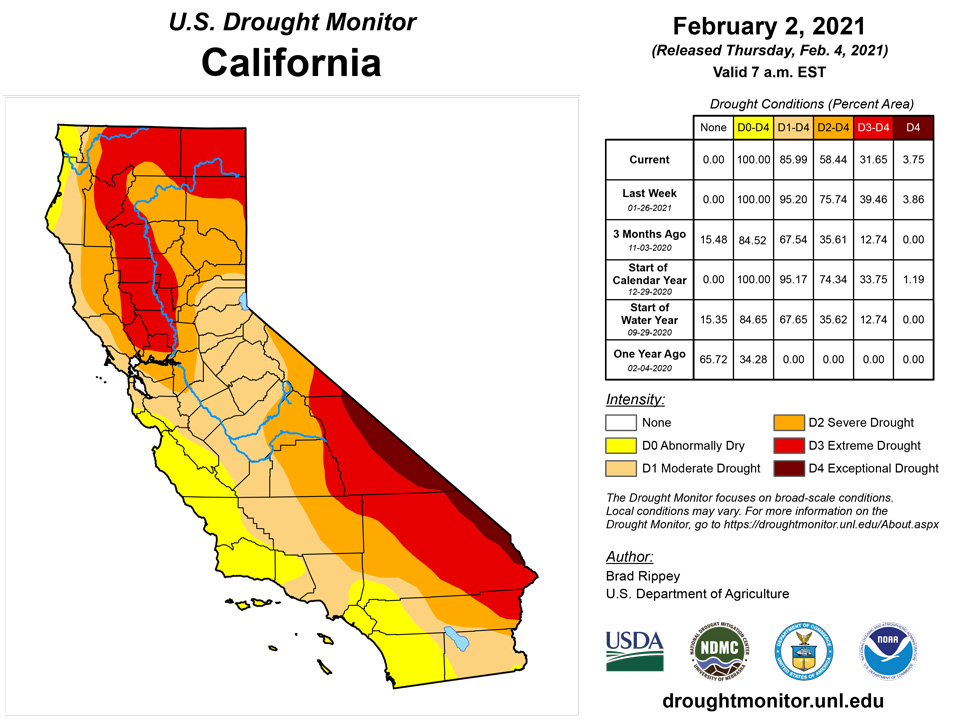
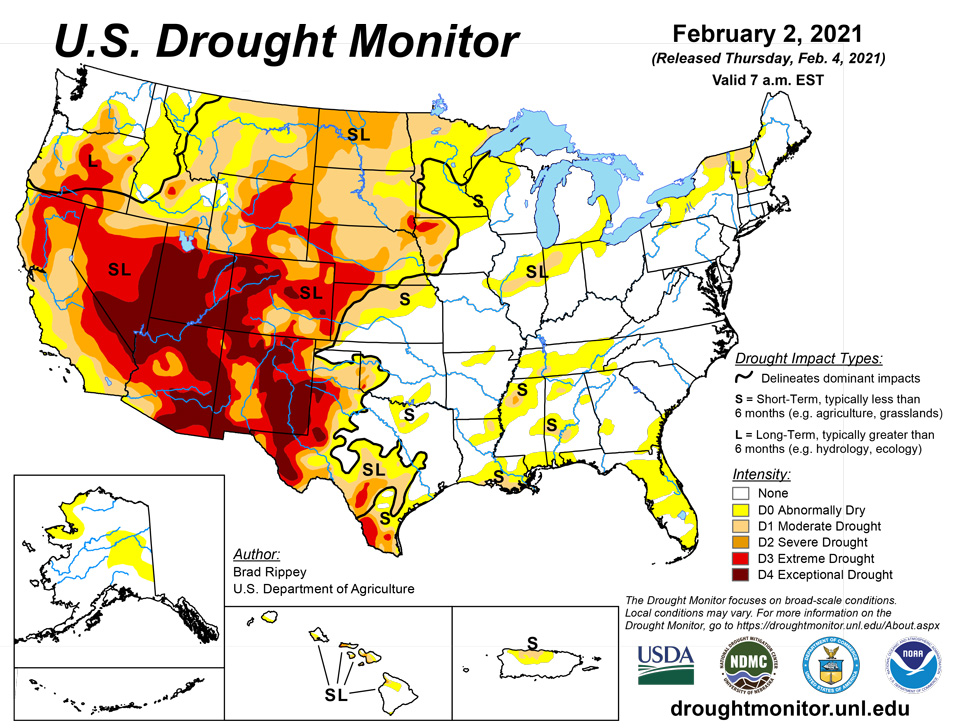
February 4, 2021 - California’s most powerful storm of the season to date delivered drought-easing precipitation, including heavy mountain snow, but caused local flooding and landslides. Impacts from the multi-day storm system extended beyond California, adding to the benefit of other mid-winter weather systems in portions of the Western drought area. As the calendar turned from January to February, the Western storm finally turned eastward, producing wind and wintry precipitation in the Midwest and Northeast, as well as rain showers in the Southeast. As the drought-monitoring period ended, the former Western storm became a powerful low-pressure system along the middle and northern Atlantic Coast. In contrast, mostly dry weather prevailed throughout the 7-day period in several regions, including the northern Plains and the south-central U.S.
Northeast
On January 31 and in early February, heavy precipitation and gusty winds hammered the Northeast, as a slow-moving coastal storm spun just offshore from the northern Atlantic States. Storm-total snowfall amounts of 1 to 2 feet or more were common across central and eastern Pennsylvania, central and southeastern New York, northern New Jersey, and much of New England. When the drought-monitoring period ended on February 2, wintry precipitation had just begun to push into Northeastern areas of dryness (D0) and moderate drought (D1). An exception was central and eastern Pennsylvania, where heavy snow had already fallen, resulting in the removal of D0.
Southeast
Patches of abnormal dryness (D0) and moderate drought (D1) generally expanded, with a few exceptions. For example, most of Florida’s peninsula experienced a very dry January, with monthly rainfall totaling just 0.04 inch (2% of normal) in Melbourne and 0.20 inch (8%) in Vero Beach. In both cities, it was the driest January since 2012, when rainfall totaled a trace. According to the U.S. Department of Agriculture, Florida’s statewide topsoil moisture was rated 38% very short to short on January 31, up from 9% in late-December 2020.
South
Mostly dry weather prevailed, leading to some general expansion of dryness and drought. The region’s most significant drought persisted across western Texas, where modest increases in coverage of moderate to exceptional drought (D1 to D4) occurred. According to the U.S. Department of Agriculture, Texas led the Plains in late January with 41% of its winter wheat rated in very poor to poor condition. Farther east, short-term dryness led to some expansion of abnormal dryness (D0) and moderate drought (D1), mostly from the lower Mississippi Valley and the central Gulf Coast eastward.
Midwest
Late-January precipitation—both rain and snow—chipped away at abnormal dryness (D0) and moderate to severe drought (D1 to D2), mainly in the middle Mississippi Valley. For example, D2 was eliminated from central Illinois, where Springfield received a daily-record precipitation total (1.13 inches) on January 30. In the upper Midwest, however, where little or no precipitation fell, a large area of D0 and moderate to extreme drought (D0 to D3) remained intact.
High Plains
Much of the region settled into a cool, dry pattern, following the central Plains’ snowstorm that peaked on January 25. Further assessment of the that storm led to some additional reductions in drought coverage across the central Plains. In addition, a subsequent weather system clipped eastern Kansas with rain on January 30, helping to further reduce coverage of dryness (D0) and moderate drought (D1). For the areas that were affected by the January 25 storm, snow remaining on the ground into February has helped to boost topsoil moisture. (On January 24, just prior to that storm’s arrival, topsoil moisture was rated at least one-half very short to short in each of the states in the High Plains region, led by Wyoming at 90%, and followed by Colorado at 79%, North Dakota at 75%, South Dakota at 62%, Nebraska at 60%, and Kansas at 55%.) Daily-record snowfall totals in Nebraska for January 25 included 14.5 inches in Lincoln, 11.9 inches in Omaha, and 10.2 inches in Grand Island. For Lincoln, it was the snowiest January day on record (previously, 11.4 inches on January 3, 1971) and the snowiest day in any month since February 11, 1965, when 19.0 inches fell. Lincoln also achieved a January snowfall record, with 18.9 inches (previously, 15.6 inches in 2011). For Omaha, it was the snowiest day since January 10, 1975, when 12.1 inches fell.
West
Heavy precipitation and high winds accompanied a sprawling, slow-moving storm, which primarily impacted California. According to the California Department of Water Resources, the average water equivalency of the high-elevation Sierra Nevada snowpack climbed to 12.5 inches (70% of normal) by February 2, up from about 6 inches (less than 40%) just 10 days earlier. In an average year, nearly 30 inches of liquid accumulates in the Sierra Nevada snowpack by April 1. As the storm arrived on January 27, snow fell on the Sacramento Valley floor, where Redding, California, reported 1.5 inches. From January 25-29, rainfall totaled 14.41 inches in Big Sur, California, about 20 miles north of where a section of State Route 1 slid into the Pacific Ocean. On January 27-28, consecutive daily-record totals were observed in California locations such as Paso Robles (1.39 and 2.94 inches, respectively); Modesto (2.49 and 0.94 inches); and Stockton (1.37 and 1.43 inches). Stockton clocked a southeasterly wind gust to 58 mph on January 27, while Marysville, California, recorded 65 mph. Farther inland, Reno, Nevada, received 10.5 inches of snow, spread across 7 days (January 23-29). Flagstaff, Arizona, reported 43.5 inches of snow from January 19-29, boosting its season-to-date total from 7.1 to 50.6 inches (from 17 to 97 percent of normal). Drought improvements were focused on California, but drought coverage was also reduced—in part based on further analysis of other January storms—in the Pacific Northwest and the Southwest. Meanwhile, dry weather deepened its grip across parts of the interior Northwest, where there were some increases in coverage of dryness (D0) and moderate to extreme drought (D1 to D3).
Alaska, Hawaii, and Puerto Rico
Colder air settled across much of Alaska in late January. In addition, generally dry weather covered the Alaskan mainland, capping a dry month. In fact, Fairbanks completed its least snowy January on record (0.5 inch, or 5% of normal). Fairbanks’ previous January record-low snowfall of 0.7 inch was set in 1966. Due to ongoing dry weather and below-average snowpack across east-central Alaska, the two areas of abnormal dryness (D0) were connected. In contrast, January precipitation in southern Alaska totaled 6.36 inches (201% of normal) in Cold Bay; 13.73 inches (166%) in Kodiak; and 16.87 inches (110%) in Ketchikan. Farther south, Hawaii’s latest round of stormy weather ended early in the drought-monitoring period. On the Big Island, Hilo’s January total climbed to 17.47 inches (189% of normal), with more than half (8.95 inches) falling from January 24-26. Drought coverage was further reduced on southern Oahu and the Big Island. Elsewhere, heavy showers occurred in northeastern Puerto Rico, resulting in some trimming of abnormal dryness (D0), compared to the previous week.
Pacific Islands
The weather across the U.S.-Affiliated Pacific Islands (USAPI) during this USDM week (01/27/21-02/02/21) was dominated by dry season northeast trade winds across much of Micronesia with the South Pacific Convergence Zone (SPCZ) bringing rain to American Samoa. A near-equatorial surface trough persisted throughout the week south of Palau and southwestern Yap State, while convergence or disturbances associated with the Inter-Tropical Convergence Zone (ITCZ) triggered showers over southern portions of the Marshall Islands (RMI) and Pohnpei and Kosrae States in the Federated States of Micronesia (FSM), but the seasonal trade winds pushed much of the activity south toward the equator. Weak surface troughs developed from time to time in Micronesia, and cold front shear line remnants passed over the Marianas. The weather over American Samoa reflected the battle between a dry ridge to the east and the wet SPCZ to the south, with the SPCZ edging at times over the islands.
Satellite-based estimates of 7-day precipitation (QPE) showed a large continuous band of 4+ inches of rain (the SPCZ) extending from Indonesia southeastward to south of the Samoan Islands, with an arc of 1+ inches extending from the SPCZ across the Samoan Islands. North of the equator, patches of rain were seen across Micronesia. A band of 2+ inches of rain touched southern Palau and southwestern Yap State, another narrow band of 1+ inches stretched across southeastern Yap State, a third band of half-inch-plus was over southern Pohnpei & Kosrae States, and a fourth area of 0.2-1.0 inch precipitation was over southern RMI. These four bands were oriented northwest to southeast. Little to no precipitation was indicated on the QPE over Micronesia outside of these bands.
Even though this was a relatively dry week for Koror, with only 1.08 inches of rain, the January 2021 rainfall total was over 10 inches. This surpassed the monthly threshold of 8 inches to meet most water needs. For this, drought free conditions were unchanged this week for Koror, Palau.
The Marianas had a dry week, receiving less than half an inch of rain. Guam was the only location to receive over 4 inches of rain during the month of January, while Saipan and Rota had 2.30 inches and 2.11 inches, respectively. Due to the recent dry conditions, Rota's drought classification was changed to abnormally dry this week. Saipan remained in abnormally dry conditions, while Guam remained in drought free conditions.
Much of FSM had less than 1 inch of rain this week, which is less than the weekly threshold of 2 inches to meet most water needs. Yap, Chuuk, Pohnpei, Kosrae, Lukunoch, Nukuoro, and Pingelap continued to be in drought free conditions since their monthly rainfall totals exceeded the monthly threshold of 8 inches. Kapingamarangi remained in extreme drought since this week's rainfall total was only 0.89 inch and the monthly rainfall total was less than 6 inches of rain. According to local reports, all six reserved tanks were full. However, vegetation is still in recovery mode. Breadfruits are the main concern for the locals since they have been falling from the trees immaturely. Ulithi and Woleai also had less than half an inch of rain this week. Ulithi's monthly rainfall total was close to 8 inches, so drought free conditions persisted. Woleai's January 2021 rainfall total was only 4.61 inches, however, local reports stated that catchment tanks were at good levels. Woleai's drought classification also remained drought free. This week marked Fananu's third consecutive week with little to no rain. The January 2021 rainfall total was 5.72 inches, which is below the monthly threshold of 8 inches. However, drought free conditions were unchanged this week.
Mili and Majuro were the only two locations across the Marshall Islands to receive over 2 inches of rain this week and remained drought free. Ailinglaplap had 1.24 inches of rain this week and a January 2021 rainfall total of 8.43 inches. For this reason, Ailinglaplap also continued to be drought free. Kwajalein and Wotje remained in moderate drought since dry conditions continued to persist with rainfall totals less than 1 inch. Jaluit had only 0.65 inch of rain this week and the monthly rainfall total was less than 6 inches. However, drought free conditions were unchanged since December 2020 had over 15 inches of rain. Utirik was set to missing due to 4 or more days of missing data.
This was a very wet week for American Samoa, with all three locations receiving over 3 inches of rain. Drought free conditions continued.
Virgin Islands
The weekly rainfall total at the airport in St. Thomas was only 0.16 inch and only 0.75 inch (31.5% of normal) for the month of January. Similarly, CoCoRaHS reported 0.15-0.42 inch of rain for the week at the different locations and 0.66-1.43 inches for the month. SPI values for 1, 9, and 12 months at the airport indicate abnormally dry conditions to severe drought. While the 3 and 6 months indicate drought free conditions. Moderate drought remained this week for St. Thomas.
Similarly, St. John's weekly rainfall totals ranged between 0.39-0.54 inch this week at the different CoCoRaHS locations. The January 2021 rainfall totals were 0.95-1.25 inches. SPI values at 1, 3, and 12 months are indicative of abnormally dry conditions to moderate drought. SPI values at 6 and 9 months were indicative of drought free conditions. For this week, moderate drought continued across St. John.
St. Croix's rainfall total at the Henry E. Rohlsen was 0.24 inch and between 0.35-0.39 inch at the different CoCoRaHs stations. The January 2021 rainfall total at the airport was only 1.86 inches (or 86.9% of normal) of rain and 1.76-2.53 inches at the different CoCoRaHs stations. The SPI values for the 3, 6, 9, and 12 months were indicative of abnormally dry conditions, while the SPI for 1 month was indicative of drought free conditions. St. Croix's drought classification of abnormally dry conditions was unchanged this week.
Looking Ahead
On February 4-5, a storm system crossing the nation’s mid-section will result in wind-driven snow from the upper Midwest into the Great Lakes region. Parts of the Midwest and Northeast could experience freezing rain, while late-week rain showers will occur in the Southeast, including much of Florida. The Midwest’s coldest air of the season will trail the storm, with temperatures during the weekend and early next week possibly falling to 0°F or below as far south as the Ohio and middle Mississippi Valleys. In parts of Minnesota and North Dakota, temperatures may remain below 0°F for at least 3 consecutive days, from February 6-8. Significant precipitation will be limited after cold air engulfs much of the country, aside from weekend rainfall in the Southeast and some wintry precipitation farther north across the eastern U.S.
The NWS 6- to 10-day outlook for February 9 – 13 calls for the likelihood of colder-than-normal weather nearly nationwide, except for above-normal temperatures across the southern tip of Florida and parts of the Southwest. Meanwhile, drier-than-normal weather west of the Rockies and in the Midwest and Northeast should contrast with near- or above-normal precipitation across the High Plains and Deep South.
Author(s):
Brad Rippey, U.S. Department of Agriculture
Ahira Sanchez-Lugo, NOAA/NCEI
Dryness Categories
D0 Abnormally Dry—used for areas showing dryness but not yet in drought, or for areas recovering from drought.
Drought Intensity Categories
D1 Moderate Drought
D2 Severe Drought
D3 Extreme Drought
D4 Exceptional Drought
Drought or Dryness Types
S Short-Term, typically less than 6 months (e.g. agricultural, grasslands)
L Long-Term, typically greater than 6 months (e.g. hydrologic, ecologic)
Source: National Drought Mitigation Center

