


California and National Drought Summary for February 23, 2021
Summary
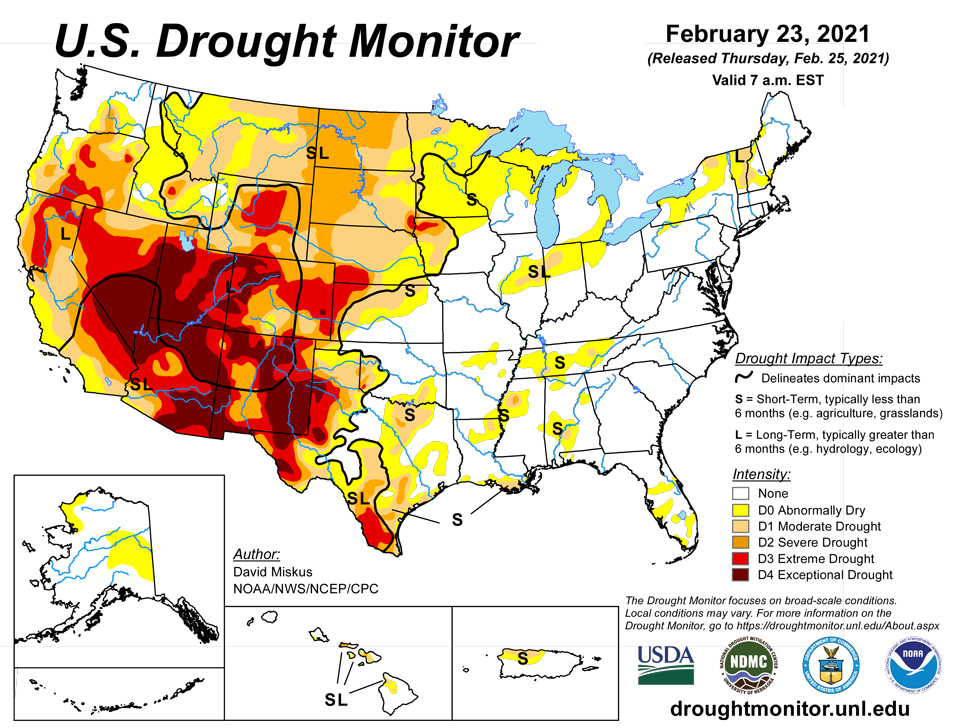
February 25, 2021 - After a frigid start to the period, especially throughout the middle third of the Nation where daily temperature anomalies were 30 to 40 degrees F below normal and readings dropped below -40 degrees F in Minnesota and 0 degrees F as far south as central Texas, temperatures finally moderated by week's end. By Monday, highs had risen into the 40s & 50s degrees F in the Dakotas and 70s and 80s degrees F in Texas. Frequent Pacific storms battered the Northwest, and then tracked southeastward across the Northern and Central Rockies, dropping plentiful moisture on Washington, Oregon, northern California, Idaho, & western Montana, but missing most of the Southwest yet again. Storms also dropped widespread precipitation on much of the Southeast, mid-Atlantic, and coastal New England while most of the Midwest saw light frozen (snow, sleet, freezing rain) precipitation. Dry weather was observed across much of the Plains except in south-central Texas. Weekly temperatures averaged below to much-below normal throughout the lower 48 States except for central and southern Florida. Readings in Alaska remained below-normal except in the southwest and Aleutians, and significant precipitation was limited to along the southwest, southern, and southeastern coasts. Meanwhile, Hawaii experienced increased shower activity, especially on Kauai where some flash flooding occurred. In Puerto Rico, light showers persisted across eastern sections while the northwest remained mostly dry, and dryness/drought increased.
The ensuing 5 days (March 2-6) expects favorable odds for above normal precipitation across much of Alaska and in the Tennessee Valley and Carolinas. Subnormal precipitation should prevail across the North-Central States (northern halves of the Rockies and Plains and Great Lakes region) and along the western Gulf Coast, with Equal Chances (EC) elsewhere in the lower 48 States. Subnormal temperatures are likely in Alaska and the Far West, with above normal readings anticipated for the eastern two-thirds of the Nation (except EC for New England).
Northeast
Light to moderate (0.5-2 inches) precipitation fell across much of the region, with the greatest totals found in the mid-Atlantic and along coastal New England. A decent snow cover blanketed much of New England, and temperatures averaged below normal. The D0-D1 areas in northern New England (with 90-day deficits of 2-4 inches and 12-month shortages of 5-10 inches) generally measured less than 0.5 inches, but with cold, snowy, and dormant conditions with no obvious impacts, no changes (improvement or deterioration) were made this week.
Southeast
Storm systems tracked from the Gulf of Mexico northeastward, dropping widespread light to moderate precipitation (0.5-2 inches) on much of the region. Heavier bands of rain (2-4 inches) fell on parts of Louisiana, Mississippi, and northern Alabama, with a second area from the Florida Panhandle northeastward into eastern North Carolina. Scattered showers also dampened sections of southern and eastern Florida. Overall, the rains reduced some of the D0 and D1 areas, but not all areas measured enough rain to significantly eliminate short-term deficiencies during the past 30-90 days. However, the rains prevented any further deterioration or new drought development, except in western Florida which missed the rains. Most USGS 7-day average stream flows were at or above normal, with record to near-record high levels from northern Florida northeastward into southeastern Virginia and the Delmarva Peninsula.
South
Little or no precipitation fell on the Southern Plains except across south-central Texas, improving conditions there, while light to moderate amounts (0.5-2 inches) were measured in the lower Mississippi Valley (Louisiana, Arkansas, Mississippi, Tennessee). Where enough precipitation fell to make a significant dent in the short-term deficiencies, a 1-cat improvement occurred (e.g. northern and eastern Mississippi, southern Tennessee). However, the greatest rains seemed to fall on non-drought areas. In contrast, little or no precipitation fell on south Texas and northeastern Texas into southeastern Oklahoma, expanding drought severity and area there. USGS 7-day average stream flows have dropped into the below to much-below normal levels
Midwest
Much less precipitation (0.1-0.25 inches) fell across most of the Midwest as compared to the previous week, although a few areas received more than 0.5 inches liquid equivalence. With weekly temperatures well below normal (temperature anomalies -10 to -20 degrees F), sub-zero readings of -10 to -30 degrees F, a light snow cover from Minnesota and Iowa eastward to Ohio, and dormant agricultural conditions, status-quo was the best choice. However, parts of eastern Nebraska & western Iowa saw wet snow (2-10 inches) over the weekend, and with several recent snowstorms in this area, some slight improvements were made in western Iowa as short-term indices were wet out to 4-months, near-normal at 6-months, but still droughty (D2-D4) at 9- and 12-months. Hopefully most of the moisture from the snow will infiltrate into the soils, but as mentioned last week, this is not guaranteed.
High Plains
After several weeks of light to moderate snow events in the Central Plains, drier (but still frigid conditions, although moderating by week's end) weather returned to the region. With the recent improvements in the Central Plains and subnormal temperatures, no changes were made there. Farther north, however, even though precipitation is normally low during the fall and winter seasons, it has been extremely dry during the past 3-4 months (less than 25% of normal), leading to a lack of any snow cover in eastern Montana, western North Dakota, and north-central South Dakota. Short-term indices (1-, 2-, 3-, 4-, and 6-months) were at D3 and D4 levels, thus D2 was expanded southward across south-central North Dakota and central South Dakota, and D1 added in north-central South Dakota. In contrast, additional precipitation in Wyoming and Colorado boosted mountain snow water equivalent (SWE) as of Feb. 23 at or closer to normal, thus some improvements were made across southern and southeastern Wyoming and in parts of north-central and south-central Colorado. A few areas in Wyoming had missed out on the recent snows, so some slight degrading was made to those areas.
West
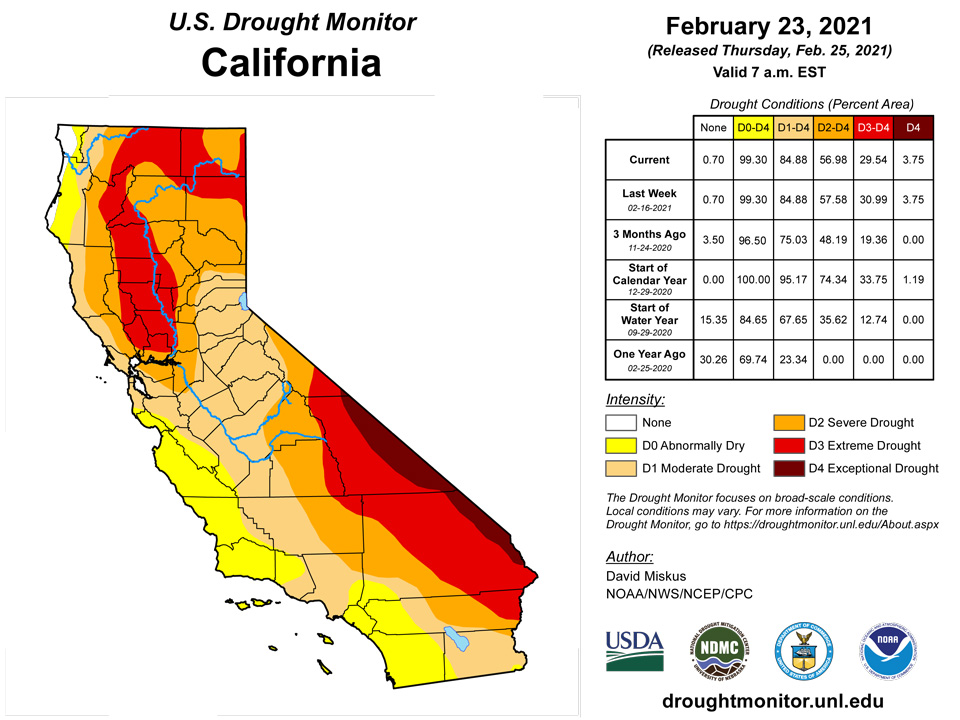
Ample Pacific moisture and storms dropped decent amounts of precipitation on the Northwest, especially Washington, Oregon, northern California, Idaho, western Montana, and western Wyoming, with lesser amounts across northern Nevada, central Utah, northern and southern Colorado, and parts of New Mexico. The active Pacific storm track continued to benefit Washington, Oregon, and northern California, along with most northern and central mountains in the West. February 23 basin average SWEs continued to increase toward normal, with most basins in Washington, Oregon, Idaho, western Montana, and northwestern Wyoming at or above normal SWE. Accordingly, some slight improvements were made where recent surplus precipitation fell and the basins had SWEs exceeding 100%. With improvements made last week in northern Nevada and central Utah, and these areas still impacted from the failed Southwest summer monsoon, no changes were made this week, although the basin SWEs were up to 70-80% of normal as of Feb. 23. The light precipitation in New Mexico and eastern Arizona was not enough for any improvements this week. In California’s Sierra Nevada, the Feb. 23 SWE stood at: North - 67%; Central - 72%; South - 50%; statewide summary - 65%. In contrast, central Nevada missed out on the recent storms, and with the failed summer monsoon, conditions have gotten worse, thus D4 was expanded to include central Nevada. In addition, the Impact Lines were adjusted to show that more of the drought in the West was long-term (L) since recent storminess had pushed the short-term indices into various wet categories, although the much drier in the short-term Southwest remained in SL.
Alaska, Hawaii, and Puerto Rico
A cold front produced heavy rains and flash flooding on Kauai, but it mainly occurred over D-nada areas, although some of the rain impacted the leeward side. With rainfall now near to above average, D0 was removed on the leeward side of Kauai. Similarly in Oahu, the heavy rains fell on D-nada (windward) areas, so no changes to the leeward D0. Some rain fell on Molokai, but it was too early to see if the moisture impacted vegetation. In contrast, VHI depicted improved conditions on Lanai and Kahoolawe, thus a 1-cat improvement was made. On Maui, heavy rains also fell on D-nada areas, but vegetation has improved from previous rain events, thus some slight improvements were made. However, no changes were suggested on West Maui as NRCS reported that conditions were still very dry. On the Big Island, FSA reported improved pasture conditions along the lower slopes of the South Kohala District, so D2 became D1. In the Humuula saddle between Mauna Kea and Mauna Loa, D0 was expanded south based upon low rainfall, and D1 was added near Pohakuloa from field reports.
In Alaska, subnormal temperatures and mostly dry conditions continued across the state, except in the southwest where readings were above normal. Precipitation was limited along the southwestern, southern, and southeastern coasts. With much of the state in winter hibernation, status-quo was the best option.
In Puerto Rico, light showers (less than 1 inch) fell on eastern and west-central sections of the island, with the D0-D1 areas in the northwest receiving little or no rain. This rainfall pattern continued the westward push of D0 and D1 toward the far northwest (and slight improvements along the east edge) as portions to the east have been receiving rain, albeit light totals. The constant light rains, however, have produced green vegetation on eastern sections of the island during their normal dry season, according to field observations.
Pacific Islands
The weather conditions across the U.S.-Affiliated Pacific Islands (USAPI) during this USDM week (02/17/21-02/23/21) were dominated by a seasonally dry trade-wind flow over northern and eastern Micronesia with near-equatorial troughs in the south and southwest. A near-equatorial trough persisted across Palau and western to southern portions of Yap State for most of the week. A tropical circulation moved across Palau and western Yap State early in the week before intensifying into Tropical Storm Dujuan well west of Koror. Differential wind speeds generated transient areas of trade-wind convergence over parts of eastern and southern Micronesia, with the southern disturbances bringing beneficial rains to drought-stricken Kapingamarangi. Occasional weak troughs, trade-wind convergence, and cold front/shear lines traversed the Marianas, but the dominant feature was the dry trade-wind regime. The dry trades spread across much of the Marshall Islands (RMI) and eastern and northern portions of the Federated States of Micronesia (FSM). South of the equator, the South Pacific Convergence Zone (SPCZ) moved over the Samoan Islands, drenching American Samoa with several inches of rain.
Satellite-based estimates of 7-day precipitation (QPE) showed a continuous band of precipitation stretching from near the Philippines southeastward to the Samoan Islands and beyond. The pattern over Micronesia reflected rains from Dujuan and the near-equatorial trough, with bands of 4+ inches of rain over Palau and near Yap. The rain band extended southeastward to southern Pohnpei State, with patchy areas of 1+ inches and locally over 2 inches. An arc of half-inch rain touched the northern Marianas with fingers reaching toward Saipan, and spotty half-inch areas dotted Kosrae State and the southern RMI. But otherwise, little to no precipitation was indicated from the Marianas to the RMI. The QPE captured the SPCZ well, with a huge band of 4+ inches and locally 10+ inches extending across the Samoan region.
In the Marianas, Guam and Rota were dry this week (0.22 inch and 0.17 inch, respectively) and for the month (0.99 inch and 0.93 inch, respectively). February 2021 (through the 23rd) ranked as the second driest February (compared to all full Februaries) for Rota, and January-February (with 3.03 inches of rain) ranked as the driest January-February. February 2021 (through the 23rd) ranked as the third driest February for Guam, and January-February (5.10 inches) ranked as the 8th driest January-February. The USDM status at Rota was worsened to D1-S while Guam stayed at D0-S. Saipan had 0.73 inch of rain at the IAP, 0.48 inch at the ASOS station, and 0.21 inch at the NPS station. The IAP had 2.83 inches of rain for February, which ranks 25th driest (17th wettest), so Saipan stays at D0-S.
In the FSM, Fananu reported no measurable rain this week (with one day missing) and 1.49 inches for the month so far. February 2021 (through the 22nd) ranked as the driest February (compared to full Februaries), and January-February 2021 was the second driest January-February, but the data base has only 7 years of data. The National Weather Service has received reports of water shortages across the northern islands of Chuuk State, with residents of Fananu conserving drinking water due to low water catchment levels. Based on low rainfall totals and these impacts, the status at Fananu was worsened to D1-S.
With 1.39 inches of rain this week, the monthly total of 2.66 inches at Kapingamarangi ranks as the 5th driest February, or 15th percentile. January-February (8.58 inches), December-February (12.35 inches), and November-February (15.18 inches) rank 5th, 4th, and 3rd driest, respectively, equating to the 17th, 15th, and 12th percentiles, respectively. These percentiles fall in the D1-D2 range. At longer timescales, March-February through August-February (last 7 through last 12 months) rank as the driest on record, so these and the impacts on agriculture keep the status at D3-SL.
Pohnpei (with 1.25 inches), Kosrae (0.20), and Pingelap (1.42) were dry this week. These stations remain D-Nothing since all three were wet last week and Kosrae and Pingelap are wet for this point in the month. The rest of the FSM stations were wet this week and some wet for the month, so D-Nothing continues.
Precipitation this week at the RMI stations ranged from no measurable rain at Ailinglaplap and Wotje to 0.99 inch at Mili. Ailinglaplap was wet last week and Mili was almost wet (1.99”) last week, so no change this week, both stay at D-Nothing. Kwajalein’s precipitation and percentile ranks are 1.66 inches (36th percentile) for February (compared to all full Februaries), 4.00 inches (22nd) for January-February, 8.02 inches (12th) for December-February, and 20.97 inches (16th) for November-February, so no change (D2 continues).
Majuro has recorded 0.11 inch of rain so far this week (with one day missing) and has 3.73 inches for the month so far (which is below the monthly threshold for this point in the month), but was wet last week. The Majuro reservoir has been below the 80% threshold (28.8 million gallons) for concern all month, has been continuing to fall this week, and is at its lowest value in the month (24.94 million gallons) as of February 23. D-Nothing continued for now, but Majuro will be watched for possible D0-S in the weeks ahead if rainfall is sparse and the reservoir level continues to fall.
Jaluit has been at D0-S status for the last 2 weeks. The last 2 months have been dry at Jaluit, with 2.21 inches of rain so far in February and 5.68 inches in January. February ranks 6th driest out of 38 years, or at the 16th percentile, and January-February ranks 4th driest at the 11th percentile. Both of these percentiles are in the D1 range, but Jaluit went to D0-S status just a couple weeks ago. Jaluit will be watched for possible D1-S in the weeks ahead if the dryness continues.
Wotje has reported no measurable rainfall for the entire month, only 1.82 inches for January, and 3.82 inches for December. February 2021 tied with two other years for the driest February, resulting in a rank of 3rd driest and a percentile of 8th. The ranks were 5th driest for January-February (13th percentile) and 9th driest for December-February (26th percentile). These percentiles support just D2-S, so there was no change in status this week, but Wotje will be watched for possible D3-S in the weeks ahead if the dryness continues.
Utirik was not analyzed due to lack of data.
More than 2 inches of rain (the weekly minimum needed to meet most water needs) fell this week at the Palau IAP (3.66 inches), Koror COOP/ROR (2.69), Pago Pago (6.62), and the automated stations at Siufaga Ridge (7.12) and Toa Ridge (5.96), and all of these stations were wet for the month, so D-Nothing continues in Palau and Tutuila.
Virgin Islands
The weather conditions across the U.S. Virgin Islands (USVI) during this USDM week (02/17/21-02/23/21) were dominated by a surface ridge and mid-level ridge which promoted generally fair and stable weather. Patches of moisture moved through the region, generating trade-wind showers, but drier and more stable air aloft suppressed the development of deep convection and limited precipitation amounts.
Radar-based estimates of rainfall (QPE) for the 7 days ending at 12z on Tuesday showed less than a fourth of an inch of precipitation across St. Thomas and St. John, and a fourth of an inch or less over western St. Croix to no precipitation over eastern St. Croix. The QPE for February through the 23rd reflected a strong rainfall gradient, with 2 or more inches for the month over St. Thomas, half an inch or more over St. John, half an inch or less over western St. Croix, and no precipitation depicted over eastern St. Croix.
Weekly rainfall totals on St. Thomas ranged from 0.10 inch at King AP to 0.20 inch at the CoCoRaHS station at Charlotte Amalie 1.4 NE and 0.26 inch at the CoCoRaHS station at Charlotte Amalie 5.1 E. Monthly totals for February so far (through the 23rd) ranged from 0.75 inch at King AP, 1.13 inches at the CoCoRaHS station at Anna's Retreat 2.5 ESE, and 1.23 inches at Charlotte Amalie 5.1 E, to 2.74 inches at the CoCoRaHS station at Charlotte Amalie 1.4 NE. Standardized Precipitation Index (SPI) values at King AP were dry in the short-term, at D0 or D1 levels for the last 1 and 3 months. The USGS Grade School 3 well steadily declined in the last week and has been in general decline during the last 2 months. Due to the generally low rainfall totals and spotty nature of the showers, D1-S continues at St. Thomas.
Weekly rainfall totals on St. Croix included 0.21 inch at East Hill, 0.23 inch at the CoCoRaHS station at Frederiksted 2.3 N, 0.27 inch at the CoCoRaHS station at Frederiksted 0.5 N, 0.31 inch at Rohlsen AP, 0.37 inch at the CoCoRaHS station at Frederiksted 2.3 SSE, 0.40 inch at the CoCoRaHS station at Christiansted 1.6 E, and 0.42 inch at the CoCoRaHS station at Christiansted 1.8 ESE. Monthly totals for February so far ranged from 0.62 inch at Rohlsen AP to 1.12 inches at Christiansted 1.6 E. The monthly total at Rohlsen AP is 47% of normal, and the monthly total of 0.70 inch at East Hill is 60% of normal. The SPI values at Rohlsen AP and East Hill were at D0 or D1 levels for the last 3 months, and D0 level for the last 6 to 12 months at Rohlsen AP. The USGS Adventure 28 well steadily declined from January 1 to February 12, then rose, but has been dropping in the last week. D1-S continues at St. Croix.
On St. John, weekly rainfall totals included 0.29 inch at the CoCoRaHS station at Cruz Bay 1.6 E, 0.35 inch at Windswept Beach, and 0.42 inch at Cruz Bay 0.8 NE. Monthly totals so far include 1.59 inches, 1.25 inches, and 1.72 inches, respectively. The SPI at Windswept Beach was at D1 levels at the 3- and 12-month time scales. The USGS Susannaberg DPW 3 well has been steadily declining since January 1. D1-S continues on St. John.
Looking Ahead
During the next 5 days (February 25-March 1), storms will impact the Pacific Northwest, especially Washington, Oregon, and Idaho, and then track southeastward, gathering Gulf moisture before tracking northeastward. A swath of 1-4 inches of rain should fall from northeastern Texas northeastward into the mid-Atlantic, with lighter totals in the New England and the Great Lakes region. Unfortunately, little or no precipitation is forecasted for the Southwest, California, the northern and central Plains, upper Midwest, and Florida. Temperatures will average below normal in the West, Rockies, and northern Plains, and above normal in the eastern half of the Nation.
Author(s):
David Miskus, NOAA/NWS/NCEP/CPC
Richard Heim, NOAA/NCEI
Dryness Categories
D0 Abnormally Dry—used for areas showing dryness but not yet in drought, or for areas recovering from drought.
Drought Intensity Categories
D1 Moderate Drought
D2 Severe Drought
D3 Extreme Drought
D4 Exceptional Drought
Drought or Dryness Types
S Short-term, typically less than 6 months (agriculture, grasslands)
L Long-term, typically more than 6 months (hydrology, ecology)
SL Area contains both short- and long-term impacts
Source: National Drought Mitigation Center

