


California and National Drought Summary for March 2, 2021
Summary
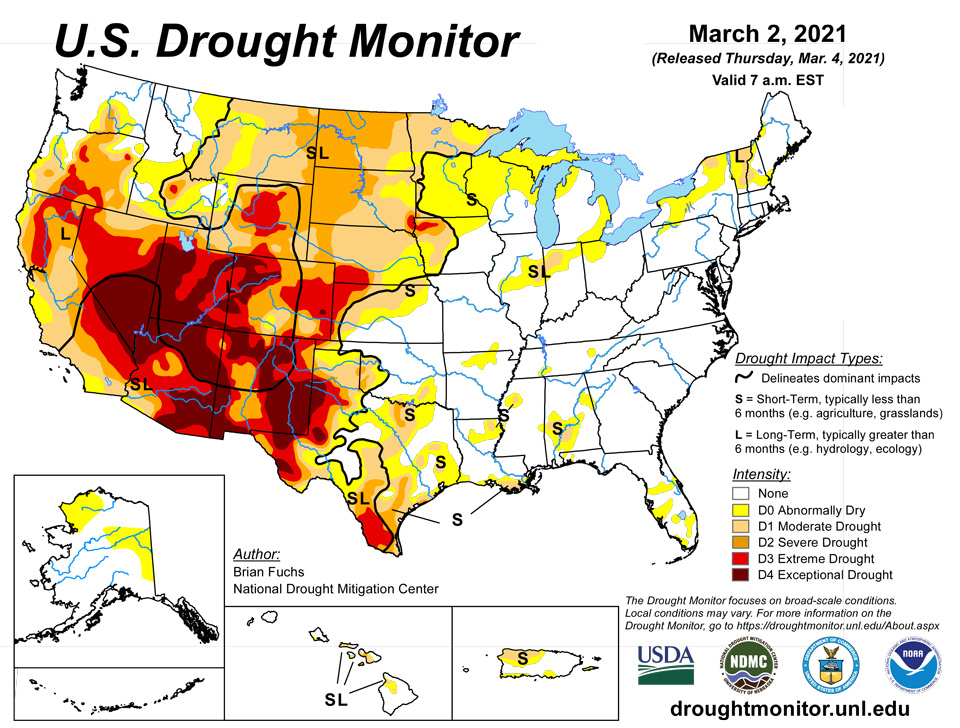
March 4, 2021 - The current U.S. Drought Monitor period was highlighted by a large swath of heavy rain that started in northeast Texas and progressed northeast into the Mid-Atlantic. In this area, widespread reports of 200-400% of normal precipitation took place, with some areas of Kentucky having widespread 6-8 inch amounts. Dry conditions dominated much of the West and especially the Southwest and into the Plains. Some active weather in the Pacific Northwest and northern Rocky Mountains brought with it rain and snow, helping to boost seasonal snow totals. Temperatures during the week were cooler than normal over the West with departures of 6-9 degrees below normal widespread, while temperatures were above normal from the Plains eastward with departures of 9-12 degrees above normal over much of Alabama.
Northeast
Temperatures in the region were 2-4 degrees above normal for the week, with portions of West Virginia 6-8 degrees above normal. Above-normal precipitation was recorded through much of the southern extent of the region, where 200% of normal precipitation was widespread. It was drier through much of New England and western New York, with near-normal precipitation through much of Maine. No changes to the drought status were made this week but several areas are being monitored for possible expansion or introduction of abnormally dry and drought conditions.
Southeast
Drier than normal conditions dominated much of the region, with only a few areas of southern Alabama, southern Georgia and northern Florida recording near normal or slightly above normal precipitation for the week. Temperatures were warmer than normal over the entire region, with the greatest departures (9-12 degrees above normal) in Alabama, southeast Georgia, and eastern South Carolina. Over the last 90 days, the region has continued to dry out. In southern Alabama, abnormally dry and moderate drought conditions were expanded this week and abnormally dry conditions were expanded in northern Alabama and into Georgia. Where significant rains fell over northern Alabama, areas of abnormally dry conditions were removed this week. As the region remains
Midwest
Temperatures were mainly above normal through the region with the greatest departures over northern Wisconsin and the Ohio River Valley, where temperatures were 6-8 degrees above normal. With the above-normal temperatures and widespread rain from southern Illinois to southern Ohio, much of the remaining snowpack was diminished and the area quickly transitioned into spring-like conditions. It was dry over much of northern Missouri, Iowa, northern Minnesota and southern Wisconsin and from northern Illinois into Michigan. Some of these same areas are still holding on to drought and dryness from last fall and will continue to be monitored as we go into spring. Moderate drought was expanded over northern Minnesota this week. Areas of abnormally dry and moderate drought conditions were improved from central Illinois east into Indiana and Ohio.
High Plains
Dry conditions dominated the region, with only portions of central South Dakota, central and eastern North Dakota, portions of the High Plains in eastern Colorado and central Wyoming recording above-normal precipitation. Temperatures were above normal over most of the area, with below-normal temperatures farther west into Wyoming and Colorado. The greatest departures were in eastern South Dakota where temperatures were 6-9 degrees above normal and northwest Wyoming where temperatures were 12-15 degrees below normal for the week. Improvements were made in north central Wyoming, where areas of extreme and severe drought were showing a good snow season to allow for a reduction in drought intensity. Severe drought was expanded in far northeast North Dakota and into far northwest Minnesota.
South
There was a contrast in temperatures over the region; west Texas and Oklahoma were below normal while areas of southern Mississippi were greater than 10 degrees above normal for the week. Heavy rains fell from northeast Texas through much of southern Arkansas, northern Mississippi, and all of Tennessee this week, with areas from southern Arkansas to western Tennessee recording 400% of normal precipitation. Dry conditions dominate most of Oklahoma and the central, southern, and western portions of Texas. Improvements were made to the moderate drought over northeast Texas and southeast Oklahoma this week. A reassessment was done over southwest Oklahoma, removing the lingering extreme drought there. Exceptional drought was removed over far west Texas as the El Paso area had recorded enough precipitation recently to allow for improvement in intensity. Much of Texas saw degradations with dryness, especially over the last 4 months, dominating the indicators. Coupled with the dryness, the recent cold snap also has impacted winter wheat, with the regional agronomist stating that the drought has probably caused more loss to winter wheat across the region than the recent weather events. Early estimated losses from the recent winter storm are at least $600 million, with $230 million in damages to citrus, $228 million to livestock, and $150 million to vegetable crops in Texas. An area of extreme drought was added in the far western panhandle of Oklahoma, bridging a gap where extreme drought was being depicted in both New Mexico and Colorado.
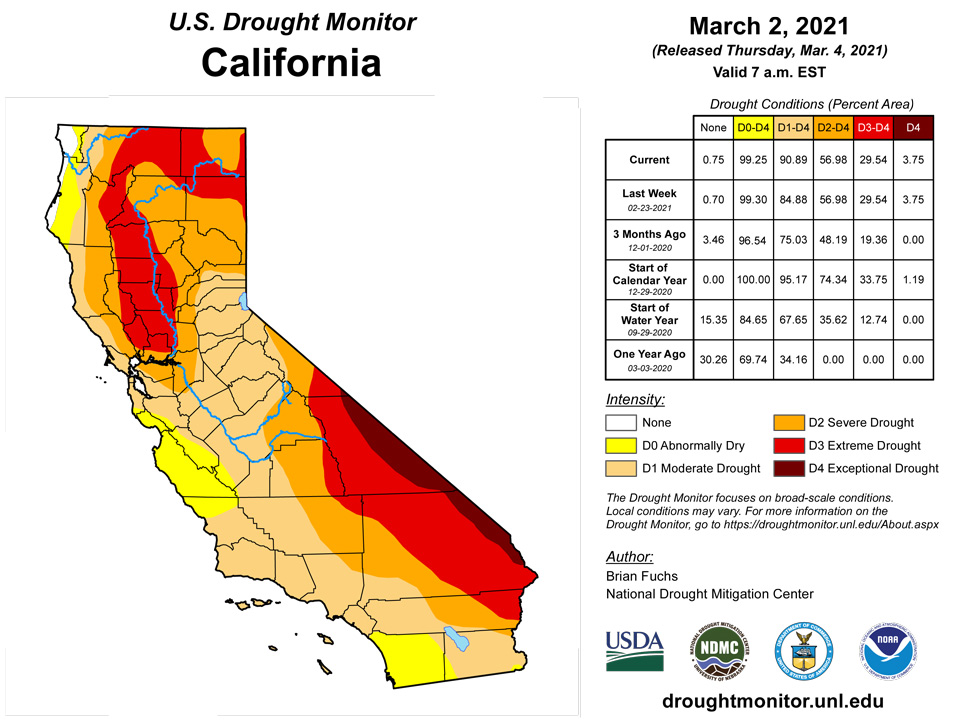
West
Dry conditions dominated areas from California to New Mexico with just a few pockets of above-normal precipitation over central Colorado, central Wyoming, the Pacific Northwest, and northern Montana. Temperatures were cooler than normal over much of the region with much of the Great Basin and into Wyoming recording temperatures 9-12 degrees below normal. After a good month of precipitation along with the most recent precipitation in the area, many areas of Oregon saw improvements to the drought status, with long-term issues still being monitored. Much of California is enduring its second consecutive dry winter, with most areas below 75% of normal snowpack for this time of year. Many water agencies were discussing water conservation measures, with the North Marin Water District considering both voluntary and mandatory water conservation orders. Moderate drought was expanded over areas of southern California where drought is beginning to develop again after a fairly dry winter. Improvements to abnormally dry, moderate and severe drought conditions were made in Idaho while abnormally dry conditions were improved over western Montana. Eastern Montana conditions continued to deteriorate with an expansion of moderate and severe drought this week. A recent winter storm in and around the Denver metro area and areas to the west allowed for improvements to the extreme drought conditions there as snow totals for the current water year were up over 100%.
Alaska, Hawaii, and Puerto Rico
Recent rains on Molokai allowed for the removal of extreme and improvement to severe drought conditions in Hawaii. Puerto Rico continues to dry out over the short term, with abnormally dry and moderate drought conditions expanded this week and new areas of abnormally dry conditions introduced over the southern and eastern portions of the island as well as the islands of Vieques and Culebra off the eastern coast. In Alaska, areas of abnormally dry conditions were improved south of Fairbanks due to the good SNOTEL reports while abnormally dry conditions were expanded in the northern portions of the state as well as areas northeast of Fairbanks.
Pacific Islands
Dry season trade winds dominated the weather conditions across Micronesia during this USDM week (02/24/21-03/02/21). A near-equatorial surface trough persisted throughout the week south of Palau and over southern portions of Yap State, while small and weak surface troughs, trade-wind disturbances, and convergent trade-wind flow brought showers at times across parts of the Federated States of Micronesia (FSM) and Marshall Islands (RMI), and a shear line and weak trough teased the Marianas. South of the equator, the week began with the South Pacific Convergence Zone (SPCZ) bringing showers to the Samoan Islands, but a high pressure ridge quickly pushed the SPCZ south and west of the area and brought more stable conditions.
Satellite-based estimates of 7-day precipitation (QPE) showed a continuous band of precipitation (the SPCZ) extending southeast from Indonesia toward and past the Samoan Islands. The QPE indicated 0.5 to 2.0 inches of rain across American Samoa, with 4+ inches in a large band south of the Samoan Islands. There were patches of rain over Micronesia, but the Inter-Tropical Convergence Zone (ITCZ) was mostly absent. A 1-inch band of precipitation extended from Palau southeastward across Yap State, with embedded areas of 2+ inches, associated with the near-equatorial surface trough which persisted in the area throughout the week. Patches of up to half an inch were indicated across southern parts of Chuuk and Pohnpei States, and over parts of the RMI. Otherwise, little to no rainfall was detected by the QPE across the rest of Micronesia.
This was a dry week in the Marianas. With 0.04 inch of rain this week at Guam, 1.01 inches for February, and 5.12 inches for January-February, the USDM status at Guam was worsened from D0-S to D1-S. February 2021 ranked as the third driest February with a percentile of 0.05 and January-February was 8th driest (percentile 0.13). The percentiles equate to D3 for February and D1 for January-February. Reports have been received of grasses browning and regular swordgrass (sakati) fires developing across southern Guam.
Rota reported 0.16 inch this week, 0.97 inch for February, and 3.07 inches for January-February. These rank as the second driest February and driest January-February, with percentiles of 0.08 and 0.04, respectively. These are in the D3-D2 ranges; since this is the dry season, D1-S continues at Rota.
Saipan has been a little wetter, with 0.32 inch at the IAP for the week, 3.15 inches for February, and 5.45 inches for January-February. Saipan ASOS recorded 0.16 inch for the week, 2.38 inches for February, and 3.92 inches for January-February. The values at Saipan NPS station were 0.12, 1.63, and 2.73, respectively. With the last 2 months dry (each below the 4-inch monthly minimum), D0-S continues at Saipan.
Weekly rainfall totals in the FSM ranged from 0.03 inch at Woleai, 0.08 inch at Fananu, and 0.14 inch at Yap (Yap had 4 days missing this week), to 1.37 inches at Lukonor, 1.39 inches at Kapingamarangi, 1.43 inches at Ulithi, and 2.24 inches at Pohnpei. D1-S continues at Fananu where February had 1.57 inches and ranked as the driest February in the 7-year record (percentile 0.14 or in the D1 range). The National Weather Service has received reports of very low water tank levels on Fananu and all of the Hall Islands. Some crops are beginning to yellow. Nomwin island (14 miles SW of Fananu) reported one drinking water tank left. Murilo (east of Fananu) reported dry taro patches. Similar conditions are possible for the Namanuitos to the west of Fananu/Nomwin such as Onoun.
Kapingamarangi has been getting rain in recent weeks, but the monthly totals are still below the 8-inch monthly minimum needed to meet most water needs. February 2021 (with 5.86 inches) ranked 12th driest (35th percentile), January-February (11.78 inches) ranked 6th driest (20th percentile), December-February (15.55 inches) ranked 4th driest (15th percentile), and November-February (18.38 inches) ranked third driest (12th percentile). These recent percentiles are in the D1 range. But longer time scales are driest on record, including March-February (6th percentile). This long-term dryness and lingering agricultural impacts resulted in D3-SL continuing.
The rest of the stations continued at D-Nothing status, but several have been dry for the last 2 weeks and for February. Pingelap has been dry the last 2 weeks and dry for February, but the previous week was wet. Ulithi was dry for February and this week but wet the week before. Kosrae has been dry the last 2 weeks, but wet for February. These stations will be watched for possible D0-S if the dryness continues.
In the RMI, no analysis was made for Utirik due to lack of data, but the pattern suggests it has been dry there. Rainfall totals for the week included a trace at Wotje, 0.03 inch at Jaluit, 0.40 inch at Kwajalein, 0.46 inch at Ailinglaplap, 0.61 inch at Mili, and 1.02 inches at Majuro. February totals range from 0 inches at Wotje and 1.97 inches at Kwajalein to 4.40 inches at Ailinglaplap and 4.88 inches at Mili. These are all below the 8-inch monthly minimum needed to meet most water needs.
Wotje has been dry for the last several weeks, has reported no measurable rain for February, 1.82 inches for January-February, and 5.64 inches for December-February. Two other years (1990 and 1994) had zero rainfall for February, which ranks February 2021 as a tie for driest on record (8th percentile, or tied at 3 out of 38 years). January-February 2021 ranks 5th driest on record (13th percentile), and December-February ranks 9th driest (26th percentile). The National Weather Service has received reports of empty water catchments at the islands in the Wotje atoll with only one water catchment on the main island of Wotje (at the Church in the community) having water usable for drinking. Groundwater has been used for all other purposes. Vegetation on Wotje has turned yellow. Based on precipitation percentiles, D2-S continues at Wotje.
It has been dry at Kwajalein, with 1.97 inches for February, 4.31 inches for January-February, and 8.33 inches for December-February. The ranks (and percentiles) are 28th driest (41st percentile), 17th driest (25th percentile), and 8th driest (12th percentile), respectively. Kwajalein has a history of rainfall totals during the dry season being below the monthly minimum needed to meet most water needs. D2-S continues at Kwajalein.
Jaluit has been dry (below the 2-inch weekly minimum) for the last 7 consecutive weeks and below the monthly minimum for the last 2 months. The February rainfall total of 2.24 inches ranks 6th driest (16th percentile) and January-February total of 7.92 inches ranks 4th driest (11th percentile). The National Weather Service has received reports of empty water catchments on Jaluit and yellowing of some vegetation. Based on the precipitation percentiles and impacts reports, the USDM status at Jaluit was worsened from D0-S to D1-S.
Majuro has been dry for three of the last 4 weeks, February was dry (3.89 inches), and the reservoir has been below the level of concern for the last several weeks, generally decreasing throughout February and ending the month at 23.862 million gallons, which is 66% of maximum. Majuro was worsened to D0-S this week.
Ailinglaplap and Mili were both dry this week and last week, and February was dry, but it was wet the week before. D-Nothing continues for now, but they will be watched for possible D0-S if the dryness continues.
The Palau IAP and Koror COOP/ROR stations were wet this week with 2.59 and 2.45 inches, respectively. The American Samoan stations were wet or nearly wet with weekly totals of 1.19, 0.97, and 1.06 inches, respectively, at Pago Pago and the automated stations at Siufaga Ridge and Toa Ridge. All of these stations were wet for February and in previous weeks, so D-Nothing continues in Palau and Tutuila.
Virgin Islands
The weather conditions across the U.S. Virgin Islands (USVI) during this USDM week (02/24/21-03/02/21) were dominated by dry air and high pressure ridging in the mid and upper levels of the atmosphere. Patches of moisture moving in the easterly trade winds brought scattered showers, but the dry stable conditions aloft limited rainfall totals.
Radar-based estimates of rainfall (QPE) for the 7 days ending at 12z on Tuesday showed locally up to half an inch of rain across parts of St. Thomas and St. John islands, and southwest parts of St. Croix. Other parts of the islands had an estimated less than a fourth of an inch, and eastern parts of St. Croix had little to no precipitation based on this indicator.
Weekly rainfall totals on St. Croix ranged from 0.11 inch at the CoCoRaHS station at Christiansted 4.1 ESE, 0.20 inch at Christiansted 1.8 ESE, and 0.21 inch at Frederiksted 2.3 N to 0.32 inch at Frederiksted 2.3 SSE, 0.39 inch at Frederiksted 0.5 N, and 0.45 inch at Christiansted 1.6 E. East Hill recorded 0.27 inch and Rohlsen AP reported 0.37 inch. February monthly totals ranged from 0.79 inch at Frederiksted 2.3 SSE to 1.29 inches at Christiansted 1.6 E. East Hill had 0.82 inch, which was 58% of normal, and Rohlsen AP had 0.88 inch, which was 53% of normal. February 2021 was the 13th driest February in the 61-year record at Rohlsen AP, January-February the 24th driest, and December-February the 18th driest. The Standardized Precipitation Index (SPI) at Rohlsen AP was at D1 levels for the last 6 months and D0 at the 9- and 12-month levels. The USGS Adventure 28 well has steadily declined from January 1 to February 12, then rose, but has been dropping in the last 12 days. The USDM status at St. Croix was changed from D1-S to D1-SL to reflect the longer-term moisture deficits.
Weekly rainfall totals on St. Thomas ranged from 0.13 inch at the CoCoRaHS station at Charlotte Amalie 5.1 E and 0.27 inch at Anna’s Retreat 2.5 ESE to 0.40 inch at Charlotte Amalie West 4.2 WNW, 0.44 inch at King AP, and 0.56 inch at Charlotte Amalie 1.4 NE. February totals ranged from 1.13 inches at King AP (which was 79% of normal), 1.35 inches at Charlotte Amalie 5.1 E, and 1.40 inches at Anna's Retreat 2.5 ESE, to 2.84 inches at Charlotte Amalie West 4.2 WNW and 2.90 inches at Charlotte Amalie 1.4 NE. At King AP, February 2021 was the 21st driest February in the 56-year record, January-February was 8th driest, and December-February ranked 7th driest. The SPI at King AP was slightly negative at the 1-month time scale but -1.73, or in D3 range, for the last 3 months. The USGS Grade School 3 well has been in general decline during the last 2 months and steadily declined in the last 2 weeks. D1-S continues at St. Thomas.
On St. John, weekly rainfall totals ranged from 0.22 inch at Windswept Beach to 0.41 inch at Cruz Bay 0.8 NE and 0.62 inch at Cruz Bay 1.6 E. February monthly totals included 2.01 inches at Cruz Bay 1.6 E and 2.05 inches at Cruz Bay 0.8 NE, but 1.42 inches at Windswept Beach. The USGS Susannaberg DPW 3 well has been steadily declining since January 1. D1-S continues on St. John.
Looking Ahead
Over the next 5-7 days, it is anticipated that precipitation totals will be greatest along the West Coast from central California into the Pacific Northwest. The Plains and Midwest as well as the Rocky Mountains may see a more active pattern, with the greatest amounts of precipitation expected over the northern Plains and Upper Midwest and portions of the central Plains. Dry conditions will dominate the Mid-Atlantic and into the Tennessee River Valley while the Florida peninsula may have several opportunities for precipitation.
The 6-10 day outlooks show the greatest chances of above-normal precipitation centered on the Midwest, with much of the country showing above-normal chances of above-normal precipitation. Coastal areas of the Southeast and into the peninsula of Florida are showing the greatest chances of below-normal precipitation. There are above-normal chances of above-normal temperatures for most areas east of the Rocky Mountains, with the greatest chances in the Midwest. Above-normal chances of below-normal temperatures are expected over much of the West, with coastal areas having the greatest chances.
Author(s):
Brian Fuchs, National Drought Mitigation Center
Richard Heim, NOAA/NCEI
Dryness Categories
D0 Abnormally Dry—used for areas showing dryness but not yet in drought, or for areas recovering from drought.
Drought Intensity Categories
D1 Moderate Drought
D2 Severe Drought
D3 Extreme Drought
D4 Exceptional Drought
Drought or Dryness Types
S Short-term, typically less than 6 months (agriculture, grasslands)
L Long-term, typically more than 6 months (hydrology, ecology)
SL Area contains both short- and long-term impacts
Source: National Drought Mitigation Center
