


IMPORTANT NOTE: The employment data for the month of January 2020 is taken from the survey week including January 12. Data for the month of February is scheduled for release on March 26, 2021.
NOTE: This release incorporates revised historical labor force numbers and industry employment data. Each year our labor force and employment data are updated to reflect additional data inputs and estimation techniques. These data are produced in cooperation with the U.S. Bureau of Labor Statistics, based on the same methodology used by all states.
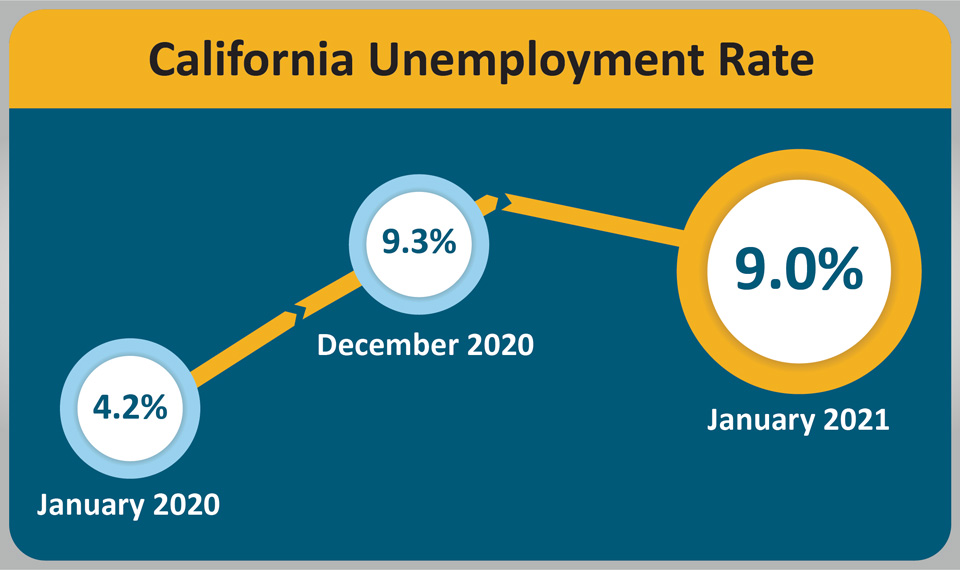
March 13, 2021 - SACRAMENTO – California’s unemployment rate dropped 0.3 percentage points to 9.0 percent in January as the state’s employers lost 69,900 jobs1, according to data released on Friday by the California Employment Development Department (EDD) from two surveys. This comes after December’s downward-revised month-over loss of 75,400 jobs (-23,200 jobs) due, in part, to new 2020 benchmark data and methodology. Despite December and January combining for a two-month total of 145,300 jobs lost, California has regained more than 39 percent of the upwards-revised 2,714,800 nonfarm jobs that were lost during the COVID-19 pandemic in March and April, 2020.

California’s Labor Market, by the Numbers...
- California’s month-over unemployment rate improved from an upwards-revised 9.3 percent in December 2020 to 9.0 in January2 thanks, in part, to an increase in total civilian employment (+31,800).
- Six of California’s 11 industry sectors gained jobs last month. Trade, Transportation, and Utilities (+13,700) had the state’s largest month-over increase thanks to gains in retail trade, while Leisure & Hospitality (-70,600) had the biggest decrease due to large losses in Accommodation and Food Services.
- Benchmark revisions amount to a new lower peak unemployment rate of 16 percent during the pandemic, reached in April-May - down from the 16.4 percent estimate. But the job loss from February-December was revised up from 1.46 million to 1.72 million.
1. The nonfarm payroll job numbers come from a federal survey of 80,000 California businesses.
2. The unemployment rate comes from a separate federal survey of 5,100 California households.
Data Trends about Jobs in the Economy
Total Nonfarm Payroll Jobs
This information comes from a monthly survey of approximately 80,000 California businesses that estimates jobs in the economy – seasonally adjusted.
- Month-over – Total nonfarm jobs in California’s 11 major industries totaled 15,868,000 in January – a net loss of 69,900 jobs from December. This followed a downward-revision of 23,200 jobs in December for a month-over loss of 75,400 jobs that month.
- Year-over – Total nonfarm jobs decreased by 1,752,800 (a 9.9 percent decrease) from January 2020 to January 2021 compared to the U.S. annual loss of 9,603,000 jobs (a 6.3 percent decrease).

Total Farm jobs – The number of jobs in the agriculture industry increased by 2,000 from December 2020 to 420,200 jobs in January 2021. The agricultural industry has the same number of farm jobs as it did in January 2020.
Data Trends about Workers in the Economy
Employment and Unemployment in California
This information is based on a monthly federal survey of 5,100 California households which focuses on workers in the economy.
- Employed – The number of Californians with jobs in January was 16,988,800, an increase of 31,800 jobs from December’s total of 16,957,000, but down 1,624,500 from the employment total in January of last year.
- Unemployed – The number of unemployed Californians was 1,680,100 in January, a decrease of 68,400 over the month, but up by 856,300 in comparison to January of last year.

Unemployment Insurance Claims (Not Seasonally Adjusted)
The following data is from a sample week that includes the 19th of each month: In related data that figures into the state’s unemployment rate, there were 818,589 people certifying for Unemployment Insurance benefits during the January 2021 sample week. That compares to 1,007,331 people in December and 339,026 people in January 2020. Concurrently, 58,377 initial claims were processed in the January 2021 sample week, which was a month-over decrease of 100,715 claims from December 2020, but a year-over increase of 12,635 claims from January 2020.

| COUNTY | LABOR FORCE | EMPLOYMENT | UNEMPLOYMENT | RATE |
|---|---|---|---|---|
| STATE TOTAL | 18,623,500 | 16,901,800 | 1,721,700 | 9.2% |
| ALAMEDA | 802,100 | 743,800 | 58,300 | 7.3% |
| ALPINE | 620 | 580 | 40 | 6.9% |
| AMADOR | 14,330 | 13,140 | 1,190 | 8.3% |
| BUTTE | 89,100 | 81,700 | 7,400 | 8.3% |
| CALAVERAS | 21,140 | 19,670 | 1,460 | 6.9% |
| COLUSA | 10,210 | 8,620 | 1,600 | 15.6% |
| CONTRA COSTA | 534,600 | 494,300 | 40,200 | 7.5% |
| DEL NORTE | 9,290 | 8,460 | 830 | 9.0% |
| EL DORADO | 91,100 | 84,800 | 6,300 | 6.9% |
| FRESNO | 444,700 | 400,300 | 44,400 | 10.0% |
| GLENN | 12,180 | 11,210 | 960 | 7.9% |
| HUMBOLDT | 58,700 | 54,400 | 4,300 | 7.3% |
| IMPERIAL | 65,000 | 54,300 | 10,800 | 16.5% |
| INYO | 8,260 | 7,690 | 570 | 6.9% |
| KERN | 381,200 | 340,200 | 41,000 | 10.8% |
| KINGS | 55,800 | 49,800 | 6,000 | 10.7% |
| LAKE | 28,600 | 26,070 | 2,530 | 8.8% |
| LASSEN | 9,440 | 8,790 | 650 | 6.9% |
| LOS ANGELES | 4,916,600 | 4,290,200 | 626,400 | 12.7% |
| MADERA | 62,800 | 56,800 | 6,000 | 9.6% |
| MARIN | 129,000 | 122,000 | 7,000 | 5.4% |
| MARIPOSA | 6,760 | 5,940 | 820 | 12.1% |
| MENDOCINO | 36,140 | 33,380 | 2,770 | 7.7% |
| MERCED | 113,900 | 100,800 | 13,000 | 11.4% |
| MODOC | 3,120 | 2,830 | 300 | 9.5% |
| MONO | 8,570 | 7,800 | 760 | 8.9% |
| MONTEREY | 202,800 | 180,000 | 22,700 | 11.2% |
| NAPA | 67,500 | 61,700 | 5,800 | 8.6% |
| NEVADA | 46,780 | 43,640 | 3,150 | 6.7% |
| ORANGE | 1,516,800 | 1,404,800 | 112,000 | 7.4% |
| PLACER | 185,600 | 174,500 | 11,100 | 6.0% |
| PLUMAS | 7,080 | 6,240 | 840 | 11.9% |
| RIVERSIDE | 1,105,400 | 1,010,200 | 95,200 | 8.6% |
| SACRAMENTO | 711,200 | 653,300 | 57,900 | 8.1% |
| SAN BENITO | 30,700 | 28,000 | 2,700 | 8.9% |
| SAN BERNARDINO | 969,400 | 885,600 | 83,800 | 8.6% |
| SAN DIEGO | 1,517,300 | 1,395,000 | 122,300 | 8.1% |
| SAN FRANCISCO | 535,400 | 501,900 | 33,500 | 6.3% |
| SAN JOAQUIN | 330,100 | 297,200 | 33,000 | 10.0% |
| SAN LUIS OBISPO | 131,100 | 122,300 | 8,800 | 6.7% |
| SAN MATEO | 420,000 | 396,000 | 24,000 | 5.7% |
| SANTA BARBARA | 210,600 | 194,300 | 16,200 | 7.7% |
| SANTA CLARA | 1,004,700 | 947,300 | 57,400 | 5.7% |
| SANTA CRUZ | 128,500 | 117,500 | 11,000 | 8.6% |
| SHASTA | 73,900 | 68,100 | 5,800 | 7.9% |
| SIERRA | 1,260 | 1,160 | 90 | 7.4% |
| SISKIYOU | 16,450 | 14,850 | 1,600 | 9.7% |
| SOLANO | 201,200 | 183,900 | 17,400 | 8.6% |
| SONOMA | 234,000 | 217,300 | 16,700 | 7.1% |
| STANISLAUS | 238,600 | 216,300 | 22,300 | 9.3% |
| SUTTER | 43,300 | 38,900 | 4,400 | 10.2% |
| TEHAMA | 25,210 | 23,190 | 2,030 | 8.0% |
| TRINITY | 4,400 | 4,060 | 340 | 7.7% |
| TULARE | 194,700 | 172,700 | 22,100 | 11.3% |
| TUOLUMNE | 19,750 | 17,960 | 1,790 | 9.1% |
| VENTURA | 401,900 | 372,000 | 29,900 | 7.4% |
| YOLO | 105,500 | 98,200 | 7,300 | 7.0% |
| YUBA | 29,200 | 26,200 | 2,900 | 10.1% |
Source: EDD

