


IMPORTANT NOTE: The employment data for the month of March 2021 is taken from the survey week including March 12. Data for the month of April is scheduled for release on May 21, 2021.
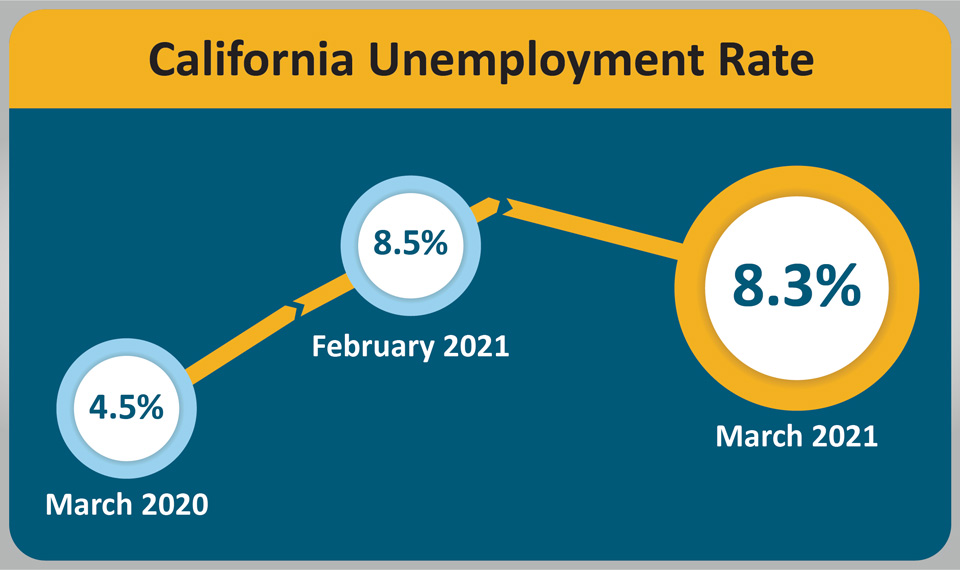
April 16, 2021 - SACRAMENTO – California’s unemployment rate decreased 0.2 percentage points to 8.3 percent in March as the state’s employers gained 119,600 jobs1, according to data released today by the California Employment Development Department (EDD) from two surveys. This comes after February’s upwards-revised (+15,100 jobs) month-over gain of 156,100 jobs, which alone was more than the 155,400 jobs lost in December 2020 and January 2021 combined. California has now regained almost 44 percent of the 2,714,800 total nonfarm jobs lost in March and April 2020 due to the COVID-19 pandemic.

California’s Labor Market, by the Numbers...
- California’s month-over unemployment rate improved from 8.5 percent in February to 8.3 percent in March2 down from the 16 percent peak in April 2020.
- All but one of California’s 11 industry sectors gained jobs last month. Leisure & Hospitality (+42,400) continued to have the state’s largest month-over increase thanks to Full-Service Restaurants. Trade, Transportation, and Utilities (+32,200) also had large gains thanks to strength in Clothing Stores and Transportation and Warehousing. Strong gains were also posted in Professional and Business Services (+22,000) led by accounting, tax preparation, and bookkeeping firms.
- Financial Activities (-600) was the only industry sector to suffer a month-over job loss, which was mainly due to declines in Finance and Insurance, as well as Activities Related to Real Estate.
1. The nonfarm payroll job numbers come from a federal survey of 80,000 California businesses.
2. The unemployment rate comes from a separate federal survey of 5,100 California households.
Data Trends about Jobs in the Economy
Total Nonfarm Payroll Jobs
This information comes from a monthly survey of approximately 80,000 California businesses that estimates jobs in the economy – seasonally adjusted.
- Month-over – Total nonfarm jobs in California’s 11 major industries totaled 16,133,600 in March – a net gain of 119,600 jobs from February. This followed an upwards-revision of 15,100 jobs for a revised month-over gain of 156,100 jobs in February.
- Year-over – Total nonfarm jobs decreased by 1,350,500 (a 7.7 percent decrease) from March 2020 to March 2021 compared to the U.S. annual loss of 6,720,000 jobs (a 4.5 percent decrease).

Total Farm jobs – The number of jobs in the agriculture industry decreased by 1,200 from February to 421,900 jobs in March. The agricultural industry had 5,900 more farm jobs in March 2021 than it did the March prior.
Data Trends about Workers in the Economy
Employment and Unemployment in California
This information is based on a monthly federal survey of 5,100 California households which focuses on workers in the economy.
- Employed – The number of Californians with jobs in March was 17,342,600, an increase of 9,900 jobs from February’s total of 17,332,700, but down 962,000 from the employment total in March of last year.
- Unemployed – The number of unemployed Californians was 1,560,400 in March, a decrease of 49,600 over the month, but up by 696,300 in comparison to March of last year.

Unemployment Insurance Claims (Not Seasonally Adjusted)
The following data is from a sample week that includes the 19th of each month: In related data that figures into the state’s unemployment rate, there were 680,279 people certifying for Unemployment Insurance benefits during the March 2021 sample week. That compares to 794,348 people in February and 424,645 people in March 2020. Concurrently, 96,212 initial claims were processed in the March 2021 sample week, which was a month-over increase of 5,500 claims from February, but a year-over decrease of 90,267 claims from March 2020.

| COUNTY | LABOR FORCE | EMPLOYMENT | UNEMPLOYMENT | RATE |
|---|---|---|---|---|
| STATE TOTAL | 18,912,300 | 17,361,100 | 1,551,200 | 8.2% |
| ALAMEDA | 804,600 | 752,500 | 52,100 | 6.5% |
| ALPINE | 610 | 560 | 50 | 7.6% |
| AMADOR | 14,460 | 13,390 | 1,070 | 7.4% |
| BUTTE | 92,800 | 85,900 | 6,900 | 7.5% |
| CALAVERAS | 21,280 | 19,930 | 1,350 | 6.3% |
| COLUSA | 10,480 | 8,860 | 1,620 | 15.4% |
| CONTRA COSTA | 536,700 | 500,400 | 36,300 | 6.8% |
| DEL NORTE | 9,290 | 8,510 | 770 | 8.3% |
| EL DORADO | 91,000 | 85,200 | 5,700 | 6.3% |
| FRESNO | 438,300 | 394,700 | 43,600 | 9.9% |
| GLENN | 12,740 | 11,810 | 930 | 7.3% |
| HUMBOLDT | 59,900 | 55,900 | 4,000 | 6.7% |
| IMPERIAL | 65,100 | 54,900 | 10,200 | 15.7% |
| INYO | 8,310 | 7,780 | 540 | 6.4% |
| KERN | 368,500 | 327,600 | 40,900 | 11.1% |
| KINGS | 55,200 | 49,400 | 5,800 | 10.5% |
| LAKE | 29,180 | 26,860 | 2,320 | 7.9% |
| LASSEN | 9,430 | 8,800 | 620 | 6.6% |
| LOS ANGELES | 5,103,400 | 4,548,200 | 555,100 | 10.9% |
| MADERA | 60,600 | 54,800 | 5,900 | 9.7% |
| MARIN | 131,300 | 125,100 | 6,200 | 4.8% |
| MARIPOSA | 6,690 | 6,060 | 630 | 9.4% |
| MENDOCINO | 36,510 | 33,920 | 2,590 | 7.1% |
| MERCED | 115,100 | 101,900 | 13,100 | 11.4% |
| MODOC | 3,230 | 2,940 | 290 | 8.9% |
| MONO | 8,160 | 7,530 | 640 | 7.8% |
| MONTEREY | 206,800 | 185,200 | 21,600 | 10.4% |
| NAPA | 68,400 | 63,900 | 4,500 | 6.6% |
| NEVADA | 46,610 | 43,750 | 2,850 | 6.1% |
| ORANGE | 1,541,900 | 1,443,300 | 98,600 | 6.4% |
| PLACER | 185,400 | 175,200 | 10,200 | 5.5% |
| PLUMAS | 7,250 | 6,380 | 870 | 12.0% |
| RIVERSIDE | 1,115,300 | 1,029,800 | 85,500 | 7.7% |
| SACRAMENTO | 707,900 | 655,600 | 52,300 | 7.4% |
| SAN BENITO | 31,300 | 28,700 | 2,600 | 8.2% |
| SAN BERNARDINO | 979,400 | 902,700 | 76,700 | 7.8% |
| SAN DIEGO | 1,538,200 | 1,432,600 | 105,700 | 6.9% |
| SAN FRANCISCO | 542,500 | 513,100 | 29,500 | 5.4% |
| SAN JOAQUIN | 333,300 | 302,600 | 30,700 | 9.2% |
| SAN LUIS OBISPO | 130,300 | 122,700 | 7,600 | 5.8% |
| SAN MATEO | 426,200 | 404,900 | 21,300 | 5.0% |
| SANTA BARBARA | 214,600 | 200,500 | 14,200 | 6.6% |
| SANTA CLARA | 1,013,000 | 961,300 | 51,700 | 5.1% |
| SANTA CRUZ | 129,800 | 119,200 | 10,600 | 8.1% |
| SHASTA | 73,500 | 68,000 | 5,500 | 7.5% |
| SIERRA | 1,300 | 1,200 | 100 | 7.5% |
| SISKIYOU | 16,650 | 15,110 | 1,550 | 9.3% |
| SOLANO | 202,000 | 186,300 | 15,700 | 7.8% |
| SONOMA | 241,000 | 226,600 | 14,400 | 6.0% |
| STANISLAUS | 238,200 | 217,200 | 21,100 | 8.8% |
| SUTTER | 44,000 | 39,500 | 4,500 | 10.1% |
| TEHAMA | 25,240 | 23,240 | 2,000 | 7.9% |
| TRINITY | 4,450 | 4,120 | 330 | 7.4% |
| TULARE | 193,700 | 171,300 | 22,400 | 11.6% |
| TUOLUMNE | 19,740 | 18,110 | 1,630 | 8.3% |
| VENTURA | 406,600 | 380,500 | 26,100 | 6.4% |
| YOLO | 105,700 | 98,900 | 6,800 | 6.4% |
| YUBA | 29,300 | 26,500 | 2,800 | 9.7% |
Source: EDD

