


California and National Drought Summary for May 11, 2021
Summary
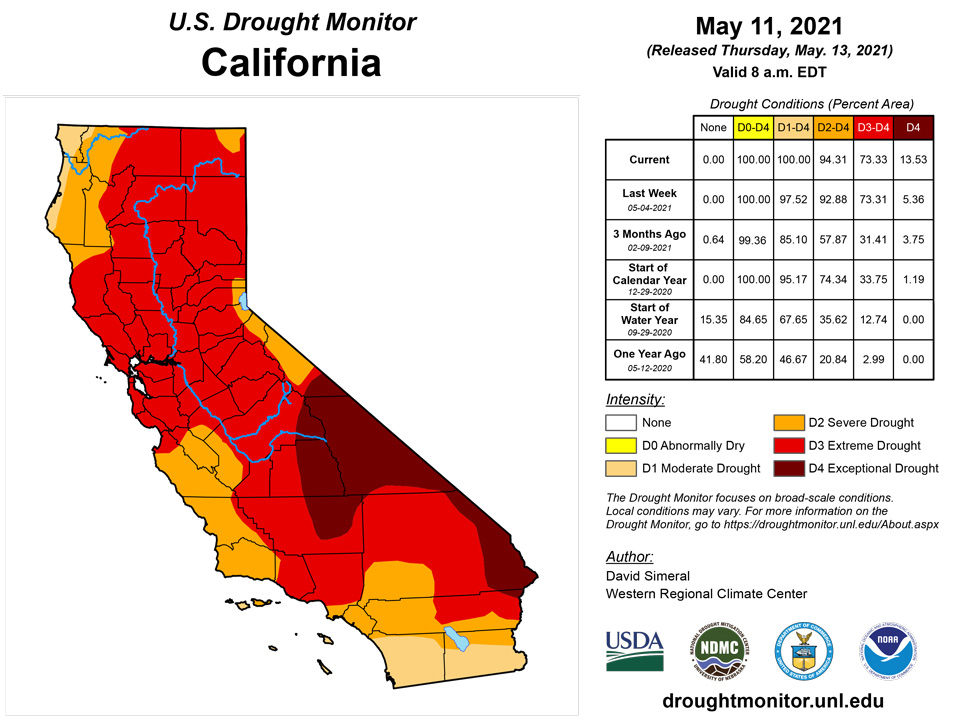
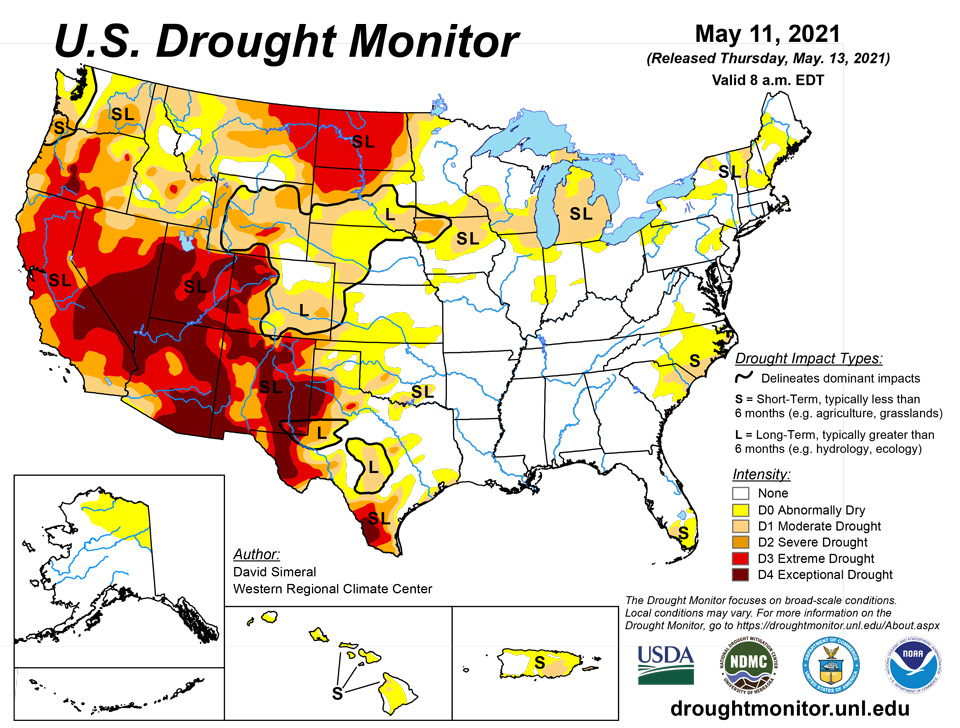
May 13, 2021 - This U.S. Drought Monitor (USDM) week saw deterioration in drought-related conditions on the map across areas of the West, including California, Oregon, Washington, Utah, and Montana. Moving into dry season, California is expecting drought impacts to intensify during the summer months as snowpack runoff is forecasted to be below normal and reservoir storage levels at the state’s two largest reservoirs (Lake Shasta and Lake Oroville) are at 48% and 41% of average, respectively. In response to the deteriorating conditions, Governor Newsom expanded the coverage of his recent drought emergency declaration to include an additional 39 counties statewide. In the Southwest, Lake Powell is currently 35% full and Lake Mead is 38% full with the total Lower Colorado system at 43% full (compared to 52% full at the same time last year) as of May 10, according to the U.S. Bureau of Reclamation. In New Mexico, the state’s largest reservoir along the Rio Grande is currently at 12% full. In Arizona, the Salt River Project is reporting the Salt River system reservoirs at 79% full, the Verde River system at 32% full, and the total reservoir system at 73% full (compared to 98% full a year ago). In the High Plains, portions of eastern Colorado and Wyoming saw improvement in drought conditions in response to recent rainfall events and improvement in soil moisture levels. In the Midwest and Northeast, beneficial rainfall during the past two weeks has helped reduce areas of drought on the map. In the South and Southeast, heavy rainfall impacted portions of the region during the past several weeks, leading to reductions in areas of drought in response to improved soil moisture and streamflow levels.
Northeast
On this week’s map, numerous states in the region saw improvements on the map, including Pennsylvania, New York, Connecticut, Massachusetts, Vermont, New Hampshire, and Maine. The improvements occurred in areas of Moderate Drought (D1) and Abnormally Dry (D0) where precipitation has been normal to above normal over the past 30-day period. The recent rains provided a boost to soil moisture and streamflow levels across most of the region. For the week, precipitation accumulations generally ranged from 1 to 4+ inches with the highest totals observed in northern Pennsylvania and southern New York. Average temperatures for the week were 2 to 8 deg F below normal, which helped reduce evaporative demand across the region. According to NOAA’s National Center for Environmental Information (NCEI), the January 2021 through April 2021 period was the 18th driest (-2.31-inch anomaly) on record (1895–2021) for the Northeast Climate Region. In terms of average temperature rankings, the past 12-month period was the 5th warmest (+3.0 deg F anomaly) on record.
Southeast
During the past week, moderate to heavy rainfall accumulations were observed across parts of the region, including northern Alabama, northwestern Georgia, and the Florida Panhandle. In those areas, rainfall totals ranged from 2 to 8+ inches. Elsewhere in the region, isolated showers were observed with accumulations of less than 1 inch. On the map, this week’s rainfall led to the removal of areas of Abnormally Dry (D0) in Alabama, Georgia, and South Carolina where the 30-day percent of normal precipitation ranged from 125% to 250% of normal. Elsewhere in the region, conditions deteriorated on the map in areas of eastern portions of the Carolinas where precipitation has been below normal over the past 60-day period (2-to-5-inch deficits) and streamflows are dipping below normal levels (<24th percentile). The NASA SPoRT (Short-term Prediction Research and Transition Center) soil moisture product is showing some very dry soils (<10th percentile at the 0 to 10 cm depth) in areas where Moderate Drought (D1) was introduced on the map this week. Average temperatures for the week were generally below normal (2 to 6 deg F) with the exception of Florida where temperatures ranged from 2 to 6 deg F above normal.
South
Across portions of the region, the active pattern continued with significant rainfall accumulations observed in portions of eastern Texas, Louisiana, and Mississippi where 7-day totals ranged from 2 to 8 inches. According to the U.S. Geological Survey (USGS), 7-day average streamflows were above normal across much of the region—particularly in southeastern Texas and southern Louisiana where streamflow percentiles were greater than the 90th percentile. On the map, isolated rainfall activity (1 to 2 inches) this week led to some minor improvements in southern and north-central Texas, whereas portions of the Texas Panhandle and the Trans-Pecos region of western Texas saw some deterioration in drought-related conditions and an expansion of areas of drought on the map. In west-central and northern Oklahoma, short-term precipitation deficits and areas of below-normal soil moisture led to a slight expansion of areas of Abnormally Dry (D0) on the map. For March and April, precipitation across the South Climate Region was slightly above normal (40th wettest). However, at the state level, Louisiana observed its 8th wettest April on record with the cities of Baton Rouge and New Orleans observing their 2nd and 5th wettest April, respectively.
Midwest
On this week’s map, there were reductions in areas of Abnormally Dry (D0) across portions of Iowa, Illinois, Indiana, and Ohio, as well as improvements in areas of Moderate Drought (D1) in northern Michigan where rainfall has been above normal during the past 30-to-60-day period and 7-day average streamflows are running in the normal to above normal range. Conversely, streamflow activity in southern Michigan is running well below normal levels and NASA SPoRT is showing topsoil moisture below the 10th percentile. The dryness in this area is also showing up in the Vegetation Drought Response Index (VegDRI) product. Average temperatures for the week were below normal across the entire region (4 to 12 deg F). According to the NOAA NCEI’s climatological rankings, Iowa observed its 13th driest April on record and the last 5-month period was the 9th driest on record for Michigan.
High Plains
On this week’s map, areas of the region—including Colorado and Wyoming —saw improvements, including a reduction in areas of Extreme Drought (D3), Severe Drought (D2), and Moderate Drought (D1) in response to rainfall during the past week and above-normal precipitation during the past 30-to-60-day period. During the past 60 days, the percentage of normal precipitation has been ~150 to 300% of normal. Moreover, NASA SPoRT is showing soil moisture levels (0 to 10 cm depth) ranging from the 70th to the 98th percentile. Conversely, abnormally dry soils and areas of dry vegetation are being observed in far western portions of Colorado and Wyoming. In terms of streamflow activity, 7-day average streamflows are much below normal (<10th percentile) across much of western Colorado, southwestern Wyoming, and northern portions of North Dakota. Average temperatures for the week were mainly below normal (2 to 12 deg F) with the greatest negative departures observed in the Dakotas. According to the latest (May 10) USDA North Dakota Crop Progress and Condition report, topsoil across the state was rated 52% very short and 28% short with subsoil moisture supplies rated 52% very short and 29% short. In Colorado, reservoir storage levels statewide (end of April) are below normal at 85% of average compared to 104% of average last year. Storage levels were notably below normal in the San Miguel, Dolores, Animas, and San Juan Basins at 57% of average compared to 95% of average last year at the same time. In terms of NOAA NCEI’s climatological rankings, North Dakota observed its driest 6- and 9-month periods on record. On a climate-division level, western Colorado’s Climate Division 2 (Colorado Drainage) observed its driest April on record, as well as its driest 12-month period on record.
West
Out West, approximately 84% of the region is currently in drought on the map with 47% in Extreme Drought (D3) or Exceptional Drought (D4). On this week’s maps, drought intensified in areas of California, Oregon, Washington, Montana, and Utah as dry conditions continued this week across most of the region. In California, areas of Exceptional Drought (D4) expanded on the map in the southern and eastern Sierra in response to very poor snowpack conditions during the 2020–2021 Water Year. In the southern Sierra, the Tulare Basin 6-Station Precipitation Index for the Water Year to Date (WYTD) is currently showing its 2nd driest Water Year on record—only slightly ahead of the driest year on record back in the 1976–1977 season. In the central Sierra, the San Joaquin 5-Station Index is currently observing its 3rd driest WYTD on record and in the northern Sierra, the Northern Sierra 8-station Index its 2nd driest WYTD on record. In response to deteriorating conditions across much of California, Governor Newsom expanded the drought emergency declaration to cover 39 additional counties across the state, including counties in the Sacramento and San Joaquin River watersheds. In Arizona, the U.S. Forest Service is reporting a drought-related die-off of juniper trees across portions of central and northern Arizona in Prescott and Kaibab National Forests. In addition, reports are coming in from northern Arizona that ranchers on the Coconino Plateau have been hauling water for cattle and wildlife for the past month because dirt stock tanks are completely dry. In northwestern Oregon, areas of Severe Drought (D2) and Moderate Drought (D1) expanded on this week’s map as streamflow and soil moisture levels continue to degrade. In southwestern Montana, areas of Moderate Drought (D1) expanded on the map in response to below-normal precipitation during the past 30-to-90-day period, low streamflows, and reductions in irrigation allotments. In the Upper Colorado River Basin, May through July streamflow volumes are forecasted to be less than 60% of average and inflow into Lake Powell is forecasted to be 28% of normal. According to NOAA NCEI, the West Climate Region (California and Nevada) had its 6th driest April on record and its 3rd driest October through April period on record. Likewise, the Northwest Climate Region (Idaho, Oregon, and Washington) had its 3rd driest April on record. In the Southwest Climate Region (Four Corners states), the last 12- and 24-month periods were both the driest on record for the region. At the state level, California observed its 6th warmest April on record and Arizona observed its 10th warmest.
Caribbean
In Puerto Rico, 7-day rainfall accumulations of 2 to 6 inches along the Cordillera Central led to the removal of areas of Abnormally Dry (D0) in western portions of the island, whereas areas of Moderate Drought (D1) expanded slightly in response to low streamflow levels (<10th percentile) in southeastern portions.
The NWS’s quantitative precipitation estimates for the past 7 days indicated that rainfall for St. Thomas ranged from more than 1.5 inches on the western end of the island to as little as a tenth of an inch in the east. St. John received mostly less than a tenth of an inch. St. Croix rainfall ranged from more than half of an inch in the west, while the east end remained dry.
A USDA Secretarial Drought Disaster Declaration was triggered for St. John and St. Thomas on May 6th, 2021. The Virgin Islands Department of Agriculture (VIDA) reported that farmers began planning mitigation tools earlier in the year and were also seeking chop to feed livestock. VIDA also indicated that they will be ordering hay from the states and shipping in to ensure livestock farmers have enough to get through the dry season. There were signs of soil cracking on St. Thomas and St. Croix, and vegetation was showing distress across all the islands. With dry conditions across the Virgin Islands, forests and grasslands were at risk for fire.
St. Thomas remained at D2-SL. Precipitation at Cyril E. King AP was 1.52 inches, or above normal. The CoCoRaHS stations reported from 0.03 to 1.39 inches. Year-to-date percent of normal precipitation was 73.3%. The Grade School 3 well on St. Thomas was 13.33 feet below land surface on May 11 and has not been this low since 2017. A few specialty and row crop farmers were using irrigation methods and many were purchasing water which was affecting overall production. Poultry farmers had little to no access to fresh grass, which was brown and very dry due to water scarcity.
St. Croix remained at D2-SL. Precipitation at Henry Rohlsen AP amounted to 0.02 inches. The CoCoRaHS stations reported from 0.08 to 0.39 inches. Year-to-date percent of normal precipitation was 54.6%. The Adventure 28 well was 23.37 feet below land surface and has not been so low since late 2016. Poultry farmers without access to water were using cisterns and were reporting a decrease in egg production due to heat. Livestock farmers on St Croix were seeking to purchase feed as chop was not available, and many were seeking cut and carry to offset feed in an effort to delay the need to purchase hay.
St. John remained at D2-S. The Windswept Beach CoCoRaHS station reported 0.24 inches. Other CoCoRaHS stations reported 0.19 and 0.40 inches. Year-to-date percent of normal precipitation was 55.7%. The Susannaberg DPW 3 well was 16.61 feet below land surface and has been dropping steadily since late 2020. Farmers were reporting that rain was scant and that they were working to use wells and groundwater when available. Most have irrigation set up to water early and late in the day to combat drought conditions. Farmers were reporting that it was hotter and drier than usual, and that a lack of rain and early warm weather were indicators of an early onset of drought conditions.
Pacific
On this week’s map, no changes were made in Alaska. In the Hawaiian Islands, trade-wind showers across the state boosted streamflows along windward slopes, but leeward areas remained generally dry during the past week. On the Big Island, an area of Moderate Drought (D1) was added in the west Pohakuloa region based on satellite-based vegetation health indicators and short-term rainfall data. On the windward side, areas of Abnormally Dry (D0) were trimmed on the map due to improved streamflow levels and recent rainfall. In Maui County, areas of Moderate Drought (D1) were added in the Kihei-Maalaea-Olowalu region on the leeward side of Maui, as well as in southwestern Lanai, southwest Molokai, and across all of Kahoolawe based on short-term rainfall deficits, declining vegetation health, and impact reports from the Natural Resource Conservation Service. On Oahu, areas of Abnormally Dry (D0) were removed along the windward slopes from Kaneohe to Laie based on heavy rainfall late last week and improved streamflow levels. On Kauai, improved streamflow activity led to the removal of areas of Abnormally Dry (D0).
The weather features across the U.S.-Affiliated Pacific Islands (USAPI) during this USDM week (05/05/21-05/11/21) included a weak monsoon trough, with embedded weak circulations, which persisted across parts of western Micronesia (Palau and Yap State to Chuuk State); trade-wind convergence which morphed into a more robust Inter-Tropical Convergence Zone (ITCZ) over eastern Micronesia (Chuuk, Pohnpei, and Kosrae States and the Marshall Islands [RMI]); and a cold front, weak low-level convergence, and tropical disturbance competing at times with the trade-wind flow across the Marianas. A TUTT (Tropical Upper Tropospheric Trough) lingered just north of Micronesia, with its divergence aloft coupling at times with the ITCZ in the east and the surface convergence over the Marianas. South of the equator, a surface trough spent a good part of the week over the Samoan Islands.
Satellite-based estimates of 7-day precipitation (QPE) showed a band of precipitation stretching from the Philippines eastward across Micronesia and beyond (comprising the climatological ITCZ), and another band extending southeastward from Indonesia to the Samoan Islands and beyond (comprising the climatological South Pacific Convergence Zone [SPCZ]). Areas of 2+ inches of rain extended across Palau, the Federated States of Micronesia (FSM), and southern RMI, with a large area of 4+ inches from the central FSM to southern RMI. Patchy precipitation was detected by this QPE tool over the northern Marianas, but little to no rainfall was detected over the southern Marianas, indicating that the rain that did fall there was from low-level (warm) convection. The satellite QPE detected several areas of 4+ inches of rain in the precipitation band across the Samoan region, with one 4+ inch area over Tutuila.
The Republic of Palau remained drought-free with 4+ inches at Palau IAP and Koror COOP in the past week.
The Mariana Islands improved to D0-S from D1-S. Guam received 1.45 inches; Rota, 1.06 inches; and Saipan received from 0.50 to 0.63 inches at the three reporting locations. These islands require an inch per week to meet minimum water needs.
The Federal States of Micronesia mostly received more than 2 inches of rain in the past week, enough to meet minimum water needs, but a few locations came up short. Fananu received 1.56 inches and has not received 2 inches of rain per week for 6 weeks. Ulithi reported 1.44 inches after two prior weeks of low rainfall. Kapingamarangi drought conditions eased from D1-L to D0-L as 2.08 inches of rain fell this week, and April rainfall amounted to 20.43 inches. Weekly rainfall exceeded 4 inches at Kosrae, Lukunor, Nukuoro, Pohnpei and Woleai.
A couple of locations in the Marshall Islands remained dry, although the southern islands were free of dry conditions. Kwajalein remained at D1-S after receiving 0.74 inches. Wotje improved from D3-SL to D2-SL, based upon having no observed drought impacts. Rainfall for Ailinglaplap was 1.15 inches, Mili received 4.72 inches, and Majuro reported 6.13 inches. Majuro’s reservoir was at 31.42 million gallons as of May 10 with a capacity of 36 million gallons.
American Samoa remained free of drought and received 5.93 inches at Pago Pago, 6.40 inches at Siufaga Ridge, and 3.33 inches at Toa Ridge.
Looking Ahead
The NWS WPC 7-Day Quantitative Precipitation Forecast (QPF) calls for moderate-to-heavy liquid accumulations ranging from 2 to 4+ inches across the Gulf Coast region of Louisiana and Texas, as well as the eastern halves of Texas, Oklahoma, Kansas, and areas of the lower Midwest. Lesser accumulations (generally <1 inch) are expected across the Southeast, parts of the Mid-Atlantic, and the Northeast. Out West, dry conditions are forecasted with the exception of areas of eastern New Mexico, Colorado, and areas of Wyoming that are expected to receive accumulations of <1.5 inches. The CPC 6-10-day Outlook calls for a moderate-to-high probability of above-normal temperatures across much of the conterminous United States with the exception of Southern California, western Oregon and Washington, and the Southeast where there is a moderate probability of below-normal temperatures. In terms of precipitation, there is a moderate probability of above-normal precipitation across the northern Rockies, the Plains states, and areas of the Upper Midwest. In contrast, below-normal precipitation is expected across the Pacific Northwest, Northern California, portions of the Southwest, and the Eastern Tier.
Author(s):
David Simeral, Western Regional Climate Center
Denise Gutzmer, National Drought Mitigation Center
Dryness Categories
D0 Abnormally Dry—used for areas showing dryness but not yet in drought, or for areas recovering from drought.
Drought Intensity Categories
D1 Moderate Drought
D2 Severe Drought
D3 Extreme Drought
D4 Exceptional Drought
Drought or Dryness Types
S Short-term, typically less than 6 months (agriculture, grasslands)
L Long-term, typically more than 6 months (hydrology, ecology)
SL Area contains both short- and long-term impacts
Source: National Drought Mitigation Center

