


California and National Drought Summary for December 14, 2021
Summary
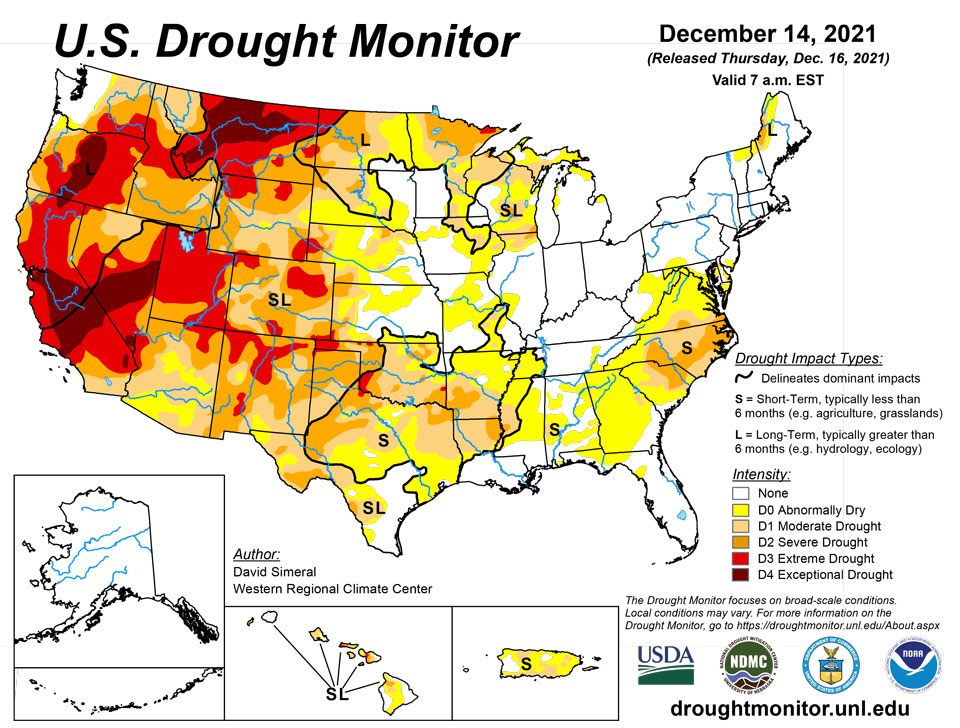
December 16, 2021 - This U.S. Drought Monitor (USDM) week was marked by a much more active storm pattern across the West Coast and Northern Rockies with areas of heavy rain along the coast and valley locations. Further inland, the higher elevations of the Cascade Range, Klamath Mountains, Sierra Nevada Range, northern Great Basin, and the Northern Rockies have all received significant snowfall accumulations this week. The storm event, fueled by an atmospheric river, provided a much-needed boost to snow water equivalent (SWE) levels in the Far West. On December 14, the NRCS SNOTEL network was reporting normal-to-above-normal SWE in Oregon’s Willamette (100% of median) and Southern Oregon Coastal (116%) basins as well as in the Lower Sacramento (113%), San Joaquin (106%), Tulare-Buena Vista Lakes (119%), Truckee (137%), Carson (120%), Walker (122%) and Mono-Owens Lakes (122%) basins of the Sierra Nevada Range. In the Lower Mississippi, Tennessee, and Ohio Valley, an outbreak of violent thunderstorms including dozens of tornadoes, erupted along a path spanning from northeastern Arkansas to northeastern Kentucky. The tornados moved very rapidly through the region on Friday night with devastating effect, especially in the southeastern Kentucky town of Mayfield. In Kentucky, latest reports announced at least 74 people lost their lives, and the death toll is expected to increase. In the Mid-Atlantic, unseasonably warm temperatures were observed over the weekend with daily high-temperature records broken in Pennsylvania, West Virginia, Virginia, Maryland, Delaware, New Jersey, and North Carolina where high temperatures ranged in the mid-60’s to mid-70’s. On the map, short-term precipitation shortfalls and anomalously warm temperatures led to the degradation of drought-related conditions in portions of the Mid-Atlantic, Southeast, South, and in the Midwest, while some improvements were made in the High Plains and isolated areas out West. According to NOAA’s National Center’s for Environmental Information (NCEI), November 2021 was the 7th warmest on record for the contiguous U.S. as well as the 7th warmest January-November period on record. In terms of precipitation, November marked the 8th driest for the contiguous U.S., while year-to-date precipitation ranked in the middle third (61st wettest). At a regional level, the Rockies and Westward Region saw its warmest November (+5.8 deg F anomaly) on record as well as its warmest March-November period on record.
Northeast
In the region, short-term dryness (2-to-4-inch deficits during the past 30-day period) and declining streamflow levels led to minor expansion of areas of Abnormally Dry (D0) in southwestern Pennsylvania, West Virginia, eastern Maryland, Delaware, and southern New Jersey. For the week, precipitation was light across the region with light-to-moderate snowfall accumulations (1 to 6 inches) in areas of Upstate New York as well as northern portions of Vermont, New Hampshire, and Maine. Average temperatures for the week were warmer than normal across much of the region with departures ranging from 1 to 8 deg F above normal. According to NOAA’s National Operational Hydrologic Remote Sensing Center (NOHRSC), 17.4% of the Northeast region was covered by snow with an average depth of 0.7 inches and a maximum depth of 16.9 inches on December 14. In terms of climatological rankings, the August-November and June-November periods were the warmest on record according to NOAA NCEI.
Southeast
During the past week, light to moderate rainfall accumulations (1 to 3 inches) observed across isolated areas of Alabama, Georgia, and the Carolinas led to minor reductions in areas of Moderate Drought (D1) and Severe Drought (D2). Conversely, short-term dryness and declining soil moisture levels expanded areas of Abnormally Dry (D0) in northern Florida. In North Carolina, USGS stream gauges registered below-normal flows across the entire state. Additionally, several soil moisture analysis products showed negative soil moisture anomalies in the Carolinas. Average temperatures for the week were near normal across most of the region with average maximum temperatures ranging from 55 to 65 deg F in the northern extent of the region while temperatures in the southern extent ranged from 70 to 80 deg F in Florida and in southern portions of Alabama and Georgia. According to NOAA NCEI, the Southeast Climate Region experienced its 15th driest November on record.
South
In the South, conditions on the map continued to degrade across areas of Texas and Oklahoma where unseasonably warm and dry conditions prevailed this week. The dry conditions showed up on a variety of drought indicators including satellite-based soil moisture and evaporative demand tools. Additionally, numerous rivers and streams in the western half of the state showed flows dipping below the 20th percentile during the past 7-day period. Rainfall deficits (ranging from 3 to 6+ inches) during the past 60-day period were greatest in southeastern Oklahoma, eastern Texas, Louisiana, and southwestern Arkansas. For the week, average temperatures were above normal (2 to 10+ deg F) across Texas, Oklahoma, Louisiana, Arkansas, and Mississippi.
Midwest
On this week’s map, minor changes were made on the map including expansion of areas of Moderate Drought (D1) and Severe Drought (D2) in southern Wisconsin where precipitation has been below normal during the past 90-day period with deficits ranging from 2 to 4+ inches. Similarly, short-term dryness led to expansion of areas of Abnormally Dry (D0) and Moderate Drought (D1) in Missouri. Conversely, improvements were made on the map in northern Michigan where recent snowfall has helped to improve drought-related conditions. According to NOAA NOHRSC, 50.7% of the Northern Great Lakes Region was covered in snow with an average depth of 3.8 inches and a maximum depth of 21.6 inches. New snowfall observed in the Upper Peninsula of Michigan this week ranged from 2 to 20 inches while areas in southeastern Minnesota and northern Wisconsin received amounts ranging from 4 to 14 inches.
High Plains
On this week’s map, eastern Wyoming, eastern Montana, central North Dakota, southern South Dakota, and northwestern Nebraska saw improvements based on short-term precipitation (30 to 90-day period). This included beneficial snowfall in southern portions of South Dakota where observed totals ranged from 6 to 18 inches with the highest totals in southwestern South Dakota. In these areas, soils have yet to freeze throughout the soil column and melting snows are infiltrating and helping to improve soil moisture levels. According to NOAA NOHRSC, snow coverage in the Upper Midwest Region (includes portions of Wisconsin, Minnesota, the Dakotas, eastern Montana, and northwestern Wyoming) is currently at 52.5% with an average depth of 1.5 inches and a maximum depth of 28.8 inches. Despite some improvements on the map, it is noteworthy that average temperatures across the High Plains region have been well above normal since September. This includes numerous high-temperature records that were recently broken across the region during the first week of December when high temperatures soared into the 70’s.
West
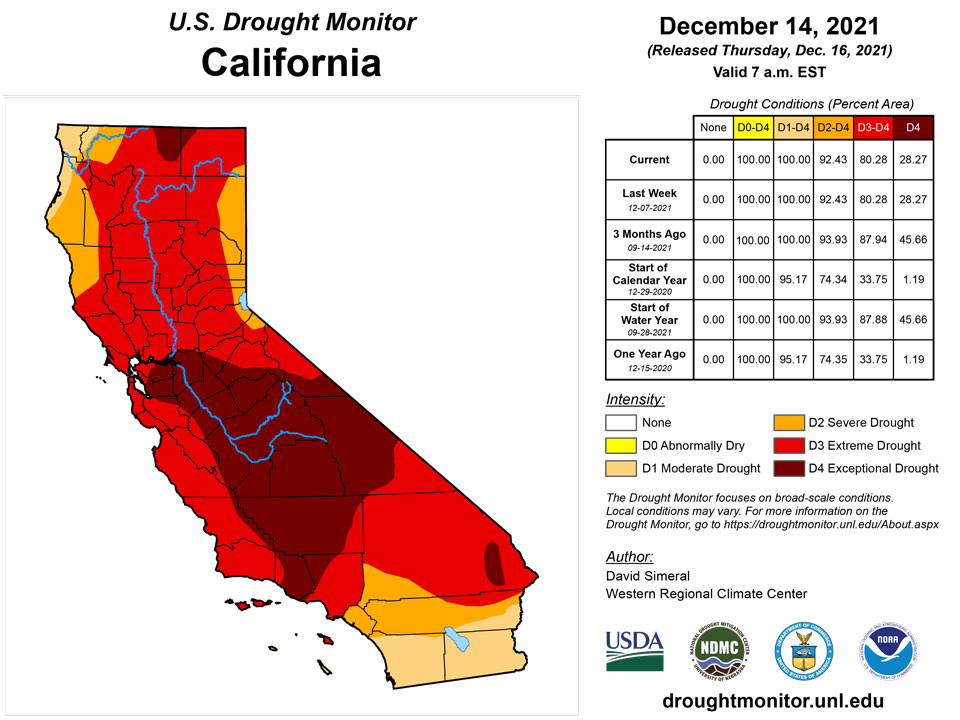
Out West, a weak-to-moderate atmospheric river made landfall in the Pacific Northwest on Saturday and moved southeastward bringing coastal and valley rains as well as heavy mountain snowfall accumulations across California and the Pacific Northwest. For the week, rainfall accumulations along the coastal areas from Washington to California ranged from 3 to 13+ inches with the highest accumulations observed in the coastal ranges of northwestern Oregon and along the Central Coast of California. In terms of snowfall during the multi-day storm event, total accumulations exceeded 6 feet in areas of the Central Sierra while areas in the southern Cascades received up to 3 feet. Further inland, areas of the Northern Rockies in Idaho and northwestern Wyoming, observed snowfall totals ranging from 12 to 20 inches. Despite the beneficial nature of this week’s storm event, significant precipitation deficits (ranging from 4 to 20+ inches) still exist across California and the state’s largest reservoirs are still at critically low levels, with Lake Shasta currently at 46% of the historical average (25% of capacity) and Lake Oroville at 62% of average (31% of capacity). In other areas of the West, basin-level SWE is well below normal, especially in New Mexico where median SWE ranged from 12% to 77% of normal as of Dec 14. On the map, some improvements were made in areas of Extreme Drought (D3) and Exceptional Drought (D4) in Montana, Oregon, and Utah as well as improvements in areas of Severe Drought (D2) and Moderate Drought (D1) in Idaho and Wyoming. According to NOAA NCEI, November 2021 was the 2nd warmest on record for the West and Southwest climate regions. Moreover, California and Wyoming both recorded their warmest average minimum temperatures on record for November while Nevada, Utah, and Colorado observed their 2nd warmest on record. In terms of precipitation, the Southwest Climate Region was notably dry having its 5th driest November on record.
Caribbean
In Puerto Rico, no changes were made on the map this week. Rainfall for the week was restricted to the northeastern portion of the island, with accumulations ranging from 1 to 4 inches and the heaviest accumulations observed in the mountainous tropical rainforest region of the El Yunque National Forest.
A slowly-deepening drought continues to grip the Virgin Islands. On top of earlier deficits, only about half of normal has fallen in December. All locations were downgraded last week, so there is no change in the drought designations: St. John, D1sl (just s last week); St. Thomas, D2sl; and St. Croix, D3sl. Tropical disturbances brought above-normal rainfall during the first half of October, but conditions dried out later in the month, and well-below-normal rainfall was observed for the past 4 months (mid-August to mid-December 2021). During this period, 16.62 inches of rain fell on St. John (71 percent of normal) while near-record low totals of 9.16 inches on St. Thomas (44 percent of normal) and 8.05 inches on St. Croix (43 percent of normal). This 4-month period is a wetter time of the year in the Virgin Islands, typically bringing almost half of the annual precipitation total. Climatologically, the next 8 months also bring about half of the annual rainfall, which means monthly totals average half as much as during mid-August through mid-December. This climatological drop in typical rainfall amounts means the accumulated deficits can only slowly improve, if at all, through the first half of 2022.
On all three monitored sites, longer-term rainfall deficits are also in place. On St. John (D1), longer-term rainfall totals are unfavorably low, but are not unprecedented with several years on record looking drier. For all but the last two weeks of 2021 (January through mid-December), 36.03 inches of rain was recorded – about 79 percent of normal (9.5 inches below normal).
On St. Thomas (D2), deficits are larger and date back a little longer. From December 1, 2020 to December 14, 2021, St. Thomas reported 29.66 inches of rain – about 70 percent of normal (12.62 inches below normal).
St. Croix (D3) reports the longest-lived deficits on the Virgin Islands. Subnormal precipitation dates back to at least summer 2020. For June 1, 2020 – December 14, 2021 (17.5 months), St. Croix reports 42.9 inches of rain where normally over 67 inches would fall. So the roughly 1.5-year period brought two feet (24.56 inches) less rainfall than normal, or 64 percent of normal.
Pacific
In the Hawaiian Islands, one-category improvements in all drought categories were made on this week’s map in response to heavy rainfall accumulations associated with the strong Kona Low that developed northwest of the island chain last week. The highest rainfall accumulations were observed on the southeastern portions of the Big Island, south and west-facing slopes on Haleakala, and across Oahu. The 3-day rainfall totals in these areas ranged from 5 to 14 inches.
In Alaska, no changes were made on the map this week and the state remained drought-free. According the NRCS SNOTEL network, most of the basins were reporting above-normal SWE (Dec 14) including Koyukuk River (130% of median), Beaver Creek-Yukon River (109%), Tanana River (117%), Copper River (110%), Knik Arm (151%), Prince William Sound (120%), Kenai Peninsula (151%), Northern Southeast Alaska (209%), and Central Southeast Alaska (209%). Conversely, below-normal SWE was reported in the Noatak River-Lisburne Peninsula (87%), Susitna River (37%), and White River-Yukon (50%).
The Drought Monitor valid December 14, 2021 for the U.S. Affiliated Islands looks much like it has since November 9. Only Kapingamarangi, in the southern reaches of Micronesia, is being affected by drought. No dryness or drought can be found elsewhere, i.e., the rest of Micronesia, Palau, The Mariana Islands, The Marshall Islands, and American Samoa.
In Kapingamarangi, drought is operating on both long- and short-term time scales over the last couple of years. D0 was first introduced May 26, 2020, and moderate drought emerged June 16, 2020. The island remained in some degree of drought for 47 weeks, including D4 (exceptional drought, the worst classification) for 14 weeks from October 13, 2020 to January 19, 2021. The drought led to decreasing water supplies, and eventually potable water had to be imported from other islands. Rainfall became a little less scarce in late January, and progressively increased for the next few months. Kapingamarangi emerged from drought May 11, 2021, and D0 conditions were removed June 22, 2021.
However, another period of deficient rainfall began in late summer. Abnormal dryness (D0) was re-introduced August 10, 2021, and the island again slid back into drought (D1+) on September 14, 2021. This second episode of drought has persisted for 14 weeks so far, including the current week. Potable water imports have continued, and a major effort by several governmental and non-governmental agencies is underway to allow Kapingamarangi to catch more rainfall and increase storage capacity. Conditions intensified to D3 (extreme drought) November 23 and persisted through December 7.
But rainfall has increased since the start of December, and through mid-month, 7.14 inches have fallen. This two-week total exceeds the sum of the previous two months by 40 percent and is over half the total of the last four months. August – November 2021 brought just 13.36 inches of rain, which is less than 36 percent of normal for the roughly 17-week period. Adding the last two weeks into the equation, August 1 – December 14 totaled 20.50 inches, which is almost 49 percent of normal for the past 19 weeks. The improved short-term rainfall deficits prompted an improvement to D2 (severe drought) after three weeks of D3. But with August through mid-December rainfall still below half of normal, and a continuing effort to improve a serious water shortage, drought is far from over.
Over the rest of the USAPI, some locations have experienced somewhat below-normal rainfall for much of the past few months, but even where mild shortages exist, rainfall has been sufficient to meet water demand.
In Palau, less than an inch of rain fell last week, but with heavy rainfall the prior week, a total of 8.61 inches of rain accumulated during the first half of December. The 7.95 inches in November was about two-thirds of normal, but an impressive total of almost 47 inches was measured for September – October, which is almost twice normal.
Guam reported 3.77 inches for the first half of December, which is about an inch above normal. November precipitation was unremarkable, but the August – September total exceeded 56 inches, over a foot above the normal. Similarly, Saipan recorded 2.6 inches of rain for December 1 – 14, not quite an inch above normal. Over the prior three to four months, precipitation has been marginally below normal (about 90 percent), and the total of over 30 inches was more than enough to meet natural and human water demand.
North of drought-plagued Kapingamarangi, the Micronesian islands from Yap and Ulithi to Pohnpei, Pingelap, and Kosrae over 1700 miles to the east, weekly rainfall was variable, but longer-term totals dating back several months have been sufficient to meet or exceed water demand. Daily rainfall reports were missing from 2 to 4 days this week across Micronesia, but reported totals ranged from less than 0.5 inch in Lukunoch and Pingelap to almost 5.5 inches at Yap and Chuuk. For the first half of December, amounts ranged from 2.47 inches at Ulithi (70 percent of normal) to 11.62 inches in Chuuk (more than twice normal). For the last 3.5 months (September – mid-December), despite some marginally below-normal rainfall at a few sites, rainfall has met or exceeded water demand throughout central and northern Micronesia. Amounts in Yap, Lukunoch, and Pingelap have totaled nominally below normal (87 to 96 percent of normal). These locations reported 35 to 41 inches for the period. Rainfall was normal to above-normal elsewhere. Pohnpei, Kosrae, and Ulithi have received slightly more than normal rainfall (36 inches at Ulithi, 56 inches at Kosrae, and 53 inches at Pohnpei), and Chuuk has seen rainfall totals of 56 inches, almost 40 percent above normal. No hint of dryness anywhere in central and northern Micronesia.
Farther east, across the Marshall Islands, only Wotje comes close to a D0 designation. The 7-month period December 2020 – June 2021 brought only 15.82 inches to Wotje, roughly 64 percent of the normal (24.75 inches). With monthly totals of 3.5 inches or less, rainfall each month was falling short of equaling water demand. Amounts increased over the next few months, with July – October bringing a near-normal 25.58 inches of rain. Rainfall continued to increase in November 2021, which was the wettest month since the prior November, featuring 9.28 inches of rain, or about 20 percent above normal. So far in December, 2.55 inches have fallen, which is slightly above normal. With the increased rainfall since summer 2021, any impacts from earlier moisture deficits have been mitigated.
Elsewhere in the Marshall Islands, May – August brought monthly amounts near to below normal. Most significantly, Ailinglapalap reported 15 inches of rain for the 4-month period, when over 43 inches would typically fall. But impacts from this significant lack of rainfall were appeased in autumn, when a there was a substantial uptick in rainfall. The 3-months September – November brought nearly 43 inches of rain, about 8 inches more than normal. Despite the longer-term deficit remaining, the last few months has squelched any impacts from the earlier dryness. Impacts from subnormal rain are even less likely in the rest of the Marshall Islands. Near- to above-normal rainfall has prevailed since September, and well-above-normal amounts of 11.5 to 20.3 inches were widespread in November.
South of the equator, American Samoa saw below-normal rainfall for 6 of the 8 months March – October. September and October were particularly dry, with only 7.71 inches dampening Pago Pago, where normals approach 18 inches for the period. But as in many other places, Any potential dryness was quelled by more recent rainfall. November through mid-December, a near-normal total of about 16 inches was reported. While below normal as a whole, enough rain fell summer and autumn to meet water demands, with no dryness-related impacts reported, buoyed by higher totals later in the period.
Looking Ahead
The NWS WPC 7-Day Quantitative Precipitation Forecast (QPF) calls for moderate-to-heavy liquid (liquid = rain + SWE) precipitation accumulations ranging from 2 to 5 inches in an area extending from Northern California to Washington state. Similar accumulations are forecasted In the Sierra Nevada Range, Cascade Range, and Olympic Mountains. In the Intermountain West, 1-to-2-inch (liquid) accumulations are expected across the Central and Northern Rockies. Elsewhere, 1-to-5-inch (liquid) accumulations are expected in far southeastern portions of the Southern Plains as well as in the Lower Mississippi, Tennessee, and Ohio River valleys. Along the Eastern Seaboard, light accumulations of generally <1 inch are expected in New England while most of the Mid-Atlantic and Southeast will continue to be generally dry. The CPC 6-10-day Outlooks calls for a moderate-to-high probability of above-normal temperatures across the southern half of the conterminous United States excluding California and Nevada. Below-normal temperatures are expected across the remainder of the West including the Pacific Northwest and the Northern Rockies. In terms of precipitation, the wetter-than-normal pattern is expected to persist across the western U.S., while there is a low-to-moderate probability of below-normal precipitation across the Central and Northern Plains as well as across most of the South. In the eastern third, near-normal precipitation is expected.
Author(s):
David Simeral, Western Regional Climate Center
Richard Tinker, NOAA/NWS/NCEP/CPC
Dryness Categories
D0 Abnormally Dry—used for areas showing dryness but not yet in drought, or for areas recovering from drought.
Drought Intensity Categories
D1 Moderate Drought
D2 Severe Drought
D3 Extreme Drought
D4 Exceptional Drought
Drought or Dryness Types
S Short-term, typically less than 6 months (agriculture, grasslands)
L Long-term, typically more than 6 months (hydrology, ecology)
SL Area contains both short- and long-term impacts
Source: National Drought Mitigation Center
