


IMPORTANT NOTE: The employment data for the month of November 2021 is taken from the survey week including November 12. Data for the month of December is scheduled for release on Jan. 21, 2022.
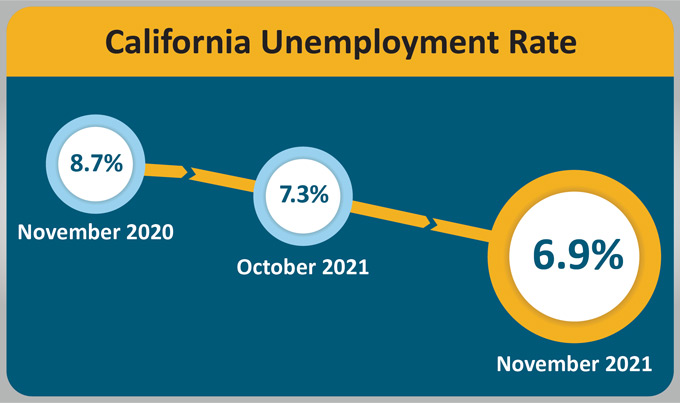
December 17, 2021 - SACRAMENTO – California’s unemployment rate dropped to 6.9 percent1 in November as the state’s employers added 45,700 non-farm payroll jobs2 to the economy, according to data released today by the California Employment Development Department (EDD) from two surveys. Thanks to November’s job growth, the state has now regained 1,889,000, or nearly 70 percent, of the 2,714,800 jobs that were lost in March and April 2020 due to the COVID-19 pandemic.

California’s Labor Market, by the Numbers...
- Since February 2021, California has added 977,200 total nonfarm jobs, which averages out to be a gain of 97,720 jobs per month for that time period.
- California’s November 2021 gain of 45,700 nonfarm jobs accounted for nearly 22 percent of the nation’s 210,000 overall jobs gain for the month.
- Eight of California’s 11 industry sectors gained jobs in November with Professional & Business Services (+18,800) leading the way due to large gains in Professional, Scientific, and Technical Services thanks, in part, to increases in Scientific Research & Development Services and Computer Systems Design & Related Services.
- Educational & Health Services (+9,500) also showed good month-over job gains thanks to strength in Ambulatory Health Care Services and Educational Services.
- Construction’s sizable loss (-1,700) was largely due to reductions in Specialty Trade Contractors.
1. The unemployment rate comes from a separate federal survey of 5,100 California households.
2. The nonfarm payroll job numbers come from a federal survey of 80,000 California businesses.
Data Trends about Jobs in the Economy
Total Nonfarm Payroll Jobs
This comes from a monthly survey of approximately 80,000 California businesses that estimates jobs in the economy – seasonally adjusted.
- Month-over – Total nonfarm jobs in California’s 11 major industries totaled 16,835,100 in November – a net gain of 45,700 jobs since October 2021. This followed an upward revised (+14,800) month-over gain of 111,600 jobs in October.
- Year-over – Total nonfarm jobs increased by 821,800 (a 5.1 percent increase) from November 2020 to November 2021 compared to the U.S. annual gain of 5,802,000 jobs (a 4.1 percent increase).

Total Farm jobs – The number of jobs in the agriculture industry increased by 17,000 from October 2021 to 433,500 jobs in November. The agricultural industry has 19,800 more farm jobs in November 2021 than it did in November a year ago.
Data Trends about Workers in the Economy
Employment and Unemployment in California
This information is based on a monthly federal survey of 5,100 California households which focuses on workers in the economy.
- Employed – The number of Californians employed in November was 17,719,400, an increase of 79,900 persons from October’s total of 17,639,500, and up 735,500 from the employment total in November of last year.
- Unemployed – The number of unemployed Californians was 1,321,300 in November, a decrease of 61,900 over the month and down 299,400 in comparison to November of last year.

Unemployment Insurance Claims (Not Seasonally Adjusted)
The following data is from a sample week that includes the 19th of each month:
In related data that figures into the state’s unemployment rate, there were 434,676 people certifying for Unemployment Insurance benefits during the November 2021 sample week. That compares to 463,257 people in October and 1,278,220 people in November 2020. Concurrently, 52,716 initial claims were processed in the November 2021 sample week, which was a month-over decrease of 7,163 claims from October and a year-over decrease of 116,272 claims from November 2020.

| COUNTY | LABOR FORCE | EMPLOYMENT | UNEMPLOYMENT | RATE |
|---|---|---|---|---|
| STATE TOTAL | 19,178,900 | 18,138,400 | 1,040,500 | 5.4% |
| ALAMEDA | 813,300 | 778,800 | 34,600 | 4.3% |
| ALPINE | 500 | 460 | 30 | 6.5% |
| AMADOR | 14,630 | 13,890 | 740 | 5.1% |
| BUTTE | 94,000 | 89,400 | 4,600 | 4.9% |
| CALAVERAS | 21,500 | 20,610 | 900 | 4.2% |
| COLUSA | 10,630 | 9,530 | 1,100 | 10.3% |
| CONTRA COSTA | 542,600 | 517,800 | 24,800 | 4.6% |
| DEL NORTE | 9,250 | 8,740 | 520 | 5.6% |
| EL DORADO | 92,000 | 88,300 | 3,800 | 4.1% |
| FRESNO | 445,100 | 413,800 | 31,300 | 7.0% |
| GLENN | 12,500 | 11,870 | 630 | 5.1% |
| HUMBOLDT | 60,600 | 58,000 | 2,600 | 4.3% |
| IMPERIAL | 68,000 | 57,500 | 10,500 | 15.5% |
| INYO | 8,190 | 7,840 | 350 | 4.3% |
| KERN | 388,800 | 360,100 | 28,700 | 7.4% |
| KINGS | 55,800 | 51,800 | 4,100 | 7.3% |
| LAKE | 28,340 | 26,690 | 1,650 | 5.8% |
| LASSEN | 10,040 | 9,650 | 390 | 3.8% |
| LOS ANGELES | 5,084,300 | 4,722,100 | 362,200 | 7.1% |
| MADERA | 61,100 | 57,000 | 4,100 | 6.7% |
| MARIN | 134,700 | 130,700 | 3,900 | 2.9% |
| MARIPOSA | 7,170 | 6,770 | 400 | 5.5% |
| MENDOCINO | 36,400 | 34,670 | 1,730 | 4.7% |
| MERCED | 114,800 | 106,000 | 8,800 | 7.6% |
| MODOC | 3,330 | 3,170 | 150 | 4.6% |
| MONO | 7,900 | 7,490 | 410 | 5.2% |
| MONTEREY | 217,100 | 205,100 | 12,000 | 5.5% |
| NAPA | 68,600 | 65,700 | 2,900 | 4.2% |
| NEVADA | 47,860 | 45,970 | 1,890 | 3.9% |
| ORANGE | 1,593,300 | 1,528,500 | 64,700 | 4.1% |
| PLACER | 188,100 | 181,500 | 6,600 | 3.5% |
| PLUMAS | 7,400 | 6,880 | 520 | 7.0% |
| RIVERSIDE | 1,131,100 | 1,070,000 | 61,100 | 5.4% |
| SACRAMENTO | 715,700 | 679,200 | 36,500 | 5.1% |
| SAN BENITO | 31,700 | 29,900 | 1,700 | 5.4% |
| SAN BERNARDINO | 993,200 | 938,800 | 54,400 | 5.5% |
| SAN DIEGO | 1,563,700 | 1,492,400 | 71,300 | 4.6% |
| SAN FRANCISCO | 565,600 | 546,800 | 18,800 | 3.3% |
| SAN JOAQUIN | 330,100 | 308,500 | 21,700 | 6.6% |
| SAN LUIS OBISPO | 133,700 | 128,800 | 4,900 | 3.6% |
| SAN MATEO | 445,000 | 431,300 | 13,600 | 3.1% |
| SANTA BARBARA | 220,600 | 212,000 | 8,600 | 3.9% |
| SANTA CLARA | 1,037,100 | 1,004,200 | 32,900 | 3.2% |
| SANTA CRUZ | 133,100 | 126,600 | 6,600 | 4.9% |
| SHASTA | 75,000 | 71,300 | 3,700 | 4.9% |
| SIERRA | 1,360 | 1,300 | 60 | 4.1% |
| SISKIYOU | 16,940 | 15,970 | 970 | 5.7% |
| SOLANO | 202,700 | 191,700 | 11,000 | 5.4% |
| SONOMA | 247,600 | 238,400 | 9,200 | 3.7% |
| STANISLAUS | 241,300 | 226,400 | 14,900 | 6.2% |
| SUTTER | 45,700 | 42,600 | 3,100 | 6.7% |
| TEHAMA | 25,910 | 24,580 | 1,330 | 5.1% |
| TRINITY | 4,520 | 4,320 | 200 | 4.4% |
| TULARE | 200,300 | 183,800 | 16,500 | 8.2% |
| TUOLUMNE | 19,610 | 18,540 | 1,070 | 5.4% |
| VENTURA | 412,300 | 394,000 | 18,300 | 4.4% |
| YOLO | 106,800 | 102,200 | 4,500 | 4.3% |
| YUBA | 30,400 | 28,500 | 1,900 | 6.4% |
Source: EDD
