


January 2022 La Niña update: family game night
January 16, 2022 - By Emily Becker - Happy new year! This La Niña event is likely near peak strength as we start 2022. Related impacts to global weather and climate will continue through the rest of winter and into the spring, however, because climate impacts lag tropical Pacific sea surface temperature changes. Forecasters favor a transition to neutral in the April–June period.
Chutes and Ladders
The sea surface temperature in the Niño-3.4 region of the tropical Pacific—our primary measurement of the El Niño/Southern Oscillation (ENSO) system—was 1.1° C cooler than the 1991–2020 average in December, via the ERSSTv5 observation dataset.
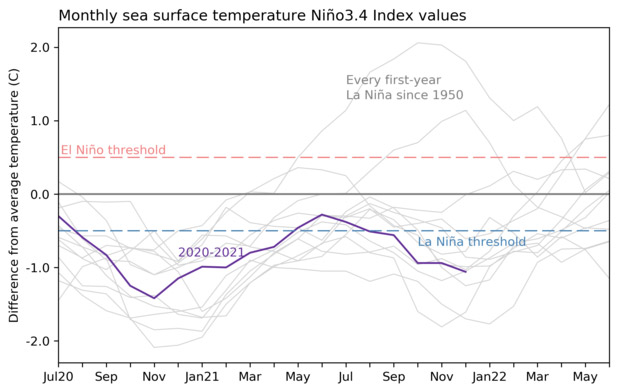
Monthly sea surface temperature anomalies (difference from average) in the Niño 3.4 region of the tropical Pacific for 2020-21 (purple line) and all other years (gray lines) starting from first-year La Niña winters since 1950. Climate.gov graph based on ERSSTv5 temperature data.
The three-month temperature deviation from average in Niño-3.4, the Oceanic Niño Index, for October–December was -1.0° C. This marks the fourth three-month period (“season” in climate prediction parlance) in a row with an index more than 0.5° C cooler than the long-term average. It takes five seasons in a row to qualify as an official El Niño or La Niña event and get colored red or blue in the historical events table. It’s certain that this event will qualify—forecasters give the December–February period a 100% chance of being in La Niña territory, and 95% likelihood for January–March.
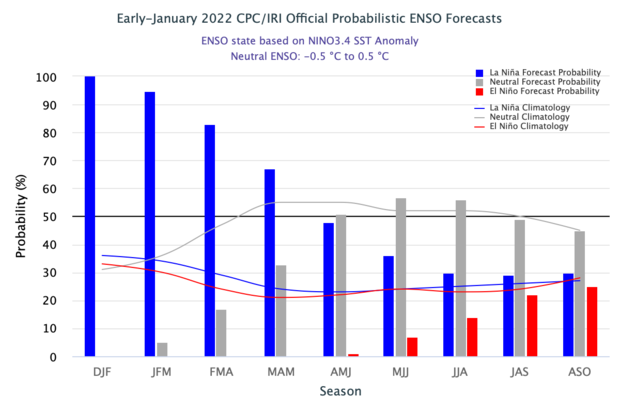
The official CPC/IRI ENSO probability forecast. The bars show the seasonal chances for each possible ENSO state—El Niño (red), La Niña (blue), and neutral (gray) from winter 2022 through fall 2022. The forecast is based on a consensus of CPC and IRI forecasters, and it is updated during the first half of the month, in association with the official CPC/IRI ENSO Diagnostic Discussion. It is based on observational and predictive information from early in the month and from the previous month. Image from IRI.
Why five seasons? Because, when they needed come up with an official ENSO definition, an international committee of ENSO experts argued that we need equatorial Pacific sea surface temperature anomalies to persist for this duration in order to ensure that the atmosphere and ocean in the ENSO system are truly coupled (supported by a variety of atmospheric and ocean indexes). A persistent, coupled tropical Pacific also makes it more likely that ENSO can modify global weather and climate patterns too.
Atmospheric conditions in the tropical Pacific region also reflected La Niña in December, with evidence of a strengthened Walker circulation. La Niña’s cooler-than-average central/eastern equatorial Pacific enhances the normal warm-west/cool-east temperature gradient, so the atmospheric response is an enhanced version of the normal circulation pattern. This means more rising air and clouds in the west, stronger west-to-east upper-level winds, drier conditions in the central Pacific, and stronger trade winds near the surface, all of which were clocked during December. The links here lead to the International Research Institute for Climate and Society’s Maproom, where you can select the month and the level in the atmosphere.
The Game of Life
So La Niña will stick around for the next few months, but what about next summer/fall? Even though we would really like to know, especially given ENSO’s effect on tropical storms, this is still really unclear. As I discussed last month, a third-year La Niña, neutral, or El Niño are all still on the table. Computer models, including those from the North American Multi-Model Ensemble, show a broad range of potential outcomes for the fall, too.
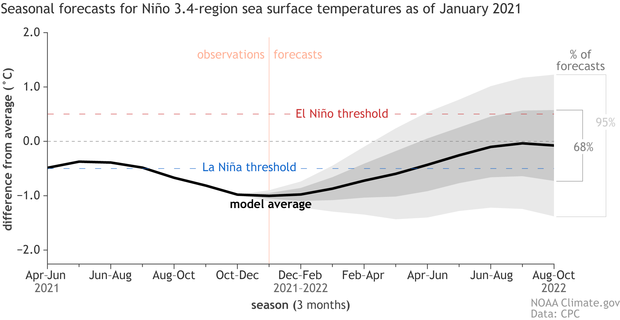
Climate model forecasts for the Niño-3.4 temperature anomalies in 2022. Average dynamical model data (black line) from the North American Multi-Model Ensemble (NMME): darker gray envelope shows the range of 68% of all model forecasts; lighter gray shows the range of 95% of all model forecasts. NOAA Climate.gov image from University of Miami data.
We’ll have to play a few more rounds to get a clearer picture of how the tropical Pacific will set up for later this year.
Trivial Pursuit
This La Niña’s effect on rain and snow patterns in North America has been pretty typical so far, with drier conditions through the south-central and southeastern U.S. and wetter over the Pacific Northwest, northern California, and the Ohio Valley over the past three months. The excess precipitation in Washington State has been in the news lately, making me curious about how this year fit into the historical context. More precipitation in the Pacific Northwest, especially more snow, is one of the more consistent La Niña impacts, as the jet stream tends to get deflected northward, bringing more storms with it.
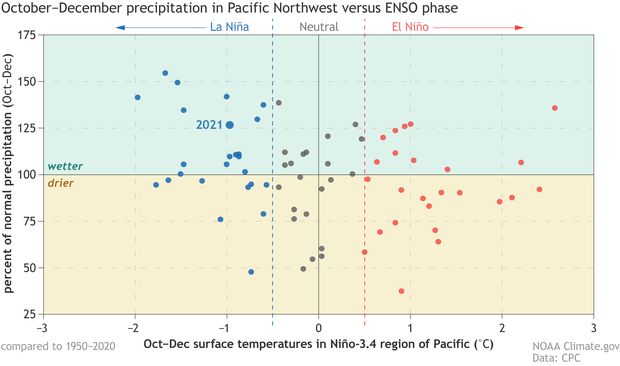
Dots show October–December precipitation in the Pacific Northwest for every year from 1950–2021, sorted by ENSO phase. The vertical axis shows the percentage of accumulated October–December precipitation relative to the 1950–2020 average. The horizontal axis shows the October–November Niño 3.4 Index, with blue dots indicating forecasts of La Niña conditions (Niño 3.4 Index less than -0.5°C), black dots indicating neutral ENSO forecasts (Niño 3.4 Index greater than -0.5°C but less than 0.5°C), and red dots indicating forecasts of El Niño conditions (Niño 3.4 Index greater than 0.5°C). In the upper left part of the graphic, you can see that the region's wettest years occurred during La Niña. Region averaged over all land gridpoints, 45°N–50°N, 120°W–125°W. Data from the Climate Prediction Center’s Unified Raingauge dataset and ERSSTv5. Figure by climate.gov.
Winters with more precipitation (I’m combining rain and snow here, with snow measured as rain-equivalent) tend to occur during La Niña, and drier winters during El Niño, although of course there are exceptions! La Niña 2021–22, a borderline moderate event so far, fits the pattern, with about 125% of average precipitation in October–December. The Pacific Northwest also has a climate-change related trend toward wetter conditions in the fall and winter. You can look at the trend and La Niña impacts side-by-side here.
Yahtzee
Speaking of the jet stream, stay tuned to the ENSO Blog for a special guest post on this topic later this month! And, of course, your trusty regular correspondents will be here to keep you updated on the forecast and all things ENSO.
A blog about monitoring and forecasting El Niño, La Niña, and their impacts.
Disclaimer:
The ENSO blog is written, edited, and moderated by Michelle L’Heureux (NOAA Climate Prediction Center), Emily Becker (University of Miami/CIMAS), Nat Johnson (NOAA Geophysical Fluid Dynamics Laboratory), and Tom DiLiberto and Rebecca Lindsey (contractors to NOAA Climate Program Office), with periodic guest contributors.
Ideas and explanations found in these posts should be attributed to the ENSO blog team, and not to NOAA (the agency) itself. These are blog posts, not official agency communications; if you quote from these posts or from the comments section, you should attribute the quoted material to the blogger or commenter, not to NOAA, CPC, or Climate.gov.
Source: ENSO blog team
