


IMPORTANT NOTE: The employment data for the month of February 2022 is taken from the survey week including February 12. Data for the month of March is scheduled for release on April 15, 2022.
Employers added 138,100 nonfarm payroll jobs
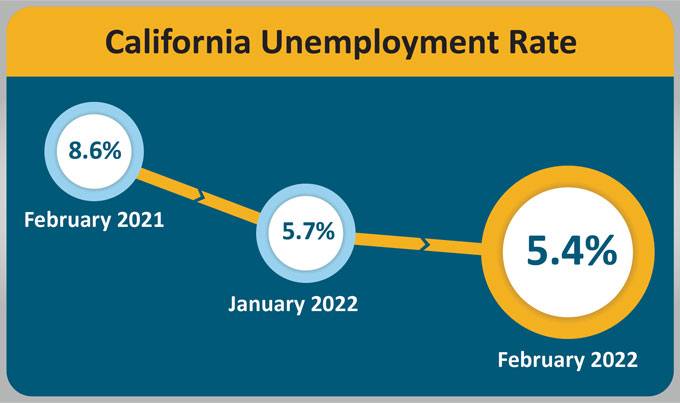
March 25, 2022 - SACRAMENTO – California’s unemployment rate went down for the month of February 2022 to 5.4 percent1 as the state’s employers added 138,100 nonfarm payroll jobs2 to the economy, according to data released today by the California Employment Development Department (EDD) from two surveys. January’s total nonfarm employment increase was revised (+6,700 jobs) to 60,300, while January’s unemployment rate was revised down to 5.7 percent.
California’s Labor Market, by the Numbers...
- California has now regained 87.2 percent (2,405,900) of the 2,758,900 nonfarm jobs lost during March and April of 2020 due to the COVID-19 pandemic.
- Of the 678,000 jobs the nation gained in February, California accounted for 20.4% of them. The state’s year-over job growth of 6.8% also outpaced the nation’s rate of 4.6%.
- California has enjoyed month-over gains in nonfarm jobs in 12 of the past 13 months, averaging roughly 101,700 jobs gained per month over that time and, year-over, ranks third in the nation in job growth behind Nevada and Hawaii.
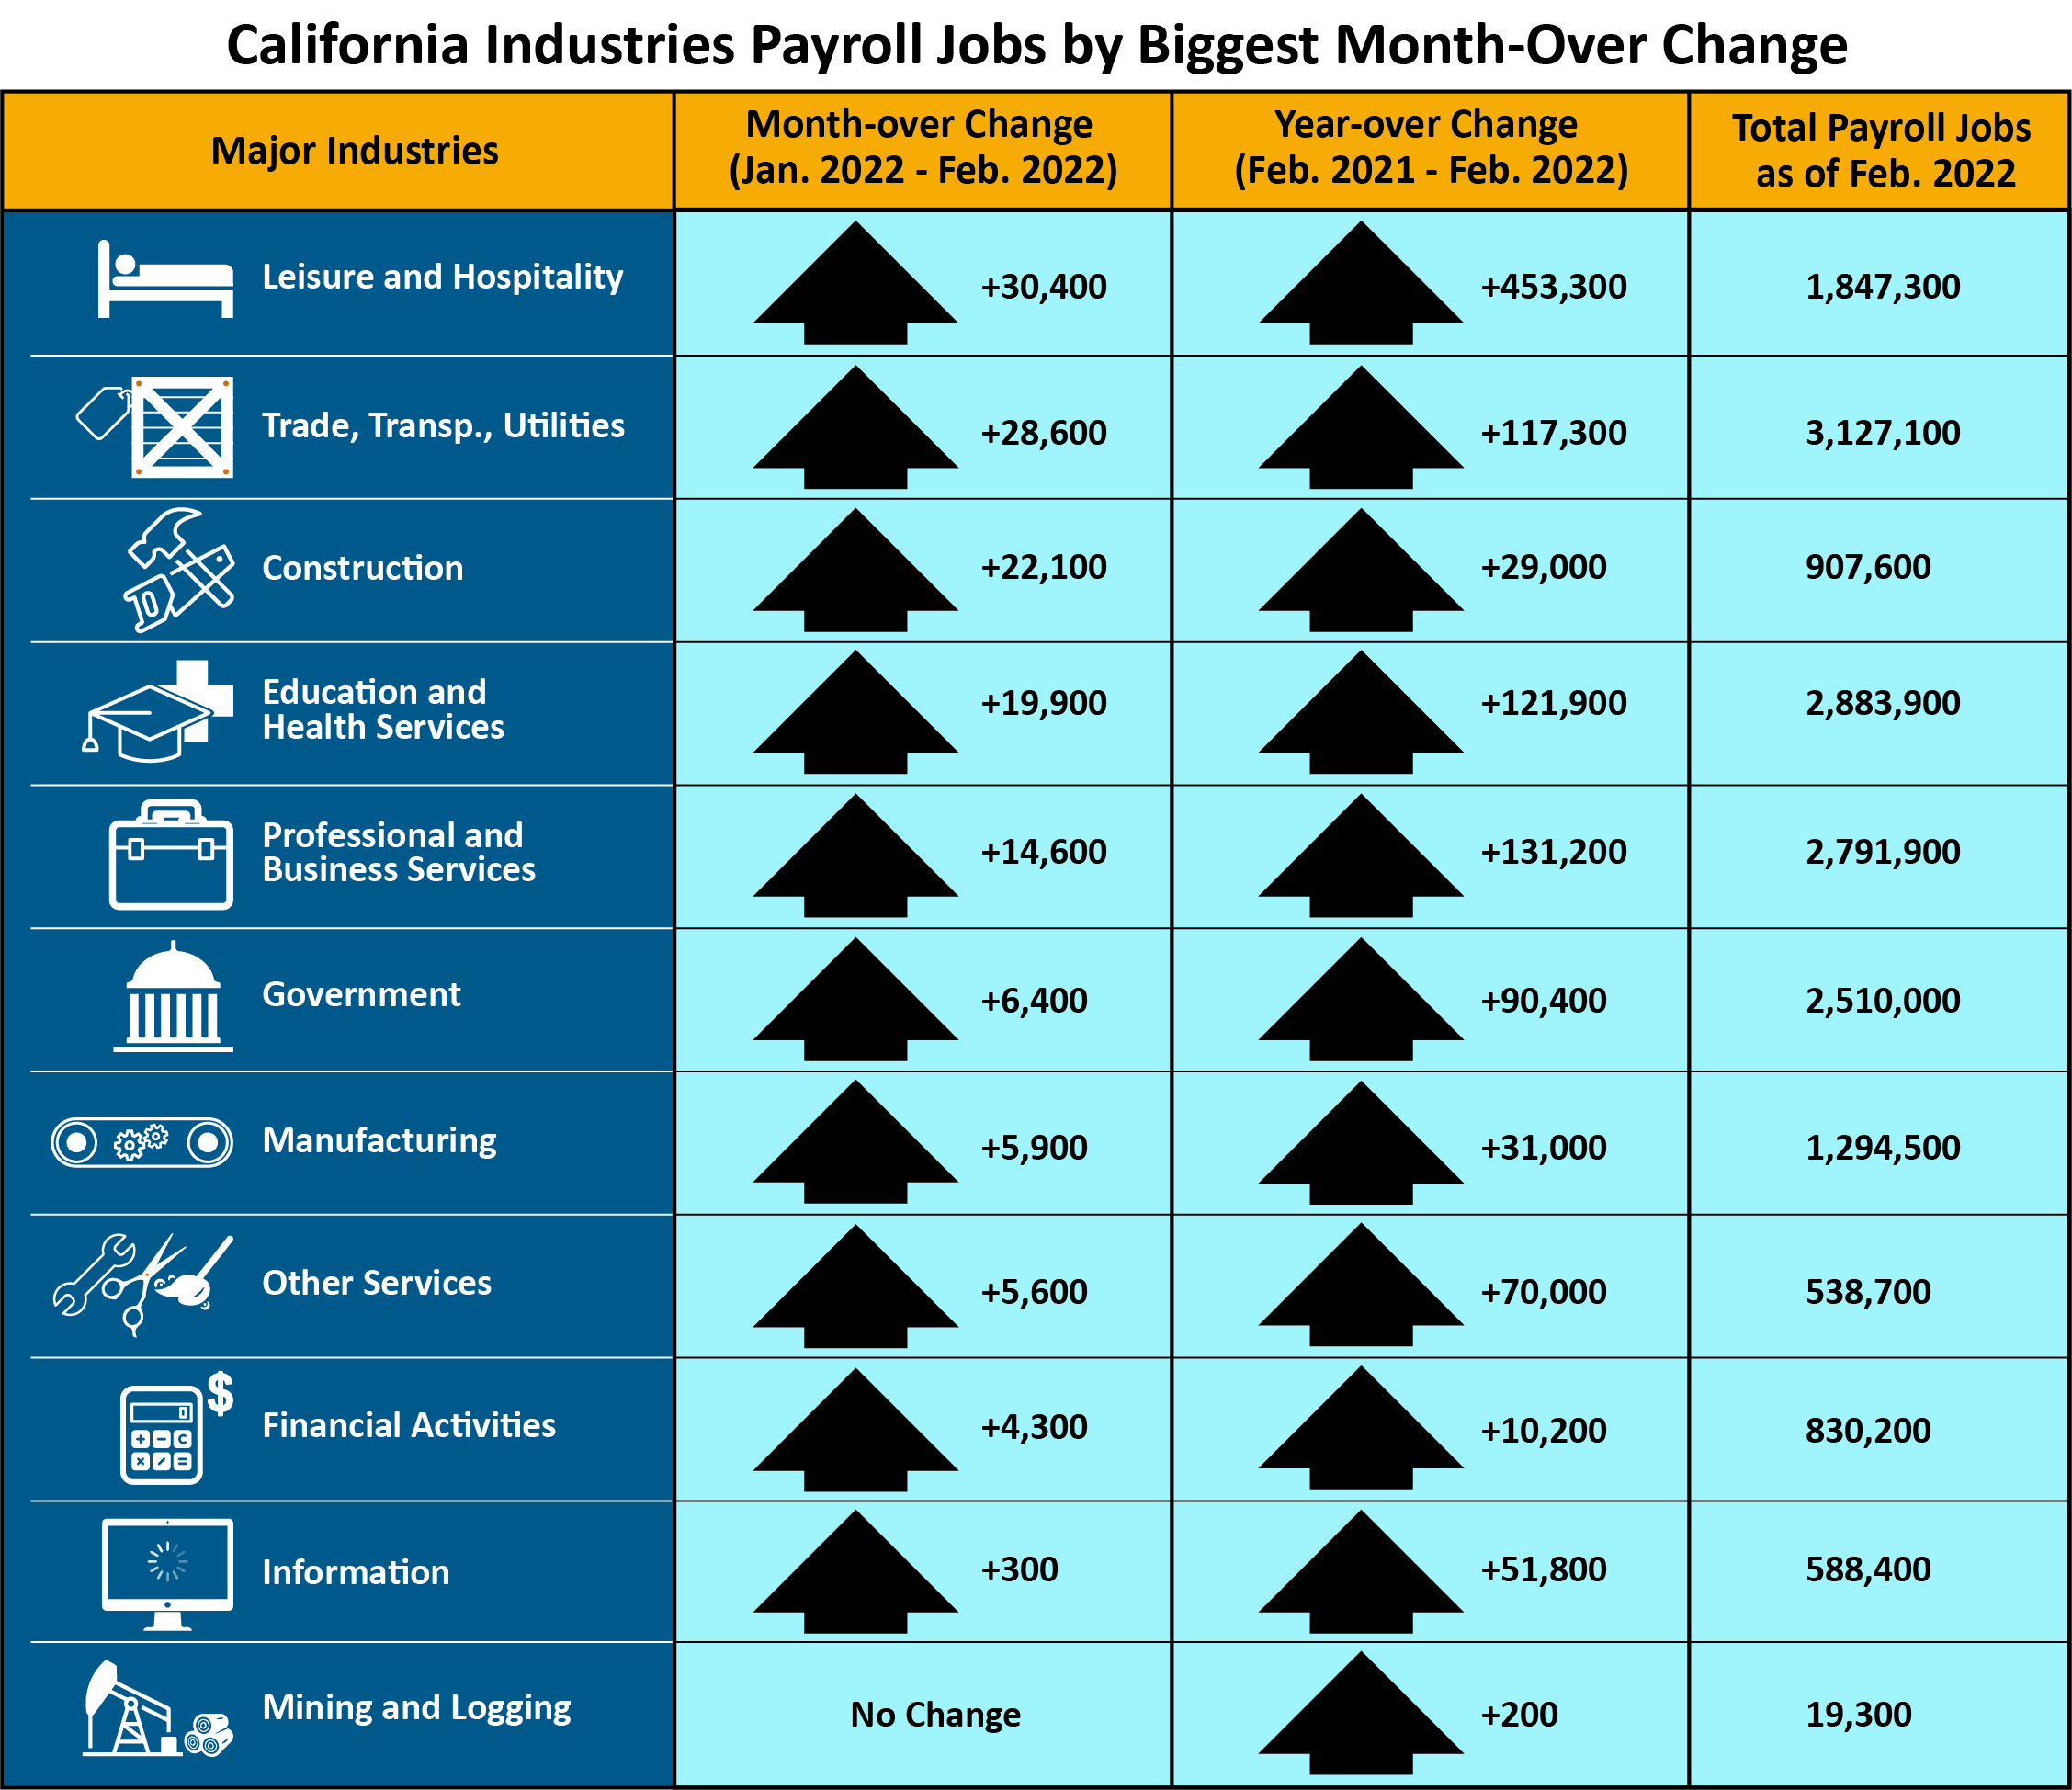
- None of California’s 11 industry sectors lost jobs in February with Leisure & Hospitality (+30,400) posting the largest increase with large gains in Limited-Service Eating Places pushing the estimate.
- Construction’s large gain (+22,100) was due, in part, to strength with Specialty Trade Contractors.
1. The nonfarm payroll job numbers come from a federal survey of 80,000 California businesses.
2. The unemployment rate comes from a separate federal survey of 5,100 California households.
Data Trends about Jobs in the Economy
Total Nonfarm Payroll Jobs
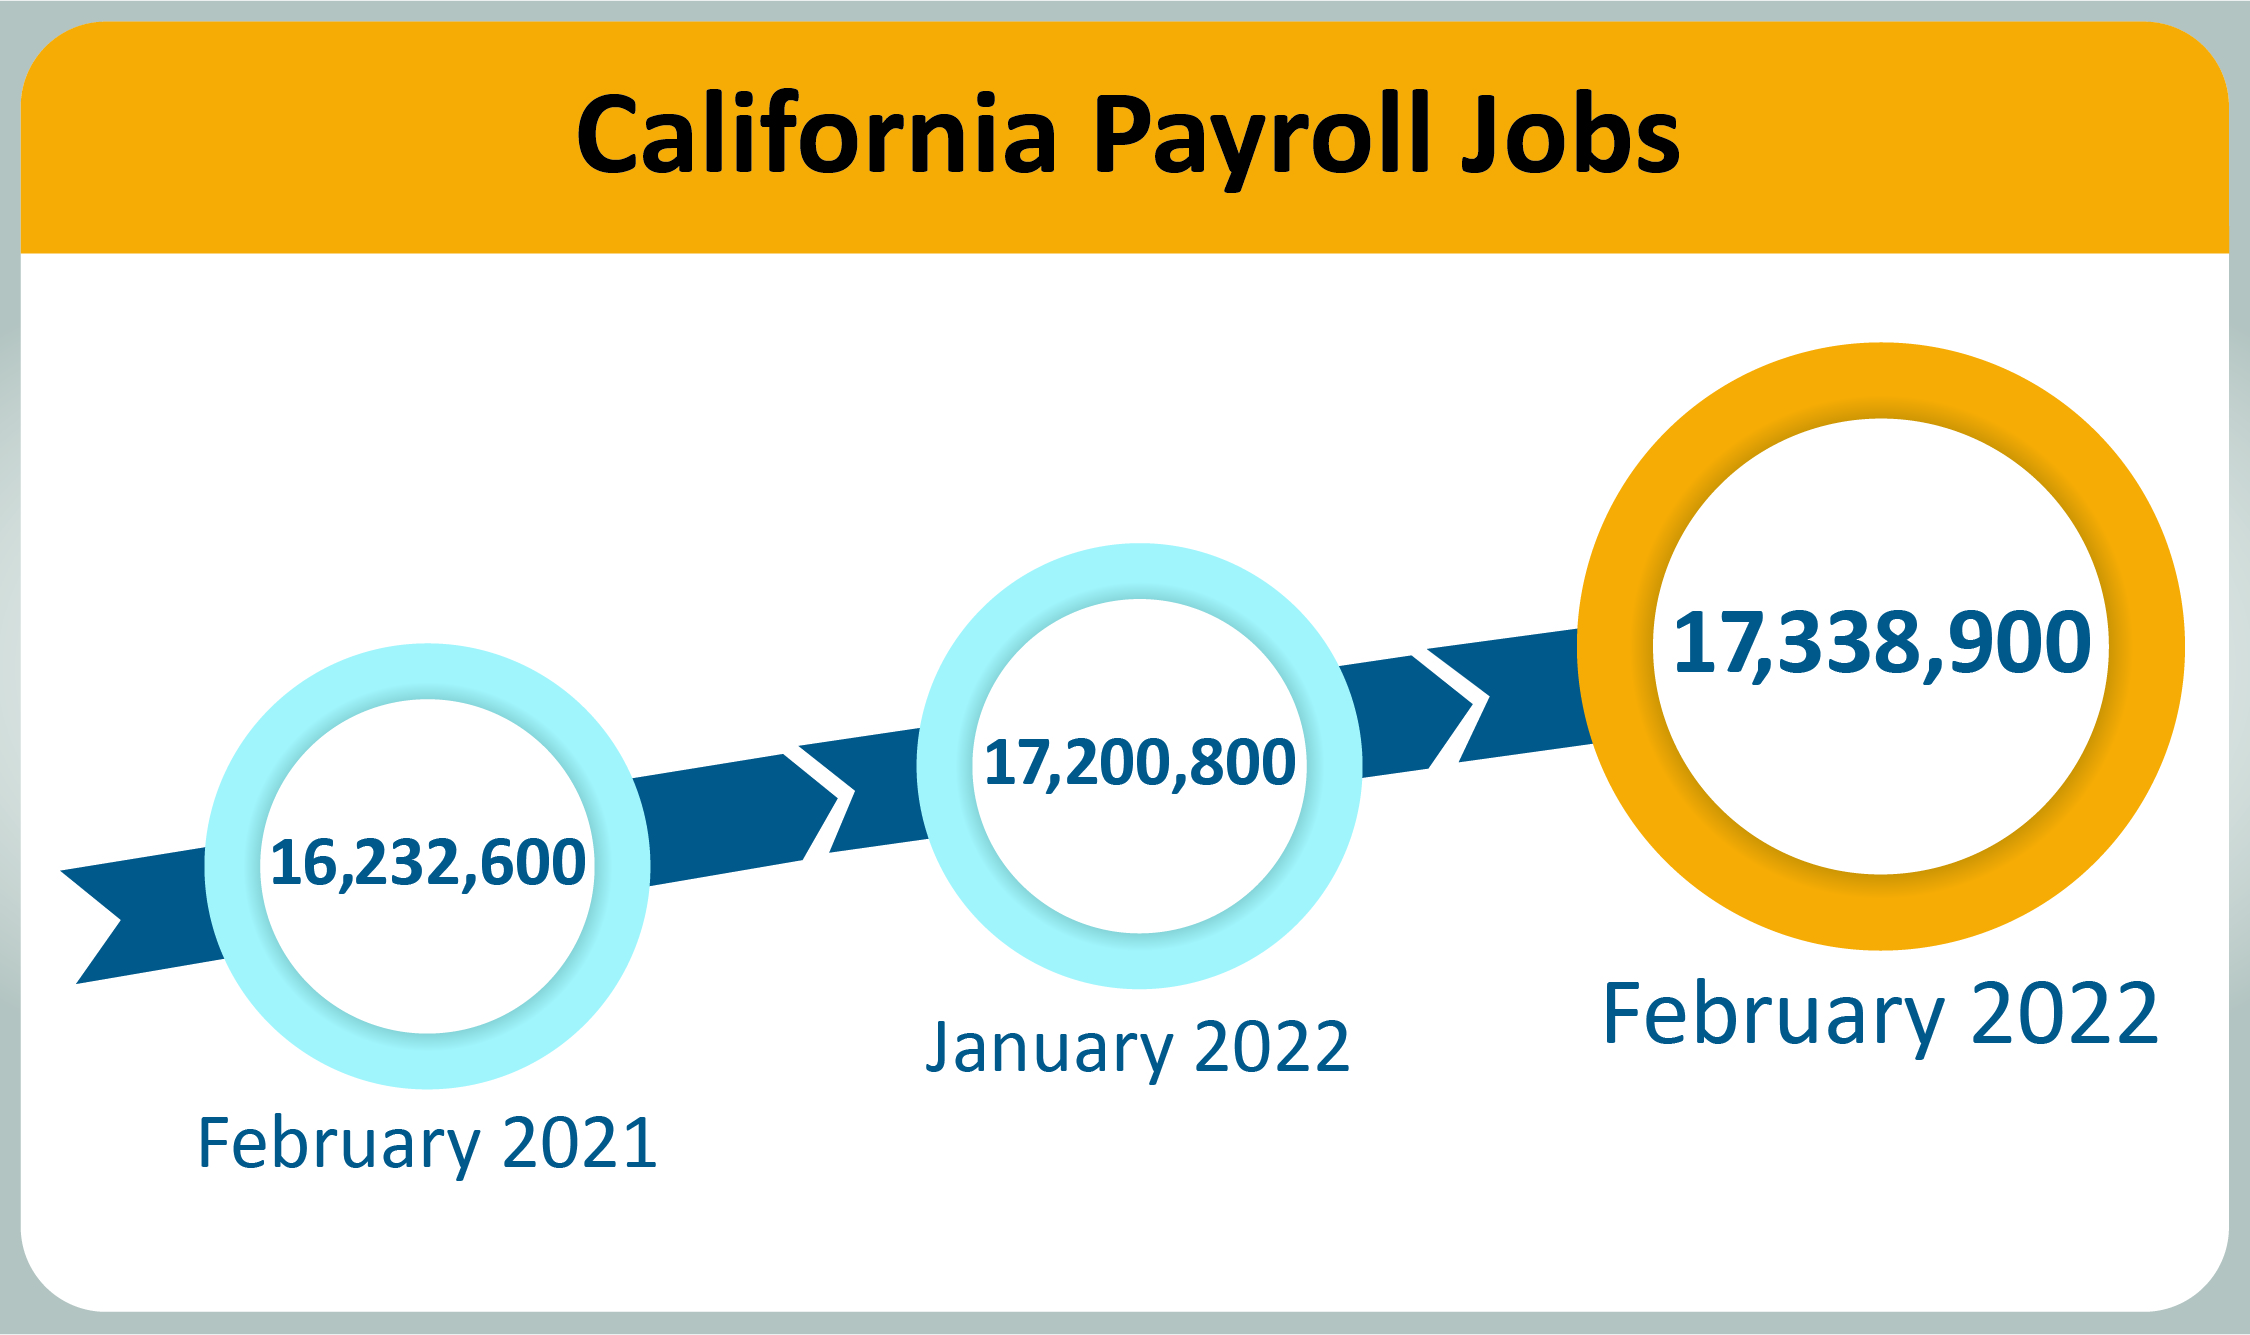
This comes from a monthly survey of approximately 80,000 California businesses that estimates jobs in the economy – seasonally adjusted.
- Month-over – Total nonfarm jobs in California’s 11 major industries totaled 17,338,900 in February – a net gain of 138,100 jobs from January. This followed an upward revised (+6,700) month-over gain of 60,300 jobs in January.
- Year-over – Total nonfarm jobs increased by 1,106,300 (a 6.8 percent increase) from February 2021 to February 2022 compared to the U.S. annual gain of 6,672,000 jobs (a 4.6 percent increase).
Total Farm jobs – The number of jobs in the agriculture industry increased by 3,500 from January to 414,500 jobs in February. The agricultural industry has 1,800 fewer farm jobs in February 2022 than it did in February a year ago.
Data Trends about Workers in the Economy
Employment and Unemployment in California
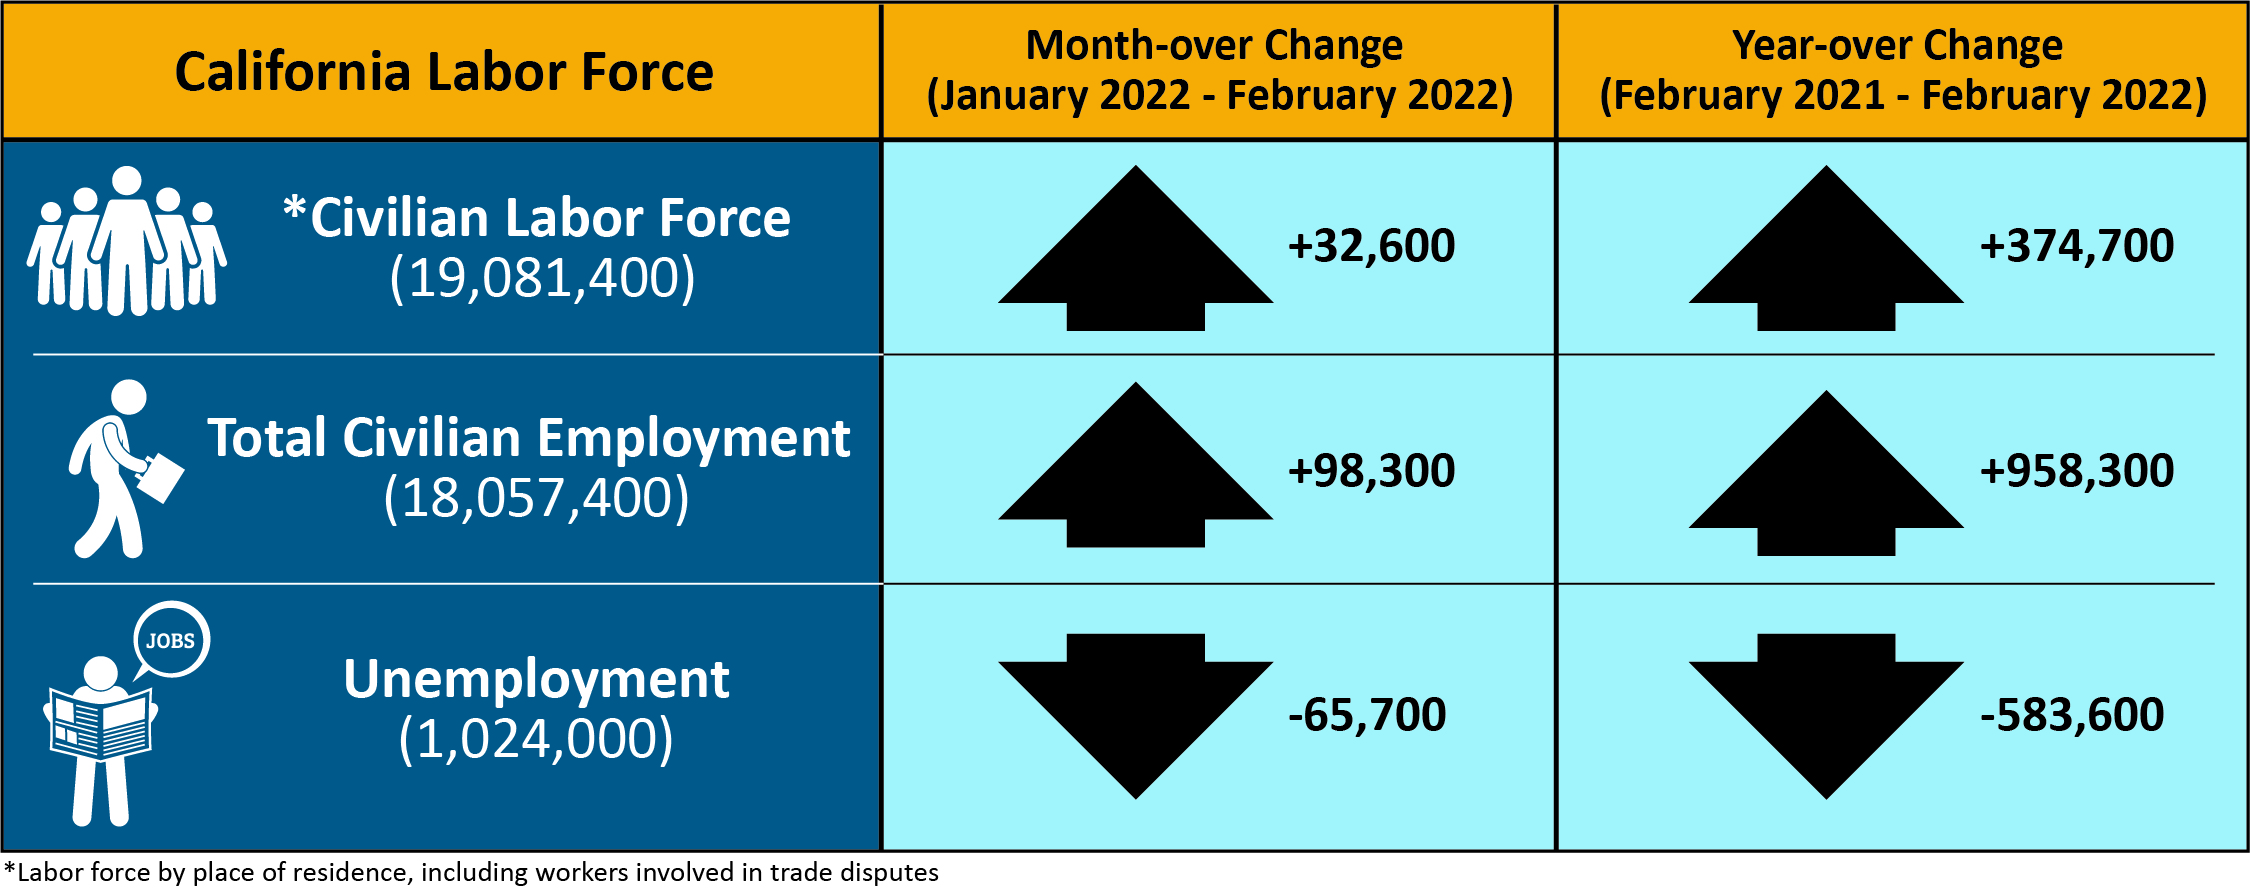
This information is based on a monthly federal survey of 5,100 California households which focuses on workers in the economy.
- Employed – The number of Californians employed in February was 18,057,400, an increase of 98,300 persons from January’s total of 17,959,100, and up 958,300 from the employment total in February 2021.
- Unemployed – The number of unemployed Californians was 1,024,000 in February, a decrease of 65,700 over the month and down 583,600 in comparison to February 2021.
Unemployment Insurance Claims (Not Seasonally Adjusted)
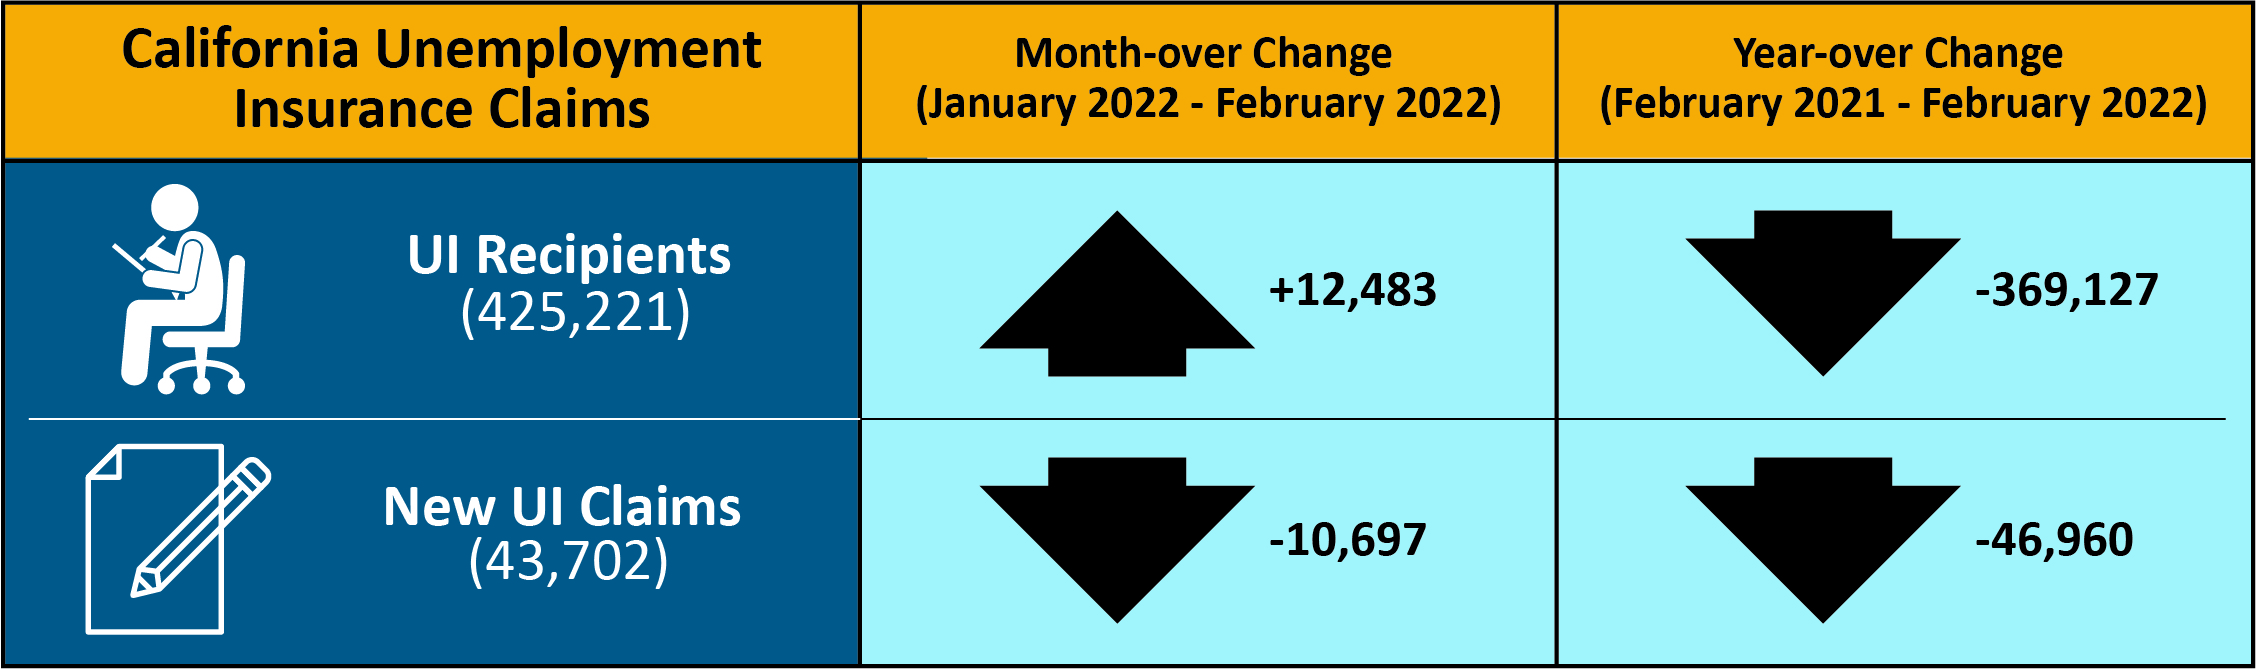
The following data is from a sample week that includes the 19th of each month: In related data that figures into the state’s unemployment rate, there were 425,221 people certifying for Unemployment Insurance benefits during the February 2022 sample week. That compares to 412,738 people in January and 794,348 people in February 2021. Concurrently, 43,702 initial claims were processed in the February 2022 sample week, which was a month-over decrease of 10,697 claims from January and a year-over decrease of 46,960 claims from February 2021.
| COUNTY | LABOR FORCE | EMPLOYMENT | UNEMPLOYMENT | RATE |
|---|---|---|---|---|
| STATE TOTAL | 19,332,300 | 18,396,400 | 935,900 | 4.8% |
| ALAMEDA | 827,700 | 796,400 | 31,300 | 3.8% |
| ALPINE | 580 | 550 | 30 | 5.8% |
| AMADOR | 14,400 | 13,660 | 740 | 5.2% |
| BUTTE | 93,200 | 88,400 | 4,700 | 5.1% |
| CALAVERAS | 21,550 | 20,670 | 870 | 4.0% |
| COLUSA | 10,820 | 9,260 | 1,570 | 14.5% |
| CONTRA COSTA | 553,700 | 531,100 | 22,700 | 4.1% |
| DEL NORTE | 9,290 | 8,760 | 530 | 5.7% |
| EL DORADO | 93,200 | 89,600 | 3,600 | 3.9% |
| FRESNO | 455,200 | 420,600 | 34,600 | 7.6% |
| GLENN | 12,730 | 11,990 | 730 | 5.8% |
| HUMBOLDT | 59,600 | 57,000 | 2,500 | 4.2% |
| IMPERIAL | 70,500 | 60,600 | 9,900 | 14.0% |
| INYO | 8,260 | 7,910 | 350 | 4.3% |
| KERN | 389,200 | 356,900 | 32,300 | 8.3% |
| KINGS | 57,300 | 52,400 | 4,800 | 8.5% |
| LAKE | 28,520 | 26,850 | 1,670 | 5.9% |
| LASSEN | 8,850 | 8,400 | 450 | 5.1% |
| LOS ANGELES | 5,081,500 | 4,809,500 | 272,000 | 5.4% |
| MADERA | 64,500 | 59,900 | 4,600 | 7.1% |
| MARIN | 130,800 | 127,200 | 3,600 | 2.8% |
| MARIPOSA | 6,360 | 5,950 | 410 | 6.5% |
| MENDOCINO | 37,430 | 35,720 | 1,710 | 4.6% |
| MERCED | 116,400 | 105,600 | 10,800 | 9.3% |
| MODOC | 3,140 | 2,910 | 220 | 7.1% |
| MONO | 9,520 | 9,130 | 390 | 4.1% |
| MONTEREY | 207,100 | 188,900 | 18,200 | 8.8% |
| NAPA | 69,800 | 67,100 | 2,700 | 3.9% |
| NEVADA | 47,930 | 46,070 | 1,860 | 3.9% |
| ORANGE | 1,589,000 | 1,530,900 | 58,100 | 3.7% |
| PLACER | 192,700 | 186,500 | 6,200 | 3.2% |
| PLUMAS | 6,850 | 6,170 | 680 | 9.9% |
| RIVERSIDE | 1,163,800 | 1,106,400 | 57,400 | 4.9% |
| SACRAMENTO | 727,400 | 693,300 | 34,100 | 4.7% |
| SAN BENITO | 32,700 | 30,700 | 2,000 | 6.1% |
| SAN BERNARDINO | 1,018,800 | 967,700 | 51,100 | 5.0% |
| SAN DIEGO | 1,586,900 | 1,522,800 | 64,100 | 4.0% |
| SAN FRANCISCO | 568,100 | 551,200 | 16,900 | 3.0% |
| SAN JOAQUIN | 337,300 | 315,200 | 22,100 | 6.6% |
| SAN LUIS OBISPO | 137,800 | 133,200 | 4,500 | 3.3% |
| SAN MATEO | 449,300 | 437,100 | 12,100 | 2.7% |
| SANTA BARBARA | 219,800 | 210,500 | 9,300 | 4.3% |
| SANTA CLARA | 1,040,800 | 1,011,000 | 29,900 | 2.9% |
| SANTA CRUZ | 134,300 | 126,200 | 8,100 | 6.0% |
| SHASTA | 73,700 | 69,800 | 3,900 | 5.3% |
| SIERRA | 1,300 | 1,220 | 70 | 5.7% |
| SISKIYOU | 16,070 | 14,840 | 1,220 | 7.6% |
| SOLANO | 202,200 | 191,500 | 10,700 | 5.3% |
| SONOMA | 248,800 | 240,200 | 8,600 | 3.5% |
| STANISLAUS | 240,800 | 225,300 | 15,500 | 6.5% |
| SUTTER | 45,500 | 41,900 | 3,600 | 8.0% |
| TEHAMA | 25,270 | 23,880 | 1,390 | 5.5% |
| TRINITY | 4,260 | 4,020 | 240 | 5.6% |
| TULARE | 206,500 | 187,600 | 19,000 | 9.2% |
| TUOLUMNE | 19,990 | 18,910 | 1,080 | 5.4% |
| VENTURA | 413,100 | 396,100 | 17,000 | 4.1% |
| YOLO | 108,700 | 103,800 | 4,900 | 4.5% |
| YUBA | 31,400 | 29,300 | 2,100 | 6.6% |
