


IMPORTANT NOTE: The employment data for the month of August 2022 is taken from the survey week including August 12th. Data for the month of September is scheduled for release on October 21, 2022.
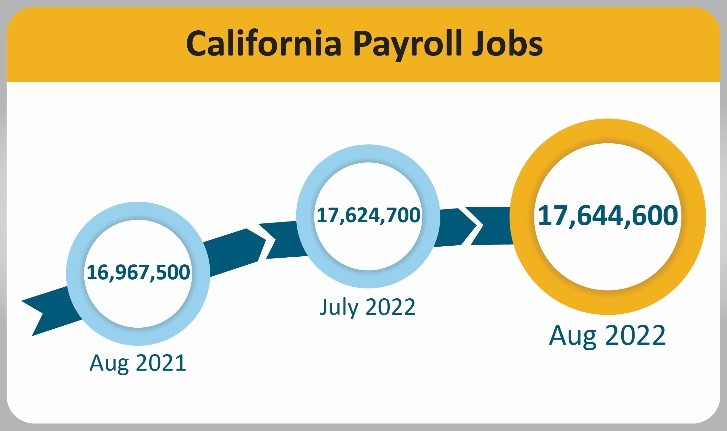
Employers added 19,900 nonfarm payroll jobs
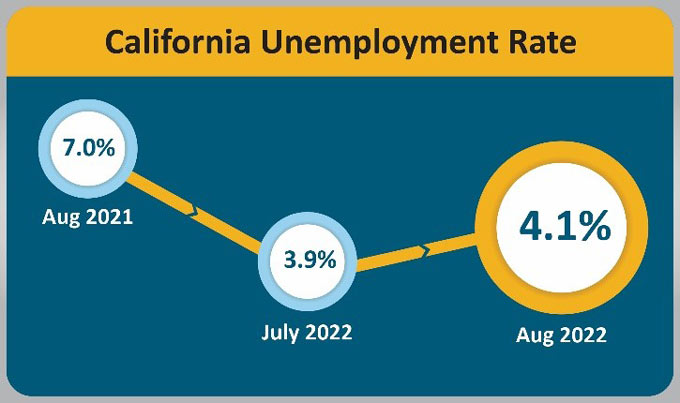
September 16, 2022 - SACRAMENTO – California’s unemployment rate increased in the month of August 2022 to 4.1 percent1, despite the state’s employers adding 19,900 nonfarm payroll jobs2 to the economy, according to data released today by the California Employment Development Department (EDD) from two surveys.
California’s Labor Market, by the Numbers...
- August 2022’s 0.2 percentage point gain is the first time since May of 2020 that California’s unemployment rate saw a month-over increase.
- The state has now regained 98.3 percent (2,711,600) of the 2,758,900 nonfarm jobs lost during March and April of 2020 due to the COVID-19 pandemic.
- August 2022 marked the 11th consecutive month of nonfarm job gains, which now totals a 690,000 job gain over that time period.
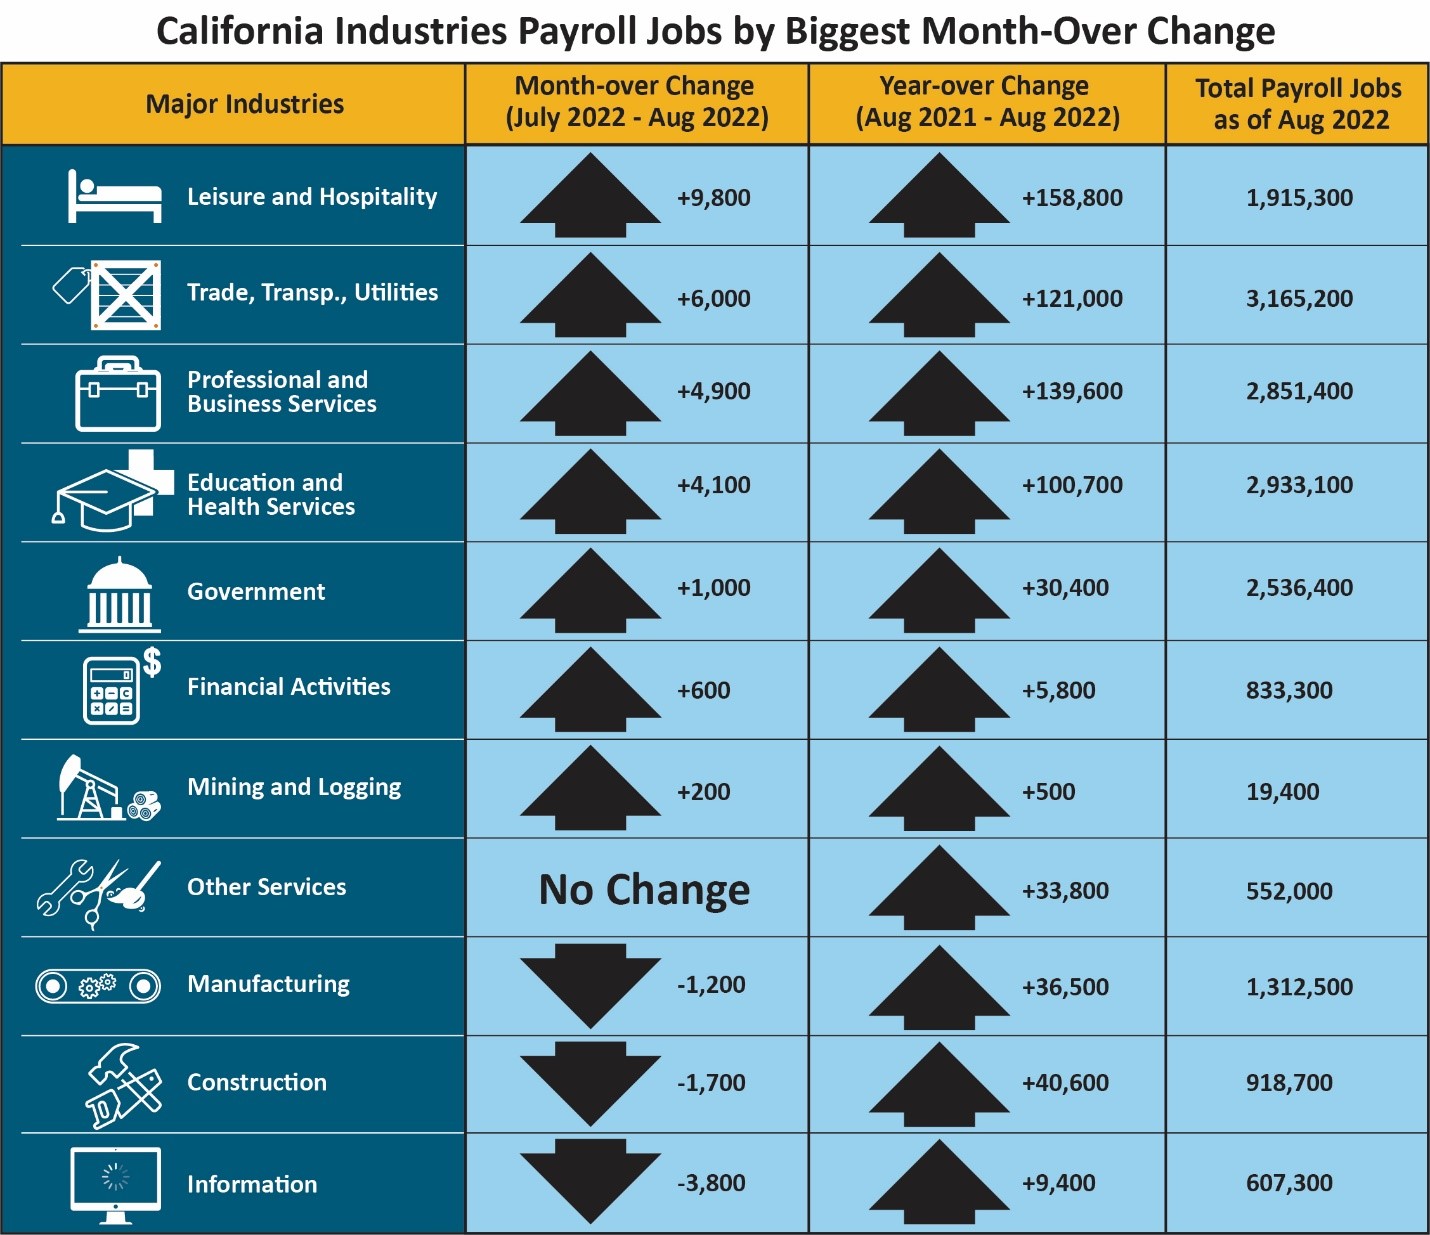
- Seven of California’s 11 industry sectors gained jobs in August. Leisure & Hospitality had the strongest gains (+9,800) with the majority of it occurring in Accommodation.
- Trade, Transportation, & Utilities (+6,000) showed noticeable gains in the Retail subsector with most of those gains occurring in Motor Vehicle and Parts Dealers, Food and Beverage Stores, and Health and Personal Care Stores.
- Information (-3,800) suffered the largest month-over job loss due, mainly, to reductions in Motion Picture and Video Industries, as well as Data Processing and Hosting Services.
1. The unemployment rate comes from a separate federal survey of 5,100 California households.
2. The nonfarm payroll job numbers come from a federal survey of 80,000 California businesses.
Data Trends about Jobs in the Economy
Total Nonfarm Payroll Jobs
Total Nonfarm Payroll Jobs (Comes from a monthly survey of approximately 80,000 California businesses that estimates jobs in the economy – seasonally adjusted)
- Month-over – Total nonfarm jobs in California’s 11 major industries totaled 17,644,600 in August – a net gain 19,900 jobs from July. This followed an upwards revised (+6,600) month-over gain of 91,400 jobs in July.
- Year-over – Total nonfarm jobs increased by 677,100 (a 4.0 percent increase) from August 2021 to August 2022 compared to the U.S. annual gain of 5,840,000 jobs (a 4.0 percent increase).
 EEOmail@edd.ca.gov or call toll free 1-866-490-8879. " style="box-sizing: border-box; vertical-align: middle; border-style: none; width: 1100px; max-width: 1100px;">
Total Farm jobs – The number of jobs in the agriculture industry decreased from July by 3,800 to a total of 411,500 jobs in August. The agricultural industry had 9,600 more farm jobs in August 2022 than it did in August a year ago.
Data Trends about Workers in the Economy
Employment and Unemployment in California (Based on a monthly federal survey of 5,100 California households which focuses on workers in the economy)
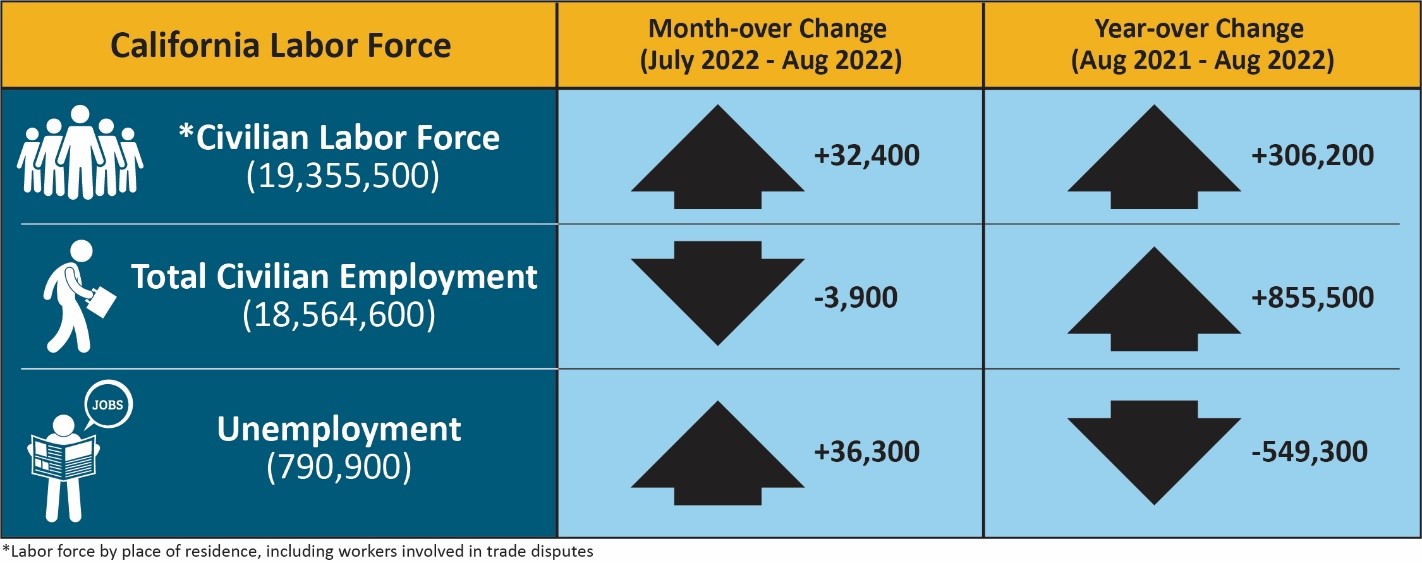
- Employed – The number of Californians employed in August was 18,564,600, a decrease of 3,900 persons from July’s total of 18,568,500, but up 855,500 from the employment total in August 2021.
- Unemployed – The number of unemployed Californians was 790,900 in August, an increase of 36,300 over the month, but down 549,300 in comparison to August 2021.
Unemployment Insurance Claims (Not Seasonally Adjusted)
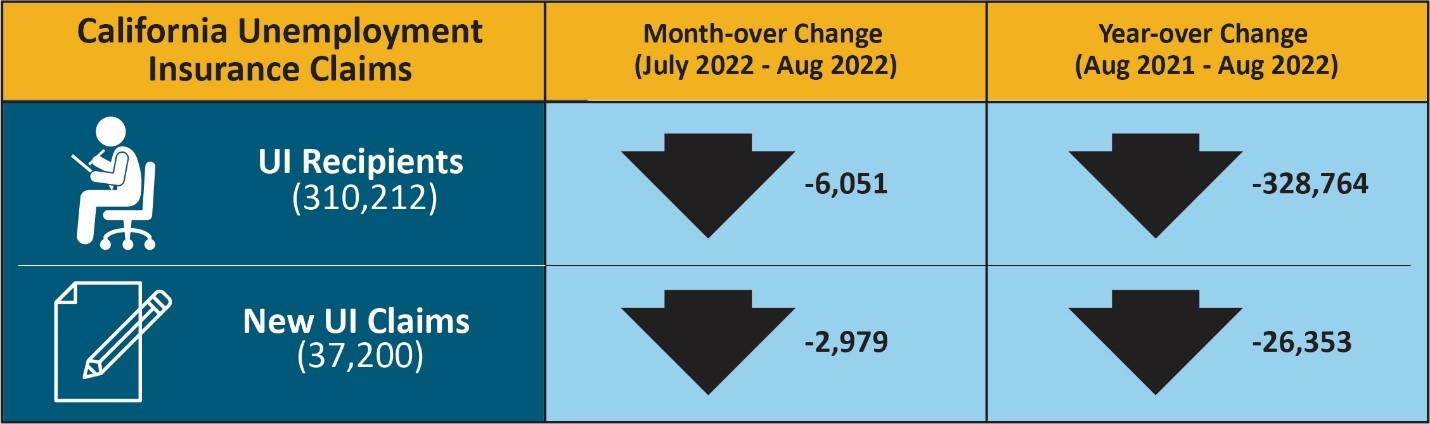
The following data is from a sample week that includes the 19th of each month: In related data that figures into the state’s unemployment rate, there were 310,212 people certifying for Unemployment Insurance benefits during the August 2022 sample week. That compares to 316,263 people in July and 638,976 people in August 2021. Concurrently, 37,200 initial claims were processed in the August 2022 sample week, which was a month-over decrease of 2,979 claims from July and a year-over decrease of 26,353 claims from August 2021.
| COUNTY | LABOR FORCE | EMPLOYMENT | UNEMPLOYMENT | RATE |
|---|---|---|---|---|
| STATE TOTAL | 19,288,300 | 18,505,600 | 782,700 | 4.1% |
| ALAMEDA | 831,500 | 805,500 | 26,000 | 3.1% |
| ALPINE | 470 | 440 | 30 | 5.6% |
| AMADOR | 14,500 | 13,920 | 580 | 4.0% |
| BUTTE | 92,200 | 88,400 | 3,800 | 4.1% |
| CALAVERAS | 22,340 | 21,640 | 710 | 3.2% |
| COLUSA | 11,590 | 10,710 | 880 | 7.6% |
| CONTRA COSTA | 555,600 | 537,000 | 18,600 | 3.3% |
| DEL NORTE | 9,580 | 9,130 | 450 | 4.7% |
| EL DORADO | 93,000 | 90,300 | 2,800 | 3.0% |
| FRESNO | 457,800 | 431,100 | 26,800 | 5.9% |
| GLENN | 12,760 | 12,130 | 630 | 4.9% |
| HUMBOLDT | 59,800 | 57,600 | 2,200 | 3.7% |
| IMPERIAL | 70,500 | 59,100 | 11,400 | 16.2% |
| INYO | 8,380 | 8,120 | 260 | 3.1% |
| KERN | 392,300 | 366,100 | 26,300 | 6.7% |
| KINGS | 56,300 | 52,800 | 3,500 | 6.3% |
| LAKE | 29,610 | 28,300 | 1,310 | 4.4% |
| LASSEN | 9,140 | 8,800 | 340 | 3.7% |
| LOS ANGELES | 4,945,900 | 4,702,700 | 243,200 | 4.9% |
| MADERA | 63,600 | 60,000 | 3,500 | 5.6% |
| MARIN | 131,100 | 128,000 | 3,100 | 2.4% |
| MARIPOSA | 7,550 | 7,250 | 300 | 3.9% |
| MENDOCINO | 38,410 | 37,090 | 1,320 | 3.4% |
| MERCED | 117,100 | 109,200 | 8,000 | 6.8% |
| MODOC | 3,320 | 3,180 | 130 | 4.0% |
| MONO | 8,950 | 8,650 | 310 | 3.4% |
| MONTEREY | 222,000 | 212,100 | 9,900 | 4.4% |
| NAPA | 70,400 | 68,400 | 2,000 | 2.8% |
| NEVADA | 48,680 | 47,220 | 1,470 | 3.0% |
| ORANGE | 1,593,900 | 1,545,600 | 48,300 | 3.0% |
| PLACER | 193,300 | 187,900 | 5,300 | 2.8% |
| PLUMAS | 7,730 | 7,340 | 390 | 5.0% |
| RIVERSIDE | 1,165,500 | 1,115,600 | 49,900 | 4.3% |
| SACRAMENTO | 727,000 | 699,100 | 27,900 | 3.8% |
| SAN BENITO | 33,300 | 31,900 | 1,400 | 4.2% |
| SAN BERNARDINO | 1,020,000 | 977,500 | 42,500 | 4.2% |
| SAN DIEGO | 1,587,400 | 1,534,200 | 53,200 | 3.4% |
| SAN FRANCISCO | 577,400 | 563,900 | 13,500 | 2.3% |
| SAN JOAQUIN | 340,000 | 322,400 | 17,600 | 5.2% |
| SAN LUIS OBISPO | 136,200 | 132,500 | 3,700 | 2.7% |
| SAN MATEO | 456,800 | 447,000 | 9,800 | 2.1% |
| SANTA BARBARA | 225,000 | 218,500 | 6,600 | 2.9% |
| SANTA CLARA | 1,059,600 | 1,035,000 | 24,600 | 2.3% |
| SANTA CRUZ | 138,600 | 133,400 | 5,300 | 3.8% |
| SHASTA | 72,600 | 69,600 | 3,100 | 4.2% |
| SIERRA | 1,390 | 1,350 | 40 | 3.1% |
| SISKIYOU | 16,520 | 15,730 | 790 | 4.8% |
| SOLANO | 201,500 | 193,100 | 8,500 | 4.2% |
| SONOMA | 250,400 | 243,400 | 7,000 | 2.8% |
| STANISLAUS | 244,000 | 231,400 | 12,600 | 5.2% |
| SUTTER | 46,600 | 44,000 | 2,600 | 5.6% |
| TEHAMA | 25,960 | 24,790 | 1,170 | 4.5% |
| TRINITY | 4,690 | 4,530 | 170 | 3.5% |
| TULARE | 206,300 | 189,900 | 16,400 | 7.9% |
| TUOLUMNE | 20,100 | 19,270 | 840 | 4.2% |
| VENTURA | 411,200 | 396,800 | 14,300 | 3.5% |
| YOLO | 109,500 | 105,800 | 3,700 | 3.4% |
| YUBA | 31,100 | 29,400 | 1,600 | 5.3% |
Source: EDD
