


TRENDS
Since the last 15-Day Report of Registration for a General Election in a gubernatorial election year (October 22, 2018):
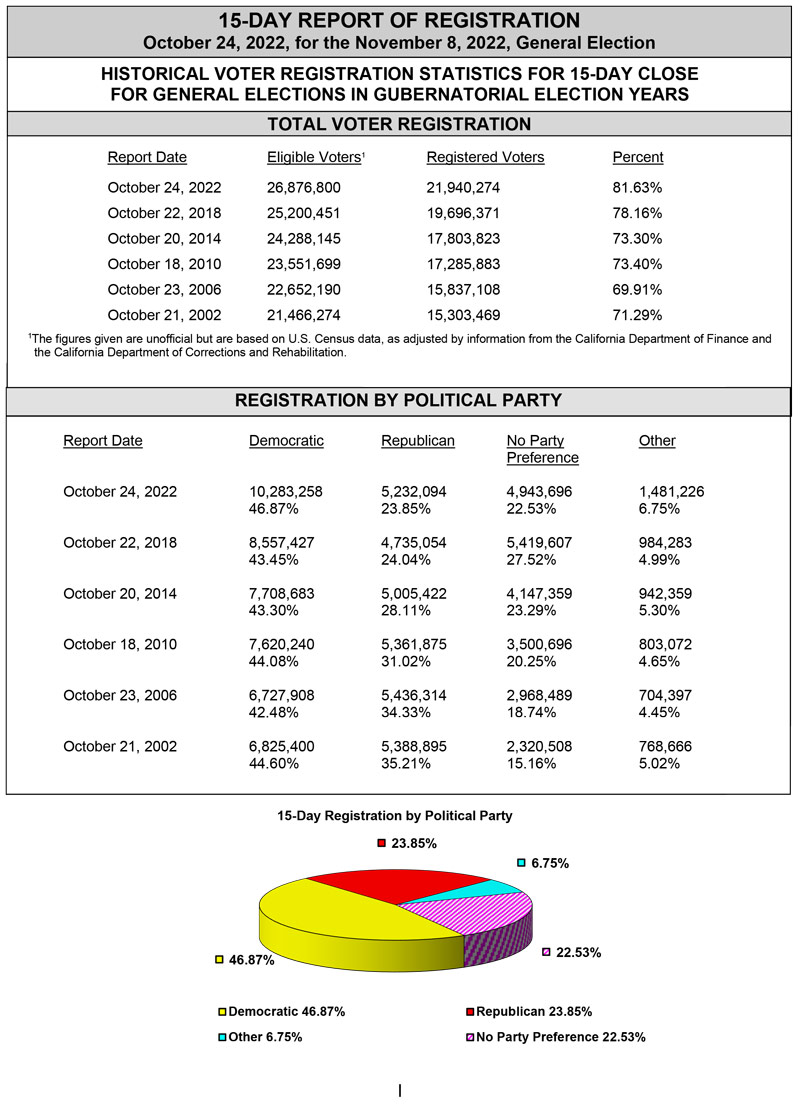
• The total voter registration in the state increased from 19,696,371 to 21,940,274.
• The percentage of eligible Californians who are registered to vote increased from 78.16% to 81.63%.
• The percentage of voters who have no party preference decreased from 27.52% to 22.53%.
• The percentage of voters registered with a qualified political party increased from 71.66% to 76.31%.
• The percentage of voters registered with the Democratic Party increased from 43.45% to 46.87%.
• The percentage of voters registered with the Republican Party decreased from 24.04% to 23.85%.
Source: SOS
