


IMPORTANT NOTE: The employment data for the month of October 2022 is taken from the survey week including Oct. 12th. Data for the month of November is scheduled for release on December 16, 2022.
Employers added 56,700 nonfarm payroll jobs
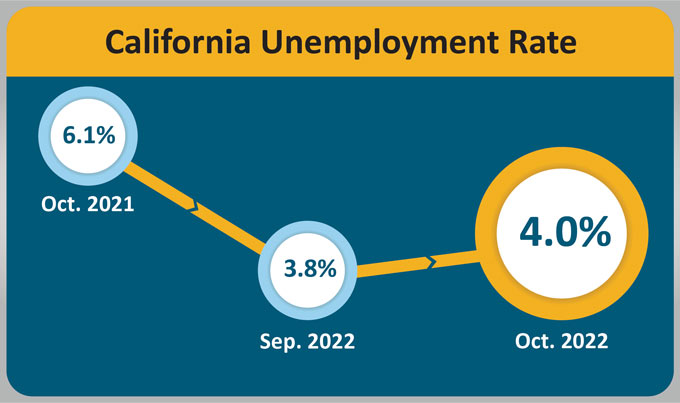
November 19, 2022 - SACRAMENTO – California’s unemployment rate increased in the month of October 2022 to 4.0 percent1 despite the state’s employers adding 56,700 nonfarm payroll jobs2 to the economy, according to data released on Friday by the California Employment Development Department (EDD) from two surveys. The state has also now completed its full recovery from the large job loss during the COVID-19 pandemic.
California’s Labor Market, by the Numbers...
- September 2022’s unemployment rate was revised down to 3.8 percent, which became the lowest ever on record for California in a data set that dates back to 1976.
- The state has not only regained all of the 2,758,900 nonfarm jobs lost during March and April of 2020 due to the COVID-19 pandemic, it has now surpassed it with a gain of 2,789,700 (101.1 percent) nonfarm jobs since that time.
- October 2022 marked the 13th consecutive month of nonfarm job gains for a total increase of 768,100 jobs over that time period and a monthly average of 59,085 jobs.
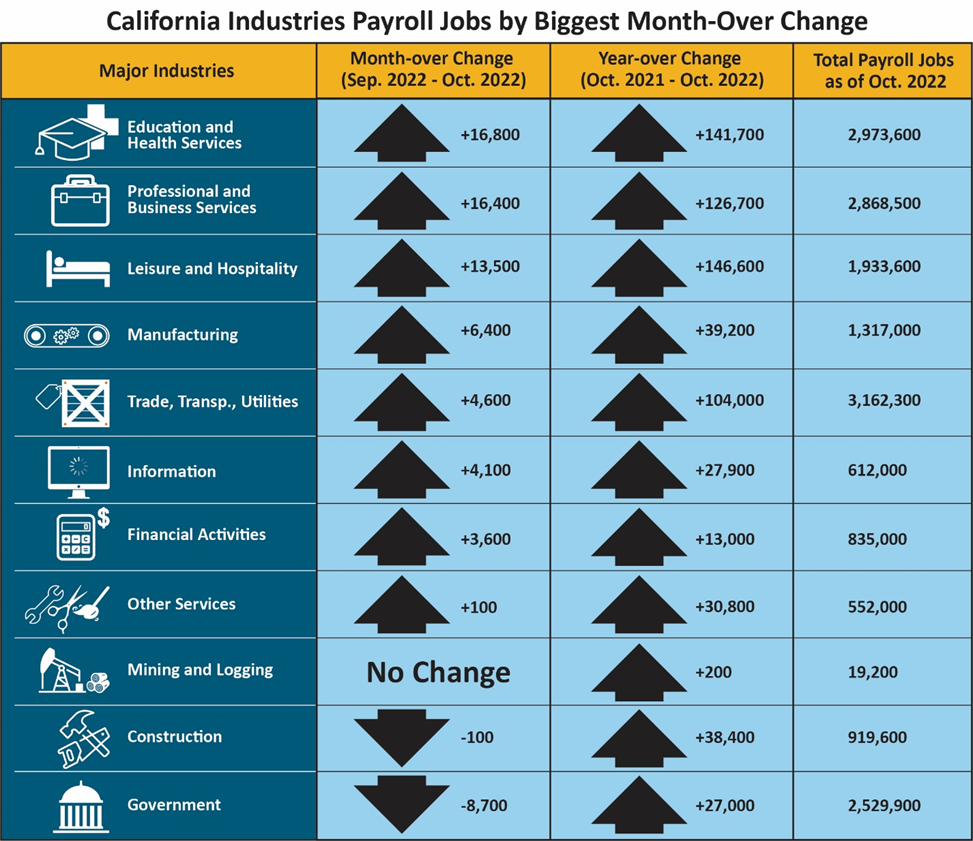
- Eight of California’s 11 industry sectors gained jobs in October with Education & Health Services (+16,800) showing the largest month-over gains thanks to above average gains in Outpatient Care Services, Nursing Care Facilities, and Individual and Family Services.
- Professional and Business Services (+16,400) also had strong growth thanks, in part, to above average gains in Accounting and Tax Prep and Bookkeeping Services.
- Government (-8,700) again led the way in job losses with a third consecutive decline in State Government and the second straight month of losses in Local Government.
1. The unemployment rate comes from a separate federal survey of 5,100 California households.
2. The nonfarm payroll job numbers come from a federal survey of 80,000 California businesses.
Data Trends about Jobs in the Economy
Total Nonfarm Payroll Jobs
Total Nonfarm Payroll Jobs (Comes from a monthly survey of approximately 80,000 California businesses that estimates jobs in the economy – seasonally adjusted)
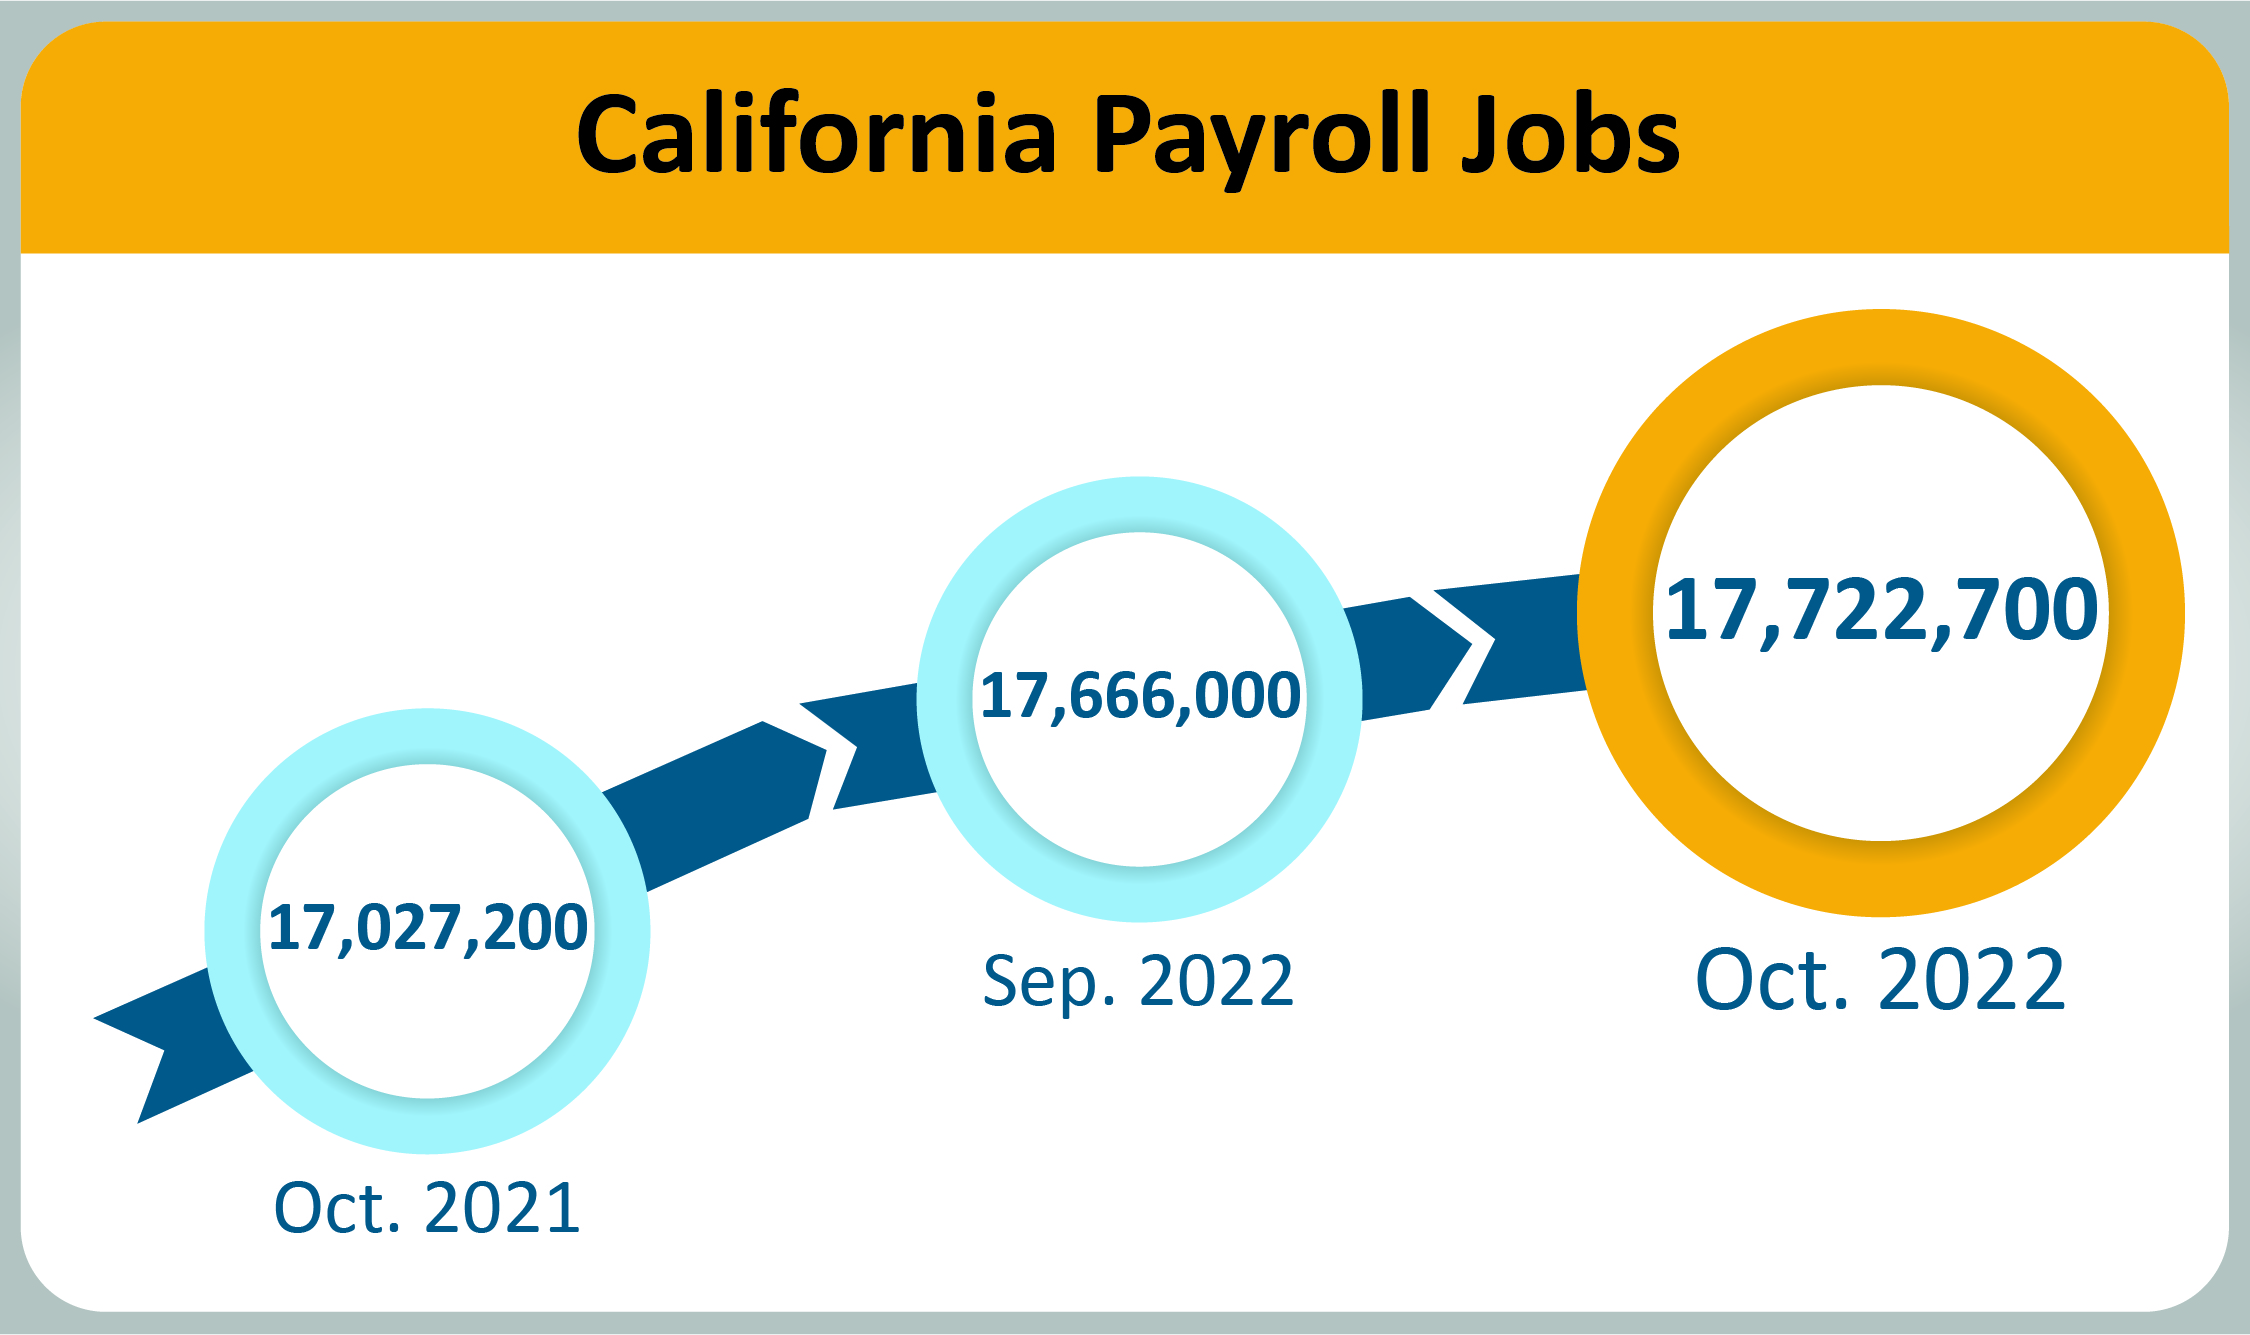
- Month-over – Total nonfarm jobs in California’s 11 major industries totaled 17,722,700 in October – a net gain of 56,700 jobs from September. This followed a downward revised (-1,200) month-over gain of 5,300 jobs in September.
- Year-over – Total nonfarm jobs increased by 695,500 (a 4.1 percent increase) from October 2021 to October 2022 compared to the U.S. annual gain 5,303,000 jobs (a 3.6 percent increase).
Total Farm jobs – The number of jobs in the agriculture industry decreased from September by 100 to a total of 410,700 jobs in October. The agricultural industry had 3,000 more farm jobs in October 2022 than it did in October a year ago.
Data Trends about Workers in the Economy
Employment and Unemployment in California (Based on a monthly federal survey of 5,100 California households which focuses on workers in the economy)
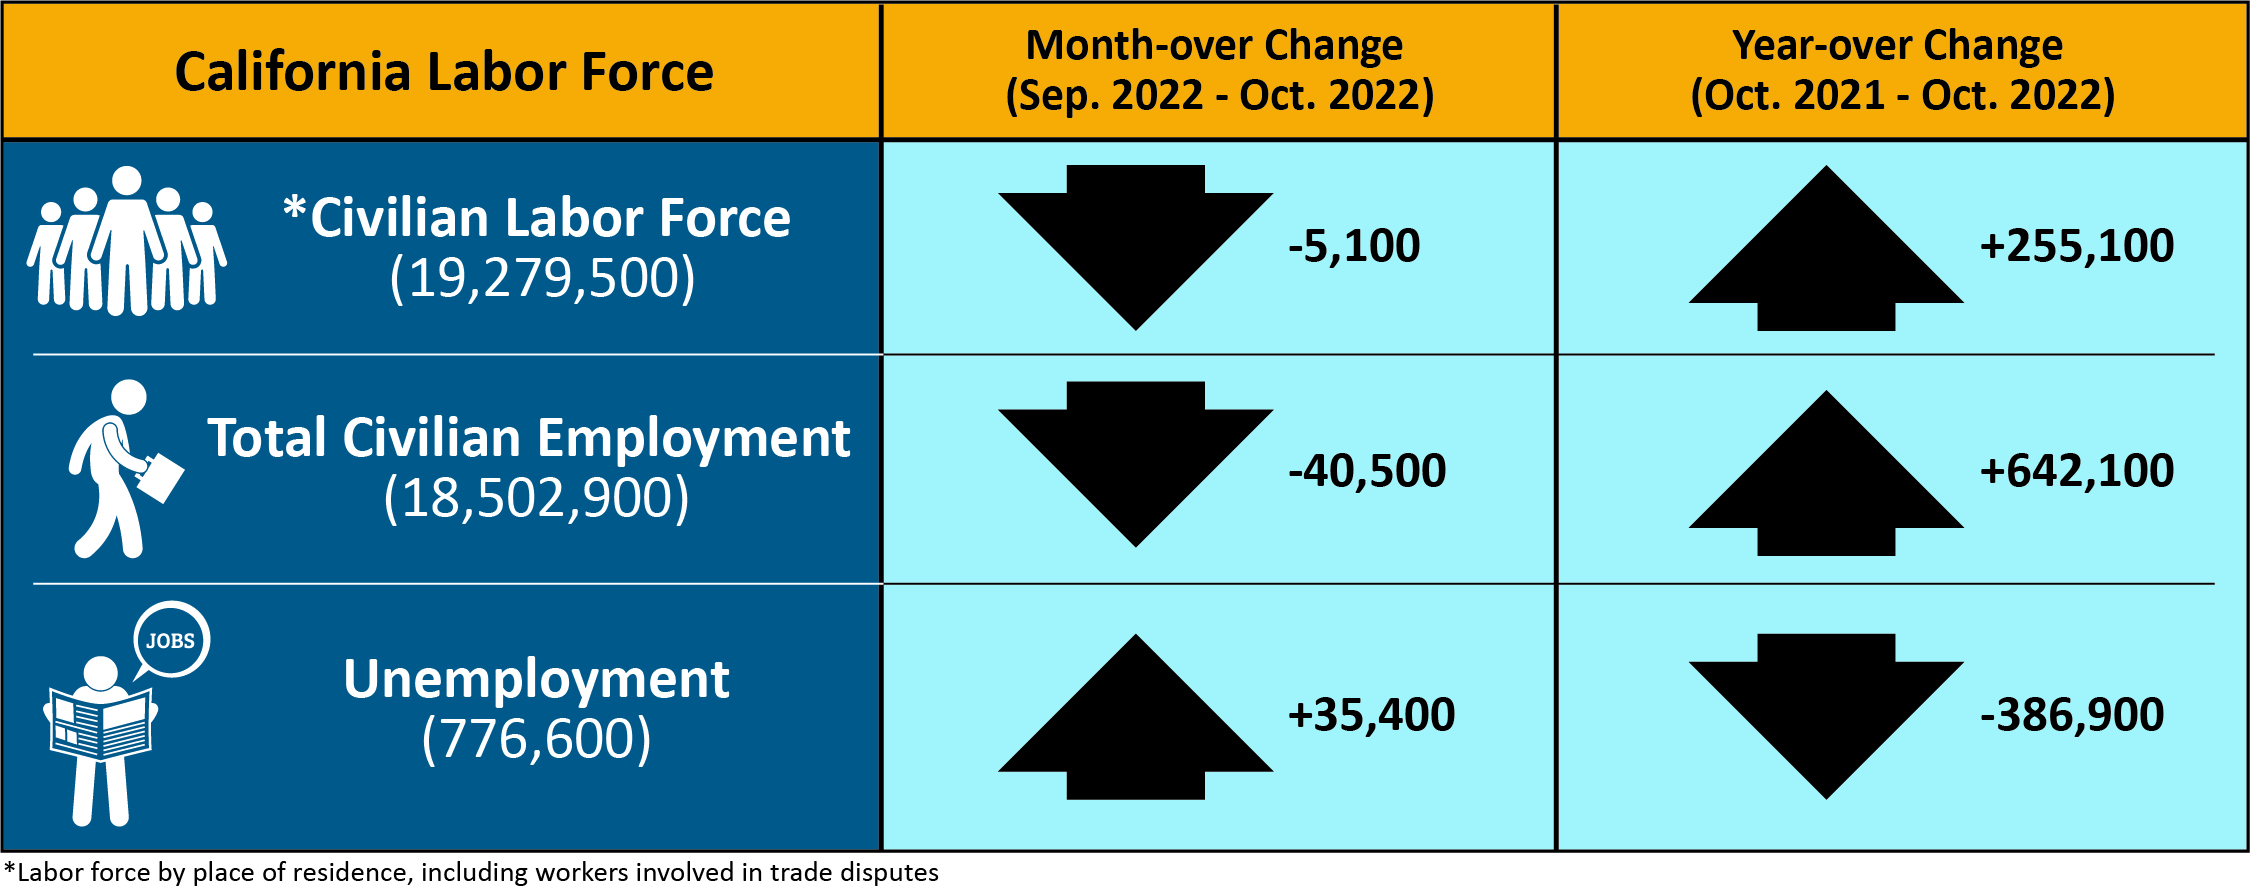
- Employed – The number of Californians employed in October was 18,502,900, a decrease of 40,500 persons from September’s total of 18,543,400, but up 642,100 from the employment total in October
- Unemployed – The number of unemployed Californians was 776,600 in October, an increase of 35,400 over the month, but down 386,900 in comparison to October 2021.
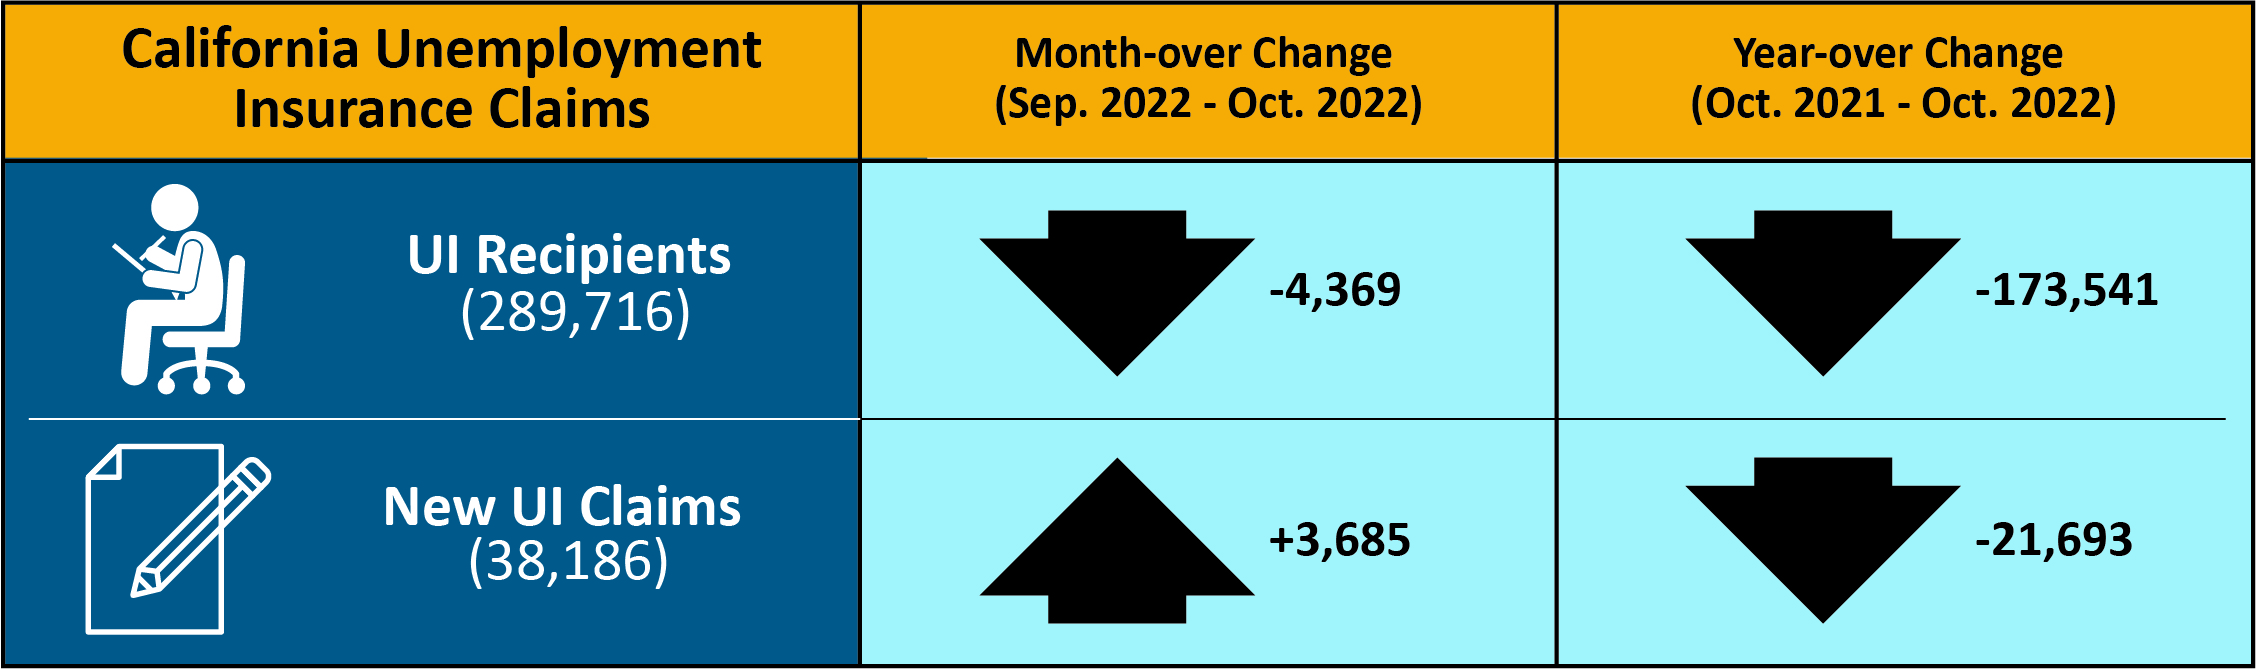
Unemployment Insurance Claims (Not Seasonally Adjusted)
The following data is from a sample week that includes the 19th of each month: In related data that figures into the state’s unemployment rate, there were 289,716 people certifying for Unemployment Insurance benefits during the October 2022 sample week. That compares to 294,085 people in September and 463,257 people in October 2021. Concurrently, 38,186 initial claims were processed in the October 2022 sample week, which was a month-over increase of 3,685 claims from September and a year-over decrease of 21,693 claims from October 2021.
| COUNTY | LABOR FORCE | EMPLOYMENT | UNEMPLOYMENT | RATE |
|---|---|---|---|---|
| STATE TOTAL | 19,213,500 | 18,487,200 | 726,300 | 3.8% |
| ALAMEDA | 830,300 | 805,900 | 24,400 | 2.9% |
| ALPINE | 450 | 430 | 20 | 5.3% |
| AMADOR | 14,440 | 13,860 | 580 | 4.0% |
| BUTTE | 93,400 | 89,800 | 3,600 | 3.8% |
| CALAVERAS | 21,970 | 21,280 | 680 | 3.1% |
| COLUSA | 11,550 | 10,710 | 840 | 7.2% |
| CONTRA COSTA | 554,700 | 537,200 | 17,500 | 3.2% |
| DEL NORTE | 9,500 | 9,080 | 420 | 4.4% |
| EL DORADO | 92,700 | 90,100 | 2,600 | 2.8% |
| FRESNO | 448,700 | 422,800 | 25,900 | 5.8% |
| GLENN | 12,730 | 12,150 | 590 | 4.6% |
| HUMBOLDT | 61,000 | 58,900 | 2,000 | 3.3% |
| IMPERIAL | 70,700 | 59,200 | 11,500 | 16.2% |
| INYO | 8,310 | 8,070 | 240 | 2.9% |
| KERN | 391,600 | 367,100 | 24,500 | 6.3% |
| KINGS | 56,100 | 52,700 | 3,400 | 6.1% |
| LAKE | 28,710 | 27,420 | 1,280 | 4.5% |
| LASSEN | 9,790 | 9,480 | 310 | 3.2% |
| LOS ANGELES | 4,899,800 | 4,681,200 | 218,600 | 4.5% |
| MADERA | 61,700 | 58,300 | 3,400 | 5.5% |
| MARIN | 129,300 | 126,400 | 2,900 | 2.2% |
| MARIPOSA | 7,220 | 6,950 | 280 | 3.8% |
| MENDOCINO | 37,940 | 36,680 | 1,260 | 3.3% |
| MERCED | 117,700 | 110,400 | 7,300 | 6.2% |
| MODOC | 3,290 | 3,170 | 120 | 3.6% |
| MONO | 8,340 | 8,020 | 320 | 3.9% |
| MONTEREY | 214,100 | 204,700 | 9,300 | 4.4% |
| NAPA | 70,000 | 68,100 | 1,900 | 2.7% |
| NEVADA | 48,090 | 46,700 | 1,390 | 2.9% |
| ORANGE | 1,604,000 | 1,559,700 | 44,300 | 2.8% |
| PLACER | 192,500 | 187,500 | 5,000 | 2.6% |
| PLUMAS | 7,640 | 7,280 | 360 | 4.8% |
| RIVERSIDE | 1,170,300 | 1,123,500 | 46,800 | 4.0% |
| SACRAMENTO | 723,900 | 697,400 | 26,500 | 3.7% |
| SAN BENITO | 33,300 | 31,900 | 1,400 | 4.1% |
| SAN BERNARDINO | 1,023,500 | 983,700 | 39,900 | 3.9% |
| SAN DIEGO | 1,578,900 | 1,529,100 | 49,800 | 3.2% |
| SAN FRANCISCO | 576,600 | 564,300 | 12,400 | 2.1% |
| SAN JOAQUIN | 336,400 | 319,600 | 16,800 | 5.0% |
| SAN LUIS OBISPO | 136,300 | 132,900 | 3,400 | 2.5% |
| SAN MATEO | 456,400 | 447,300 | 9,000 | 2.0% |
| SANTA BARBARA | 227,000 | 220,800 | 6,300 | 2.8% |
| SANTA CLARA | 1,060,000 | 1,037,100 | 22,900 | 2.2% |
| SANTA CRUZ | 136,700 | 131,800 | 5,000 | 3.6% |
| SHASTA | 74,600 | 71,700 | 2,900 | 3.9% |
| SIERRA | 1,390 | 1,360 | 40 | 2.7% |
| SISKIYOU | 16,780 | 16,040 | 740 | 4.4% |
| SOLANO | 201,500 | 193,700 | 7,900 | 3.9% |
| SONOMA | 249,800 | 243,300 | 6,500 | 2.6% |
| STANISLAUS | 239,000 | 227,200 | 11,800 | 5.0% |
| SUTTER | 45,500 | 42,900 | 2,500 | 5.6% |
| TEHAMA | 26,290 | 25,220 | 1,070 | 4.1% |
| TRINITY | 4,510 | 4,340 | 170 | 3.7% |
| TULARE | 203,500 | 187,400 | 16,000 | 7.9% |
| TUOLUMNE | 19,810 | 19,040 | 770 | 3.9% |
| VENTURA | 414,000 | 400,100 | 13,800 | 3.3% |
| YOLO | 108,500 | 105,000 | 3,500 | 3.3% |
| YUBA | 30,800 | 29,200 | 1,600 | 5.0% |
Source: CA. EDD
