


May 15, 2023 - By Nat Johnson - The tropical Pacific sure knows how to get out of a rut! Just two months after declaring the demise of an almost interminable La Niña, above-average surface temperatures have reclaimed the tropical Pacific, and temperatures in the central-eastern Pacific are expected to continue to rise. Consequently, an El Niño Watch remains in place, with El Niño conditions likely to develop within the next couple of months and then persisting (greater than 90% chance) into the winter.
We care about the potential development of El Niño—the warm phase of ENSO (El Niño/Southern Oscillation, the whole El Niño-La Niña system)—because of the cascade of global impacts that arise from its occurrence, including the expected temperature and precipitation patterns shown here. We’ll revisit many of these impacts in the coming months, but we’ll start by focusing on all the details of these rapidly developing conditions in the tropical Pacific.
On the doorstep
According to ERSSTv5 (our most consistent historical dataset), the April average sea surface temperature in the Niño-3.4 region (our primary monitoring region for ENSO) was 0.1 °C above the long-term (1991–2020) average. This value is up 0.2 °C from March and is the first time the monthly Niño-3.4 temperature was warmer than average since April of 2020.
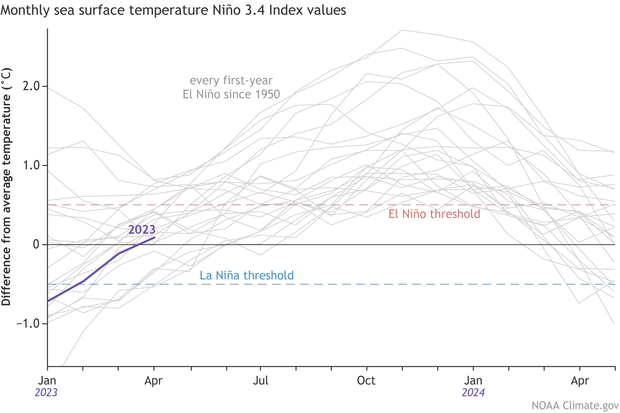
16-month history of sea surface temperatures in the Niño-3.4 region of the tropical Pacific for all events evolving into El Niño since 1950 (gray lines) and the current event (purple line). NOAA Climate.gov image based on a graph by Michelle L’Heureux and monthly Niño-3.4 index data from CPC using ERSSTv5.
When we zoom into the weekly time frame, we find that the latest Niño-3.4 measurement from our highest-resolution dataset (OISSTv2.1) was 0.4 °C above the long-term average, even higher than the latest monthly average. This is just a mere 0.1 °C away from the 0.5 °C threshold that is necessary (but not sufficient!) for declaring El Niño conditions. Subsurface ocean temperatures in the tropical Pacific also increased over the past month, providing a source of warmer water that can sustain a developing El Niño. How can La Niña seem like a distant memory so quickly?
Although the tropical Pacific Ocean looks ready to burst through that door to El Niño, the tropical atmosphere seems a bit more hesitant, remaining firmly in ENSO-neutral territory. As in March, the April Southern Oscillation Index and the Equatorial Southern Oscillation Index were close to zero, indicating that the Walker circulation remains at near-average strength. For El Niño conditions, we would expect negative values of these indexes, which would indicate (1) a weakening in the surface pressure difference that normally exists between the western and central-eastern Pacific and (2) a reduction of the east-to-west surface trade winds that are the key component of the Walker circulation. (For La Niña conditions, we get the opposite – positive index values indicating a strengthened Walker circulation and stronger east-to-west trade winds across the tropical Pacific Ocean.)
Summary of NOAA decision process in determining El Niño conditions. NOAA Climate.gov drawing by Glen Becker and Fiona Martin.
Note that even if the monthly average Niño-3.4 index soon exceeds the 0.5 °C threshold for El Niño, forecasters will not declare onset of El Niño unless the tropical atmosphere is clearly responding in the expected way, including a weakening of the Walker circulation.
Peering ahead
Forecasters have high confidence in an upcoming El Niño not only because of the rapidly changing tropical Pacific Ocean conditions but also because of the strong agreement from the latest computer model predictions. The current forecast from the North American Multi-Model Ensemble (NMME), a set of state-of-the-art computer climate models, indicates that the Niño-3.4 sea surface temperature is very likely to climb above the El Niño threshold within a couple of months and remain in El Niño territory for the remainder of the forecast period.
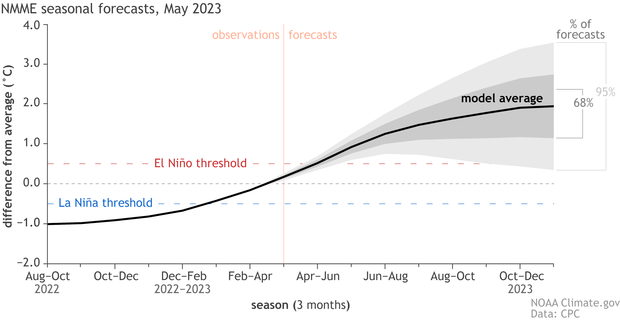
May 2023 climate model forecasts for the Niño-3.4 temperature anomaly in 2023 from the North American Multi-Model Ensemble (NMME). The black line shows the model forecast average; darker gray envelope shows the range of 68% of all model forecasts; lighter gray shows the range of 95% of all model forecasts. NOAA Climate.gov image based on a graph from Emily Becker.
In short, the signs of El Niño development that we saw last month have only grown stronger this month. Additionally, we’ve pushed one more month through the dreaded spring predictability barrier (also check out here, here, and Michelle’s latest post here). Taken together, these signals have allowed forecasters to increase their forecast confidence this month, with the likelihood of El Niño approaching 90% by summer and exceeding 90% through next fall and winter.
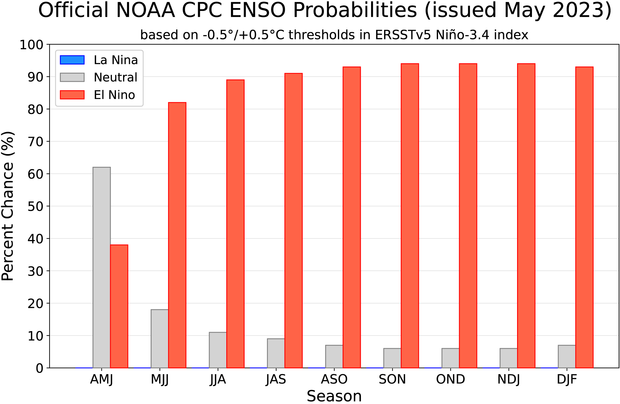
NOAA Climate Prediction Center forecast for each of the three possible ENSO categories for the next 9 overlapping 3-month seasons. Blue bars show the chances of La Niña, gray bars the chances for neutral, and red bars the chances for El Niño. Graph by Michelle L'Heureux.
The possibility of a significant El Niño is also growing. Following the method described in Tom’s post, the current chance for a strong El Niño (Niño-3.4 index greater than 1.5 °C) is approximately 55%, which is up almost 15% since last month. We may have a better handle on the potential strength of this event, assuming it develops (still a 5-10% chance it doesn’t!), once we fully get past the spring predictability barrier.
Global simmering
Warm ocean conditions are not just limited to the tropical Pacific. Despite some unusually cold ocean temperatures off the West Coast of the U.S., the remarkably warm global ocean has grabbed recent headlines.
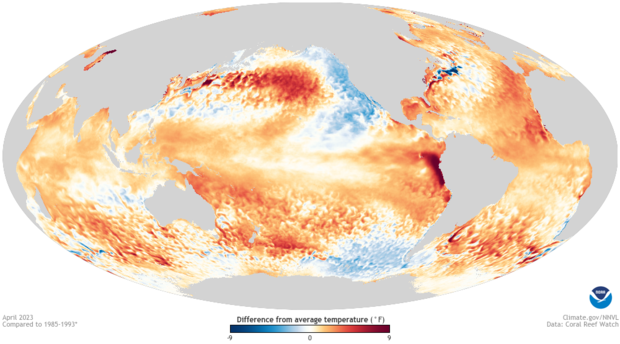
April 2023 sea surface temperature difference from the 1985-1993 average (details from Coral Reef Watch). Most of the global oceans were warmer than average. NOAA Climate.gov image from Data Snapshots.
For some additional perspective on this widespread warmth, I reached out to Dr. Boyin Huang, an oceanographer of the National Centers for Environmental Information with expertise in sea surface temperature reconstructions. Dr. Huang kindly provided the following plots of near-globally averaged sea surface temperature time series for two of our most used sea surface temperature datasets, monthly ERSSTv5 and daily OISSTv2.1.
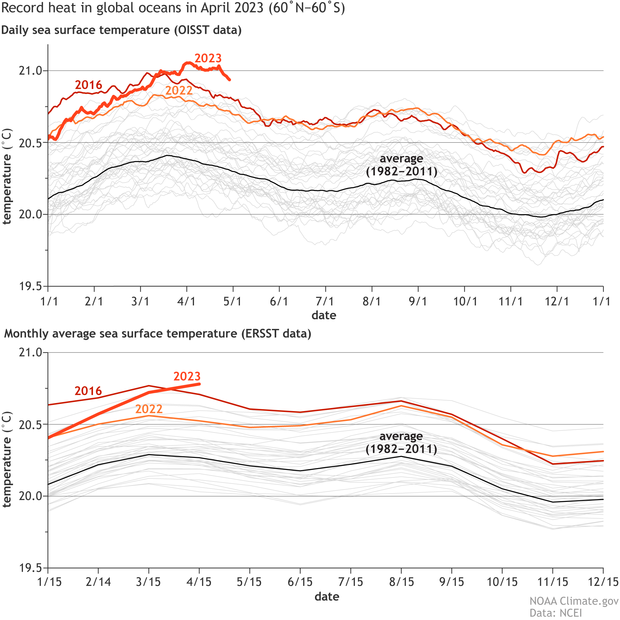
Non-polar (60 °N – 60 °S) global averaged sea surface temperature from 1982-2023 from (top) daily OISSTv2.1 and (bottom) monthly ERSSTv5 datasets. The thick black lines represent the 1982-2011 average across the calendar year; 2022 (orange line), 2023 (thick red line), and 2016 (the year of record warmth before 2023; thin red line) are highlighted. The thin grey lines represent all other years. The top graph indicates that 2023 reached record warm levels since mid-March in OISST; however, the bottom graph indicates that peak temperatures in ERSST have not clearly exceeded the record warmth of March 2016 in that dataset. Nevertheless, both datasets indicate that April 2023 was warmer than any previous April on record. NOAA Climate.gov image based on graphs by Boyin Huang and data from NCEI.
First, we note that while the two datasets are not identical, as Tom pointed out way back when, both the ERSST and OISST datasets confirm that the global oceans are currently sizzling. However, they do have minor disagreements about record warmth. Although the global (non-polar) ocean surface temperatures have been warmer than at any point over the past 40 years in the OISST dataset since mid-March, the ERSST dataset has trailed the record warmth of 2016, at least until recently. However, Dr. Huang confirms a point of agreement: both datasets indicate that the global ocean surface was warmer in April 2023 than in any previous April.
How would a developing El Niño relate to the global ocean temperatures? First, as Emily noted last month, global average temperature tends to be higher in El Niño years than in La Niña or ENSO-neutral years. Given how warm the oceans are already, a developing El Niño would only increase the chance of record-breaking global ocean temperatures (and global average temperature over both ocean and land), which likely would have important ecological consequences, including for fish and corals.
Another factor to consider is that the widespread ocean warmth may make it a little more challenging for the warm temperatures in the central-eastern equatorial Pacific to induce a tropical atmospheric response (maybe a reason for the current ENSO-neutral looking tropical atmosphere?). The reason is that the response of the tropical atmosphere depends on surface temperatures in the central-eastern equatorial Pacific relative to the surrounding regions. If those surrounding tropical regions are also warmer than average, then the bar is even higher for the Niño-3.4 region surface temperature anomalies to induce an atmospheric response (see footnote).
The bottom line is that in terms of a push on the tropical atmosphere, we need to consider that the Niño-3.4 index may punch below its weight while it’s hovering in borderline El Niño territory, as it is now. However, if the central-eastern Pacific continues to warm up, we can expect that the atmosphere will feel that push eventually.
Coming Up
You probably noticed that you aren’t being treated to the ENSO update eloquence that Emily usually provides each month. Don’t worry – Emily will be back later this month with a post talking about our favorite blend of computer prediction models, the NMME. Also, be sure to check out NOAA’s outlook for the 2023 hurricane season that comes out in just a couple weeks (May 25th). One of biggest implications of a developing El Niño in the shorter term is its potential influence on the Atlantic and Pacific hurricane seasons. In brief, Atlantic hurricane seasons tend to be less active during El Niño, while the Pacific season is often enhanced. That means this month’s ENSO forecast is likely one of the factors that will be considered in the hurricane outlook. In the meantime, keep your eyes peeled on the tropics, and don’t blink – conditions are evolving quickly!
Footnote
- This issue is why some, including Michelle of this blog, have advocated the monitoring of a relative Niño-3.4 or relative Oceanic Niño Index (RONI). The NOAA Climate Prediction Center monitors the RONI here. The RONI is simply our standard ONI (3-month average Niño-3.4 sea surface temperature anomaly) with the tropical average sea surface temperature subtracted. Such an index is less sensitive to a warming climate and, consistent with some of my earlier research, is more closely connected with changes in the tropical atmosphere than the standard ONI.
A blog about monitoring and forecasting El Niño, La Niña, and their impacts.
Disclaimer:
The ENSO blog is written, edited, and moderated by Michelle L’Heureux (NOAA Climate Prediction Center), Emily Becker (University of Miami/CIMAS), Nat Johnson (NOAA Geophysical Fluid Dynamics Laboratory), and Tom DiLiberto and Rebecca Lindsey (contractors to NOAA Climate Program Office), with periodic guest contributors.
Ideas and explanations found in these posts should be attributed to the ENSO blog team, and not to NOAA (the agency) itself. These are blog posts, not official agency communications; if you quote from these posts or from the comments section, you should attribute the quoted material to the blogger or commenter, not to NOAA, CPC, or Climate.gov.
Source: ENSO blog team
