


IMPORTANT NOTE: The employment data for the month of May 2023 is taken from the survey week including May 12th. Data for the month of June is scheduled for release on July 21, 2023.
Employers added 47,300 nonfarm payroll jobs
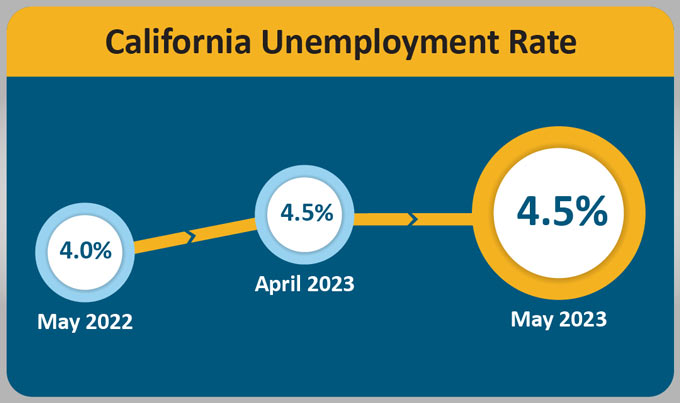
June 17, 2023 - SACRAMENTO – California’s unemployment rate stayed constant from April 2023 and remained at 4.5 percent1 for May 2023 as the state’s employers added 47,300 nonfarm payroll jobs2 to the economy, according to data released on Friday by the California Employment Development Department (EDD) from two surveys. Total nonfarm employment for April 2023 was revised up by 2,900 jobs.
California’s Labor Market, by the Numbers…
- Since the current economic expansion began in April 2020, California has gained 3,170,200 jobs, a monthly average of 85,681 jobs gained over that time.
- California’s May nonfarm job gain was 14 percent of the national job gain of 339,000.
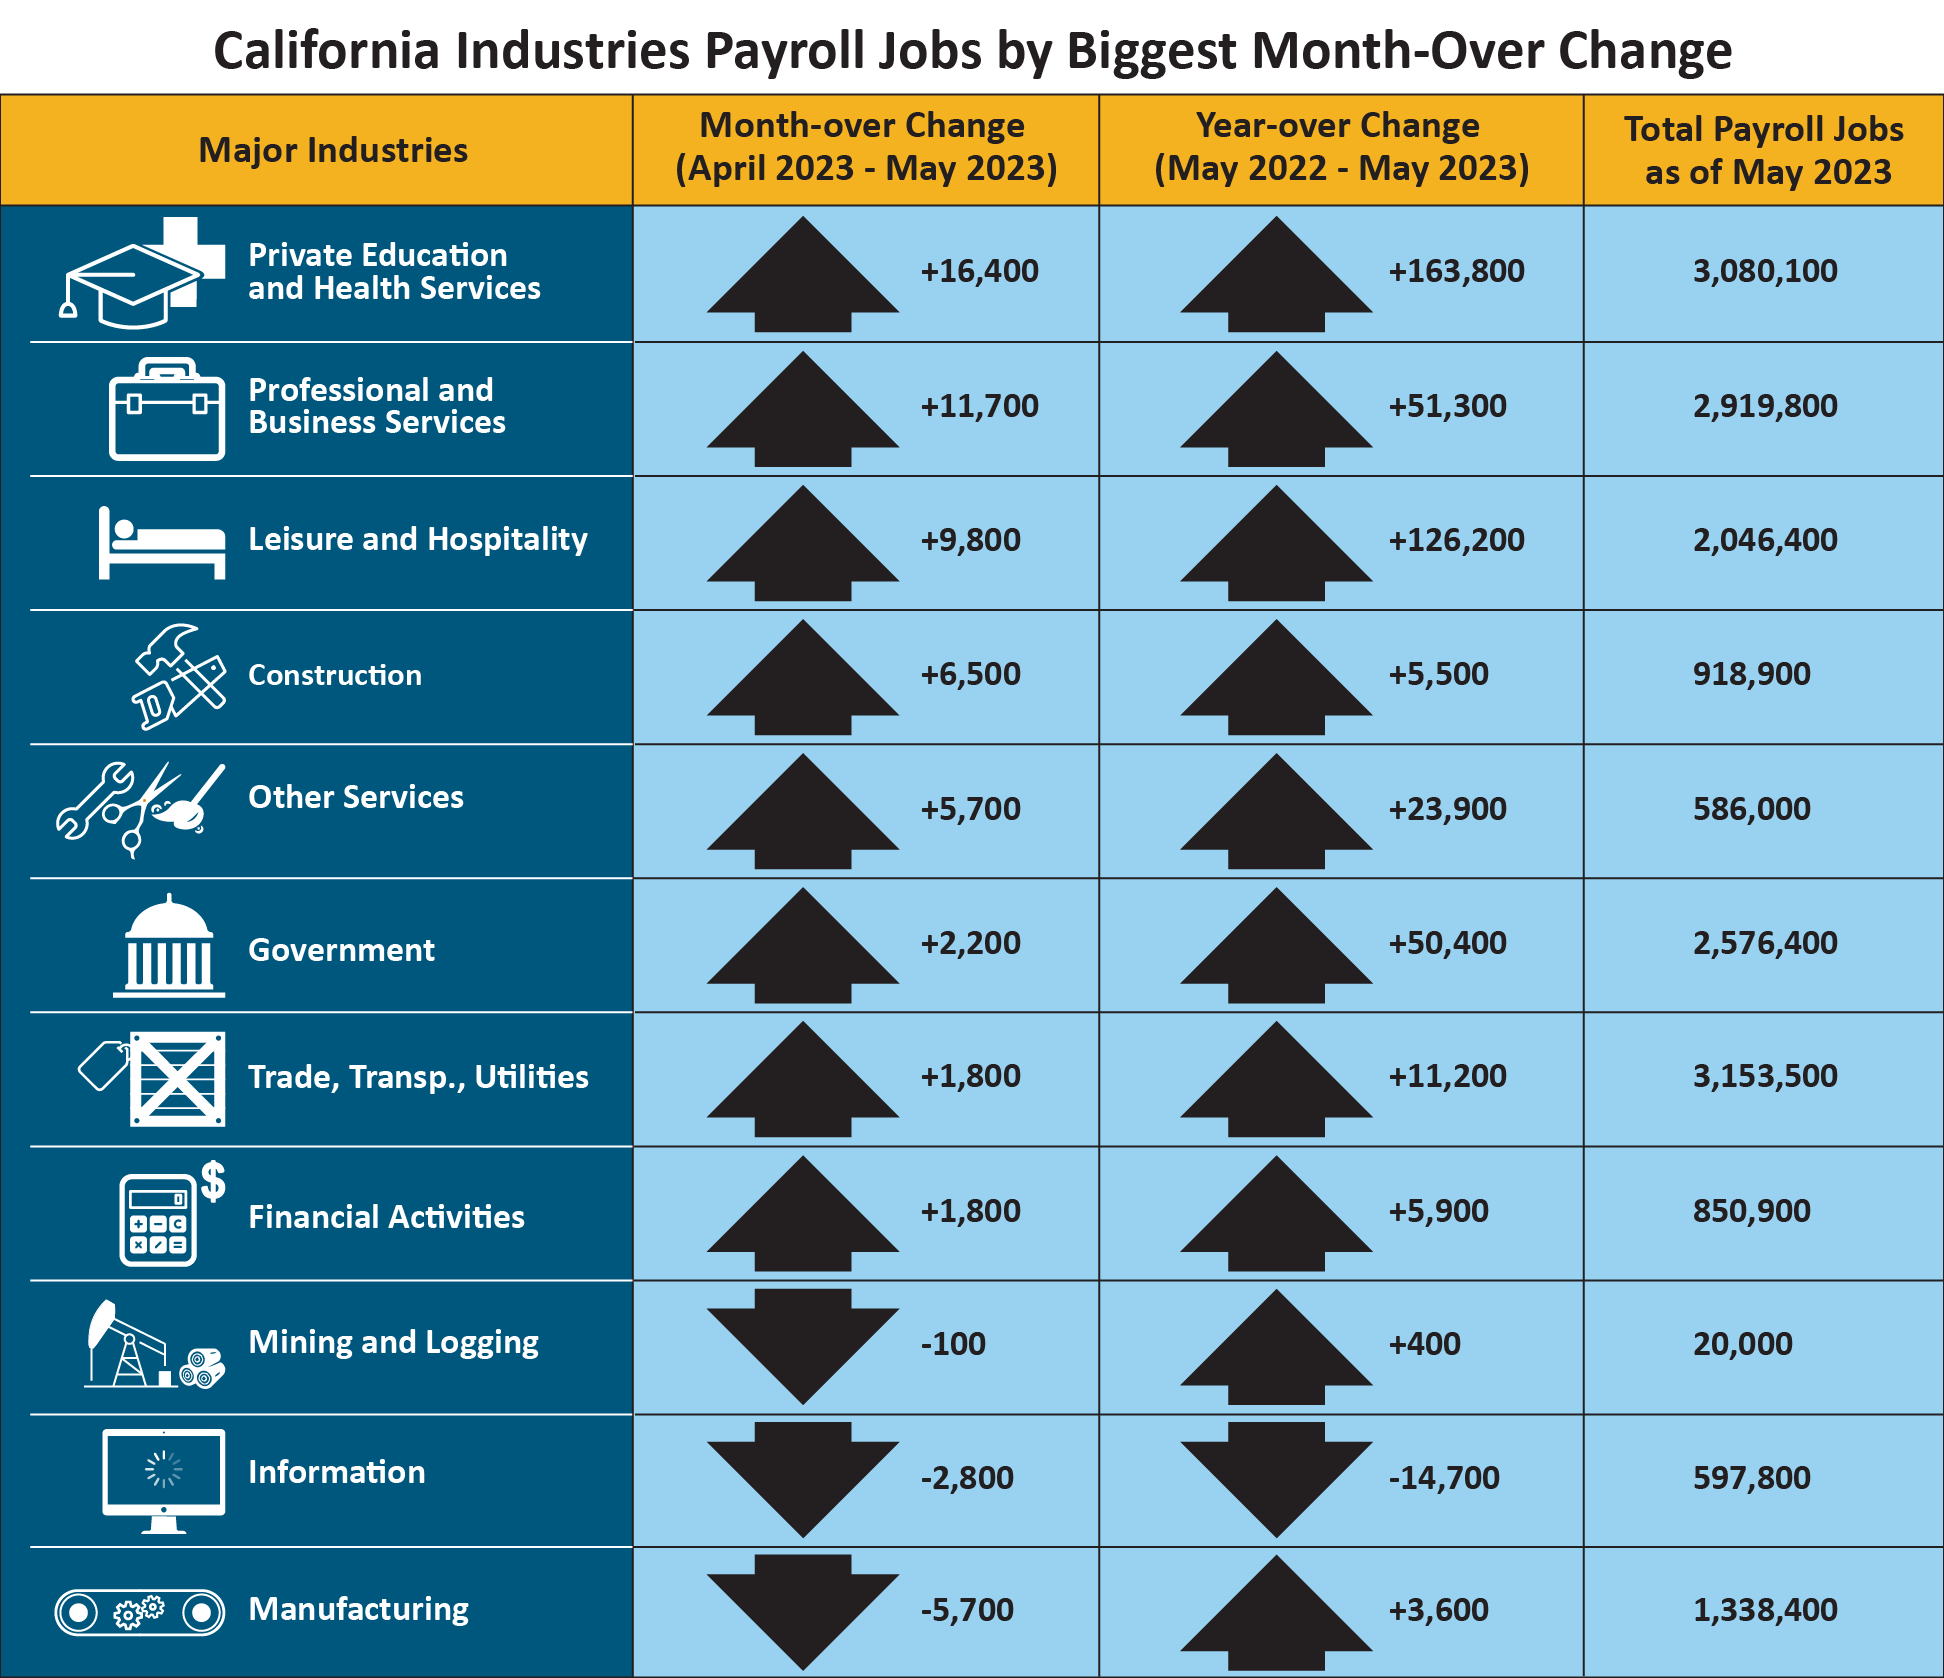
- Eight of California’s 11 industry sectors gained jobs in May with Private Education and Health Services (+16,400) leading the way thanks to above average gains in General Medical and Surgical Hospitals, Nursing Care Facilities, and Individual and Family Services industry groups.
- Professional and Business Services (+11,700) enjoyed the second-strongest month-over increase as Computer Systems Design and Related Services, Scientific Research and Development, Employment Services, and Services to Buildings and Dwellings contributed to the gain.
- Manufacturing (-5,700) suffered the largest month-over job reduction due, in part, to losses in Computer and Electronic Manufacturing, as well as losses in Fabricated Metal Manufacturing, Machine Manufacturing, and Apparel Manufacturing.
1. The unemployment rate comes from a separate federal survey of 5,100 California households.
2. The nonfarm payroll job numbers come from a federal survey of 80,000 California businesses.
Data Trends about Jobs in the Economy
Total Nonfarm Payroll Jobs (Comes from a monthly survey of approximately 80,000 California businesses that estimates jobs in the economy – seasonally adjusted)
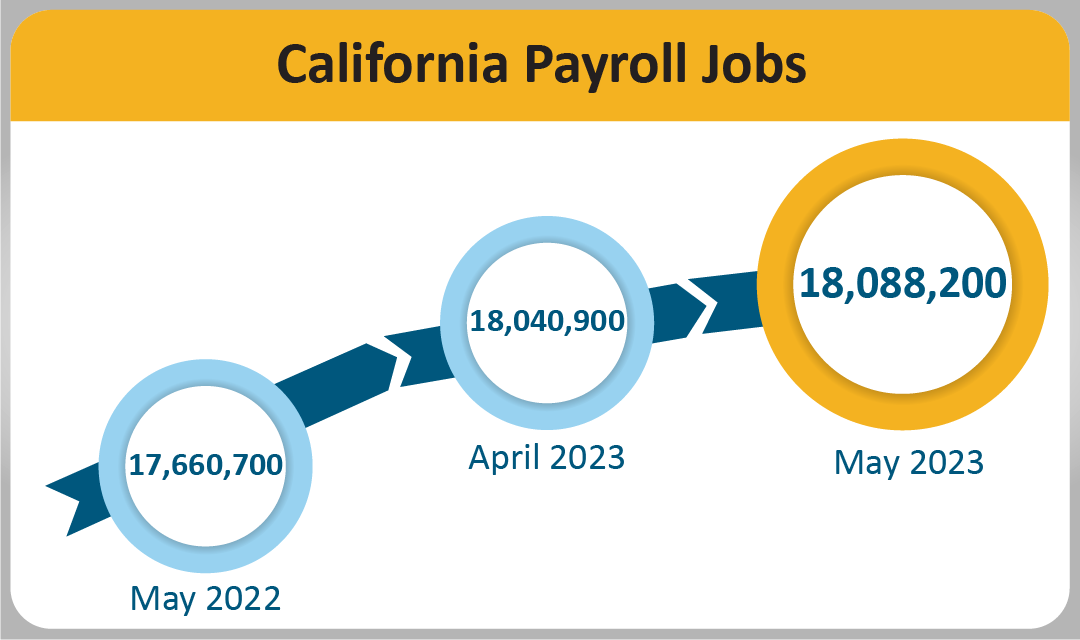
- Month-over – Total nonfarm jobs in California’s 11 major industries totaled 18,088,200 in May – a net gain of 47,300 from April. This followed an upward revised (+2,900) month-over gain of 69,900 jobs in April.
- Year-over – Total nonfarm jobs increased by 427,500 (a 2.4 percent increase) from May 2022 to May 2023 compared to the U.S. annual gain 4,063,000 jobs (a 2.7 percent increase).
Total Farm jobs – The number of jobs in the agriculture industry decreased from April by 3,700 to a total of 429,100 jobs in May. The agricultural industry had 11,700 more farm jobs in May 2023 than it did in May a year ago.
Data trends about Workers in the Economy
Employment and Unemployment in California (Based on a monthly federal survey of 5,100 California households which focuses on workers in the economy)
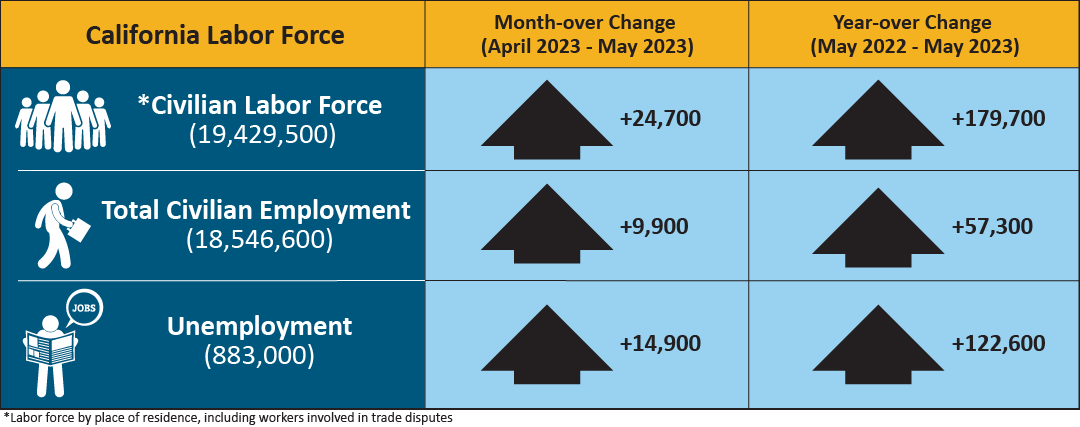
- Employed – The number of Californians employed in May was 18,546,600, an increase of 9,900 persons from April’s total of 18,536,700 and also up 57,300 from the employment total in May
- Unemployed – The number of unemployed Californians was 883,000 in May, an increase of 14,900 over the month and up 122,600 in comparison to May 2022.
Unemployment Insurance Claims (not seasonally adjusted)
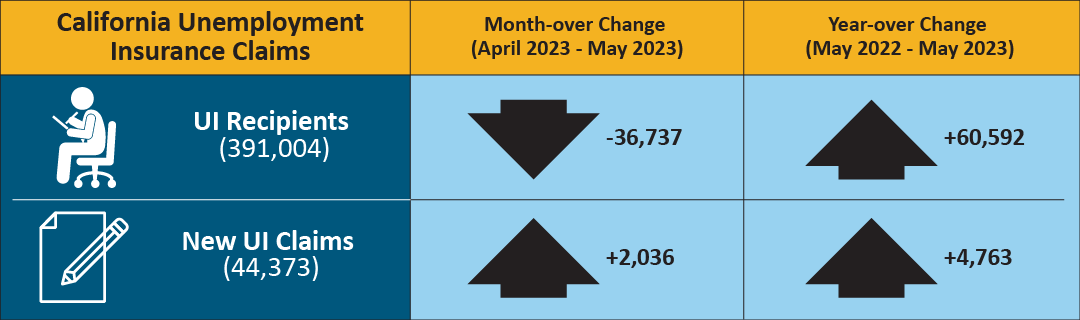
The following data is from a sample week that includes the 19th of each month: In related data that figures into the state’s unemployment rate, there were 391,004 people certifying for Unemployment Insurance benefits during the May 2023 sample week. That compares to 427,741 people in April and 330,412 people in May 2022. Concurrently, 44,373 initial claims were processed in the May 2023 sample week, which was a month-over increase of 2,036 claims from April and a year-over increase of 4,763 claims from May 2022.
| COUNTY | LABOR FORCE | EMPLOYMENT | UNEMPLOYMENT | RATE |
|---|---|---|---|---|
| STATE TOTAL | 19,308,000 | 18,443,400 | 864,600 | 4.5% |
| ALAMEDA | 827,400 | 797,000 | 30,400 | 3.7% |
| ALPINE | 490 | 460 | 30 | 6.9% |
| AMADOR | 14,310 | 13,620 | 690 | 4.8% |
| BUTTE | 92,200 | 87,700 | 4,500 | 4.9% |
| CALAVERAS | 22,040 | 21,190 | 860 | 3.9% |
| COLUSA | 10,290 | 8,910 | 1,390 | 13.5% |
| CONTRA COSTA | 551,300 | 530,700 | 20,600 | 3.7% |
| DEL NORTE | 9,200 | 8,680 | 520 | 5.7% |
| EL DORADO | 93,800 | 90,400 | 3,400 | 3.6% |
| FRESNO | 465,600 | 430,700 | 34,800 | 7.5% |
| GLENN | 12,620 | 11,820 | 800 | 6.3% |
| HUMBOLDT | 59,700 | 57,200 | 2,500 | 4.3% |
| IMPERIAL | 70,800 | 59,400 | 11,300 | 16.0% |
| INYO | 8,260 | 7,970 | 290 | 3.5% |
| KERN | 397,200 | 363,000 | 34,200 | 8.6% |
| KINGS | 58,500 | 53,800 | 4,700 | 8.0% |
| LAKE | 28,030 | 26,480 | 1,550 | 5.5% |
| LASSEN | 8,810 | 8,400 | 410 | 4.6% |
| LOS ANGELES | 4,969,400 | 4,728,500 | 240,900 | 4.8% |
| MADERA | 65,800 | 60,900 | 4,800 | 7.3% |
| MARIN | 131,400 | 127,500 | 3,900 | 3.0% |
| MARIPOSA | 7,600 | 7,260 | 340 | 4.5% |
| MENDOCINO | 36,190 | 34,640 | 1,550 | 4.3% |
| MERCED | 116,700 | 105,800 | 10,800 | 9.3% |
| MODOC | 3,220 | 3,020 | 190 | 6.0% |
| MONO | 8,080 | 7,770 | 310 | 3.9% |
| MONTEREY | 236,700 | 221,800 | 14,900 | 6.3% |
| NAPA | 72,100 | 69,800 | 2,300 | 3.1% |
| NEVADA | 47,070 | 45,320 | 1,750 | 3.7% |
| ORANGE | 1,594,700 | 1,543,500 | 51,200 | 3.2% |
| PLACER | 195,100 | 188,500 | 6,600 | 3.4% |
| PLUMAS | 7,380 | 6,870 | 510 | 6.9% |
| RIVERSIDE | 1,141,800 | 1,091,600 | 50,200 | 4.4% |
| SACRAMENTO | 732,500 | 702,600 | 29,900 | 4.1% |
| SAN BENITO | 32,600 | 30,700 | 1,900 | 5.8% |
| SAN BERNARDINO | 999,500 | 956,200 | 43,400 | 4.3% |
| SAN DIEGO | 1,595,300 | 1,539,600 | 55,600 | 3.5% |
| SAN FRANCISCO | 574,900 | 557,900 | 17,000 | 3.0% |
| SAN JOAQUIN | 351,800 | 331,100 | 20,700 | 5.9% |
| SAN LUIS OBISPO | 139,900 | 135,600 | 4,200 | 3.0% |
| SAN MATEO | 454,400 | 442,100 | 12,300 | 2.7% |
| SANTA BARBARA | 225,500 | 217,600 | 7,900 | 3.5% |
| SANTA CLARA | 1,043,200 | 1,009,900 | 33,300 | 3.2% |
| SANTA CRUZ | 135,700 | 127,900 | 7,800 | 5.7% |
| SHASTA | 73,400 | 69,900 | 3,600 | 4.8% |
| SIERRA | 1,320 | 1,260 | 60 | 4.6% |
| SISKIYOU | 16,480 | 15,500 | 980 | 5.9% |
| SOLANO | 202,200 | 193,500 | 8,700 | 4.3% |
| SONOMA | 248,300 | 240,000 | 8,300 | 3.3% |
| STANISLAUS | 245,800 | 230,200 | 15,600 | 6.4% |
| SUTTER | 47,800 | 44,000 | 3,800 | 7.9% |
| TEHAMA | 25,270 | 23,820 | 1,450 | 5.7% |
| TRINITY | 4,430 | 4,190 | 240 | 5.5% |
| TULARE | 216,300 | 194,800 | 21,600 | 10.0% |
| TUOLUMNE | 19,630 | 18,700 | 930 | 4.8% |
| VENTURA | 415,800 | 400,400 | 15,400 | 3.7% |
| YOLO | 109,900 | 105,300 | 4,600 | 4.2% |
| YUBA | 32,200 | 30,200 | 2,000 | 6.2% |
