


IMPORTANT NOTE: The employment data for the month of June 2023 is taken from the survey week including June 12th. Data for the month of July is scheduled for release on Aug. 18, 2023.
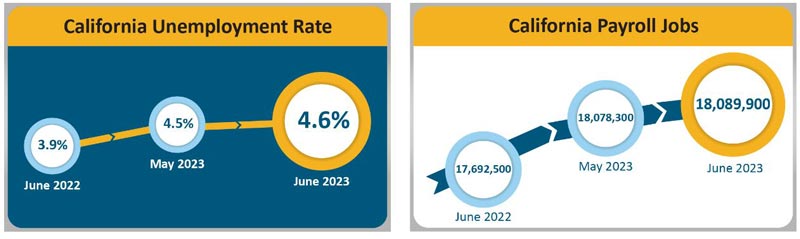
July 22, 2023 - SACRAMENTO – California’s unemployment rate increased by 0.1 percentage point from May 2023 to 4.6 percent1 for June 2023 as the state’s employers added 11,600 nonfarm payroll jobs2 to the economy, according to data released on Friday by the California Employment Development Department (EDD) from two surveys. Total nonfarm employment for May 2023 was revised down 9,900 due to adjustments in that month’s labor estimates.
California’s Labor Market, by the Numbers…
- Over the past year, California has gained 397,400 nonfarm jobs, which averages out to 33,117 jobs per month.
- California’s June nonfarm job gain was 5.6 percent of the national job gain of 209,000.
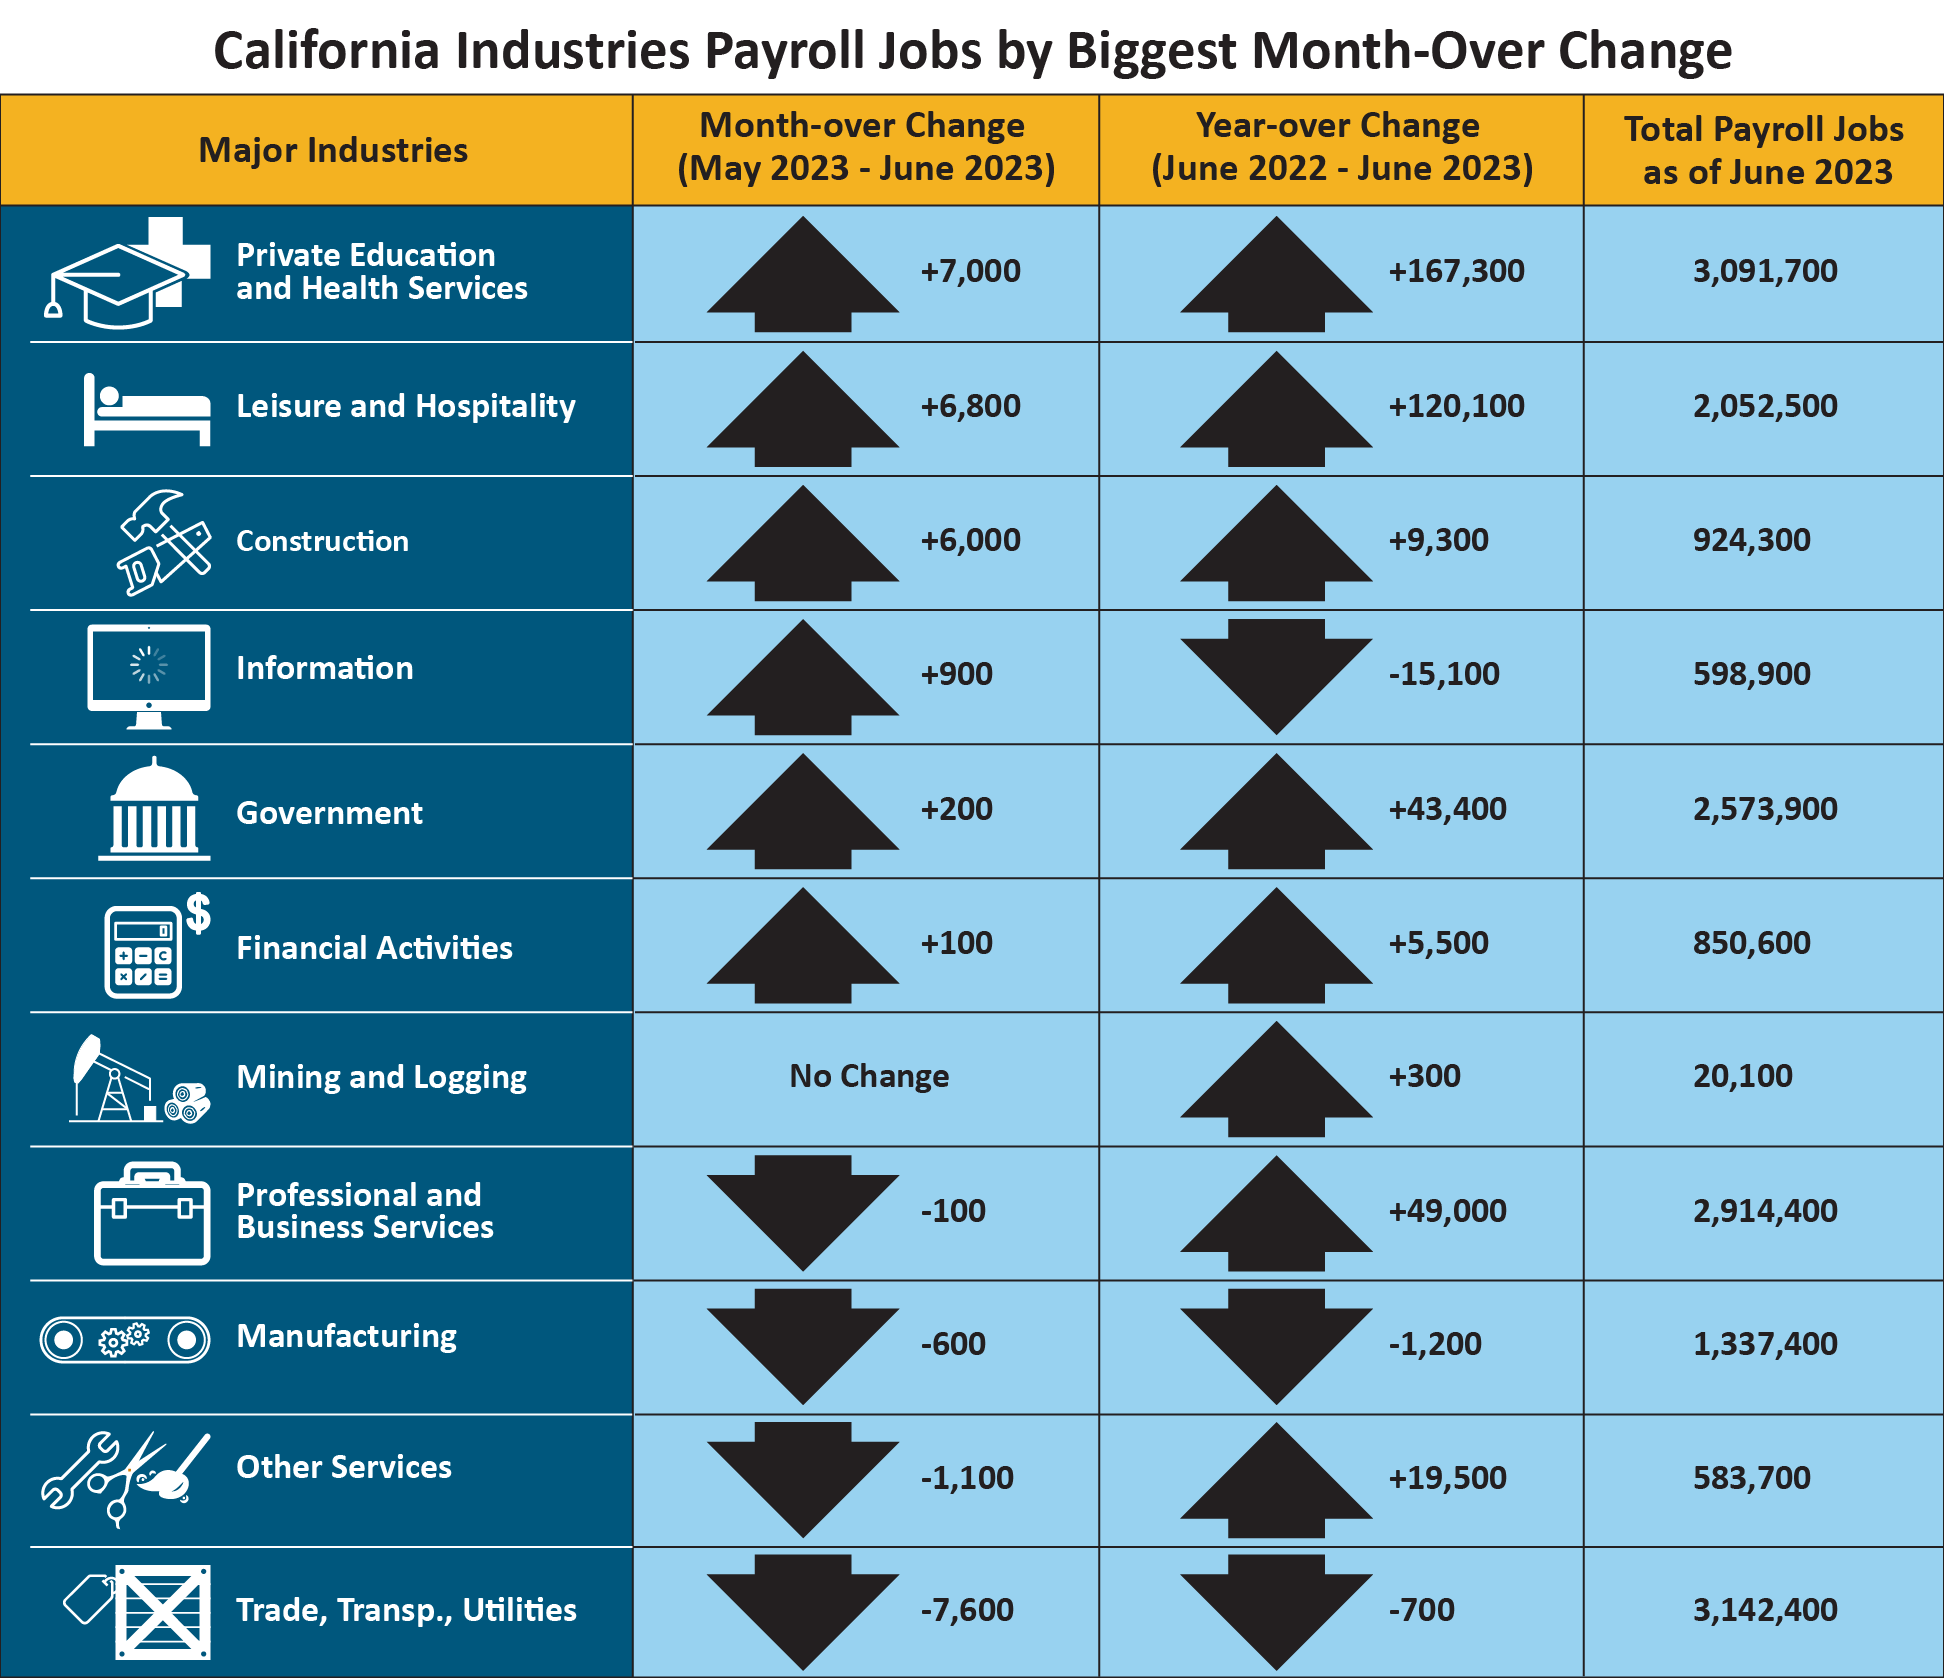
- Six of California’s 11 industry sectors gained jobs in June with Private Education & Health Services (+7,000) showing the largest gains for the second consecutive month thanks to strength in Other Private School and Instruction, as well as Offices of Other Health Practitioners and Nursing Care Facilities.
- Leisure & Hospitality (+6,800) also recorded good numbers due to above average gains in Limited-Service Restaurants and Other Eating Places.
- Trade, Transportation, & Utilities (-7,600) posted the largest month-over reduction. This was due, in part, to losses in the Merchant Wholesalers, Nondurable Goods, the Couriers and Messengers, and the Warehousing and Storage industry groups.
1. The unemployment rate comes from a separate federal survey of 5,100 California households.
2. The nonfarm payroll job numbers come from a federal survey of 80,000 California businesses.
Data Trends about Jobs in the Economy
Total Nonfarm Payroll Jobs (Comes from a monthly survey of approximately 80,000 California businesses that estimates jobs in the economy – seasonally adjusted)
- Month-over – Total nonfarm jobs in California’s 11 major industries totaled 18,089,900 in June – a net gain of 11,600 from May. This followed a downward revised (-9,900) month-over gain of 38,200 jobs in May.
- Year-over – Total nonfarm jobs increased by 397,400 (a 2.2 percent increase) from June 2022 to June 2023 compared to the U.S. annual gain of 3,792,000 jobs (a 2.5 percent increase).
Total Farm jobs – The number of jobs in the agriculture industry increased from May by 10,400 to a total of 440,500 jobs in June. The agricultural industry had 20,200 more farm jobs in June 2023 than it did in June a year ago.
Data Trends about Workers in the Economy
Employment and Unemployment in California (Based on a monthly federal survey of 5,100 California households which focuses on workers in the economy)
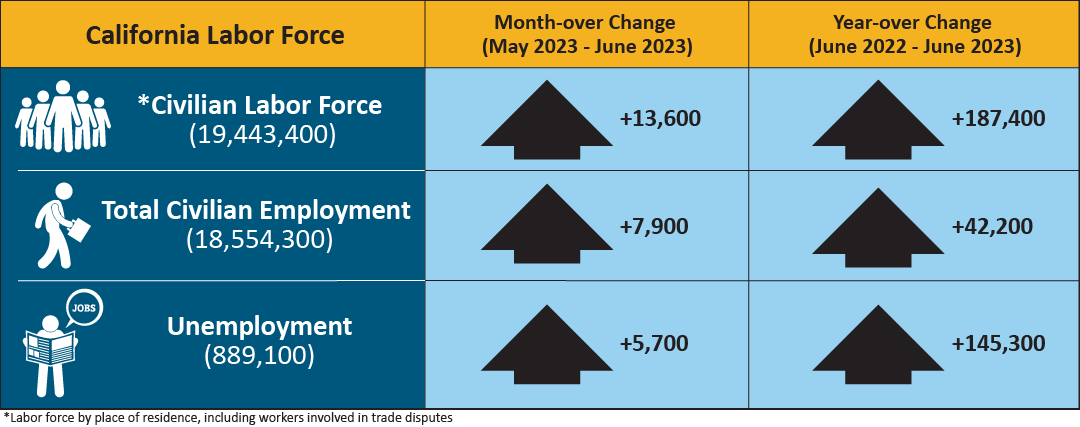
- Employed – The number of Californians employed in June was 18,554,300, an increase of 7,900 persons from May’s total of 18,546,400 and up 42,200 from the employment total in June
- Unemployed – The number of unemployed Californians was 889,100 in June, an increase of 5,700 over the month and up 143,300 in comparison to June 2022.
Unemployment Insurance Claims (Not Seasonally Adjusted)
The following data is from a sample week that includes the 19th of each month:
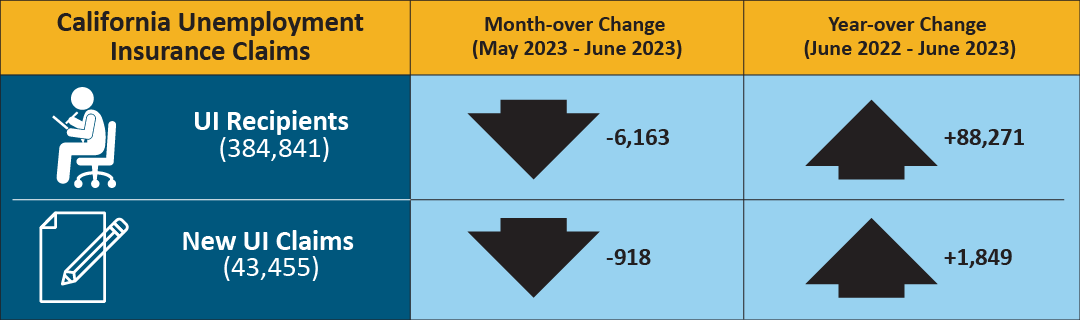
In related data that figures into the state’s unemployment rate, there were 384.841 people certifying for Unemployment Insurance benefits during the June 2023 sample week. That compares to 391,004 people in May and 296,570 people in June 2022. Concurrently, 43,455 initial claims were processed in the June 2023 sample week, which was a month-over decrease of 918 claims from May, but a year-over increase of 88,271 claims from June 2022.
.
| COUNTY | LABOR FORCE | EMPLOYMENT | UNEMPLOYMENT | RATE |
|---|---|---|---|---|
| STATE TOTAL | 19,307,000 | 18,363,500 | 943,500 | 4.9% |
| ALAMEDA | 824,300 | 790,000 | 34,300 | 4.2% |
| ALPINE | 500 | 460 | 40 | 7.1% |
| AMADOR | 14,460 | 13,760 | 700 | 4.8% |
| BUTTE | 90,800 | 85,900 | 4,900 | 5.4% |
| CALAVERAS | 22,200 | 21,320 | 890 | 4.0% |
| COLUSA | 10,230 | 8,990 | 1,240 | 12.2% |
| CONTRA COSTA | 549,500 | 526,200 | 23,300 | 4.2% |
| DEL NORTE | 9,350 | 8,820 | 530 | 5.6% |
| EL DORADO | 93,500 | 89,800 | 3,700 | 3.9% |
| FRESNO | 461,200 | 426,600 | 34,500 | 7.5% |
| GLENN | 12,540 | 11,730 | 810 | 6.5% |
| HUMBOLDT | 59,500 | 56,700 | 2,800 | 4.7% |
| IMPERIAL | 70,700 | 58,800 | 11,900 | 16.9% |
| INYO | 8,290 | 7,980 | 320 | 3.8% |
| KERN | 395,100 | 360,200 | 34,900 | 8.8% |
| KINGS | 57,300 | 52,500 | 4,800 | 8.4% |
| LAKE | 27,820 | 26,280 | 1,540 | 5.5% |
| LASSEN | 8,750 | 8,340 | 410 | 4.7% |
| LOS ANGELES | 5,024,300 | 4,758,700 | 265,500 | 5.3% |
| MADERA | 64,000 | 59,100 | 4,900 | 7.7% |
| MARIN | 131,300 | 126,800 | 4,500 | 3.4% |
| MARIPOSA | 7,720 | 7,380 | 340 | 4.4% |
| MENDOCINO | 36,490 | 34,830 | 1,660 | 4.6% |
| MERCED | 116,100 | 105,100 | 11,000 | 9.5% |
| MODOC | 3,260 | 3,090 | 170 | 5.3% |
| MONO | 8,680 | 8,350 | 330 | 3.8% |
| MONTEREY | 236,800 | 223,800 | 13,000 | 5.5% |
| NAPA | 72,100 | 69,600 | 2,500 | 3.5% |
| NEVADA | 46,980 | 45,100 | 1,880 | 4.0% |
| ORANGE | 1,583,600 | 1,525,300 | 58,400 | 3.7% |
| PLACER | 194,500 | 187,100 | 7,400 | 3.8% |
| PLUMAS | 7,530 | 7,080 | 450 | 6.0% |
| RIVERSIDE | 1,135,600 | 1,078,700 | 57,000 | 5.0% |
| SACRAMENTO | 730,300 | 697,300 | 33,000 | 4.5% |
| SAN BENITO | 32,600 | 30,700 | 1,900 | 5.8% |
| SAN BERNARDINO | 992,800 | 943,800 | 49,000 | 4.9% |
| SAN DIEGO | 1,592,300 | 1,529,100 | 63,200 | 4.0% |
| SAN FRANCISCO | 575,900 | 557,400 | 18,600 | 3.2% |
| SAN JOAQUIN | 342,900 | 321,100 | 21,800 | 6.4% |
| SAN LUIS OBISPO | 139,800 | 134,900 | 5,000 | 3.5% |
| SAN MATEO | 455,700 | 441,800 | 13,900 | 3.1% |
| SANTA BARBARA | 229,200 | 220,600 | 8,700 | 3.8% |
| SANTA CLARA | 1,045,600 | 1,007,700 | 38,000 | 3.6% |
| SANTA CRUZ | 135,500 | 128,400 | 7,100 | 5.3% |
| SHASTA | 72,700 | 69,100 | 3,700 | 5.0% |
| SIERRA | 1,380 | 1,320 | 50 | 3.9% |
| SISKIYOU | 16,770 | 15,780 | 990 | 5.9% |
| SOLANO | 200,900 | 191,500 | 9,400 | 4.7% |
| SONOMA | 248,800 | 239,500 | 9,300 | 3.7% |
| STANISLAUS | 243,300 | 226,700 | 16,600 | 6.8% |
| SUTTER | 47,700 | 44,100 | 3,600 | 7.6% |
| TEHAMA | 25,400 | 23,820 | 1,580 | 6.2% |
| TRINITY | 4,550 | 4,310 | 240 | 5.3% |
| TULARE | 213,000 | 191,400 | 21,500 | 10.1% |
| TUOLUMNE | 20,090 | 19,110 | 980 | 4.9% |
| VENTURA | 412,600 | 395,200 | 17,400 | 4.2% |
| YOLO | 109,800 | 104,500 | 5,300 | 4.8% |
| YUBA | 32,200 | 30,000 | 2,100 | 6.6% |
