


California and National Drought Summary for August 22, 2023
Summary
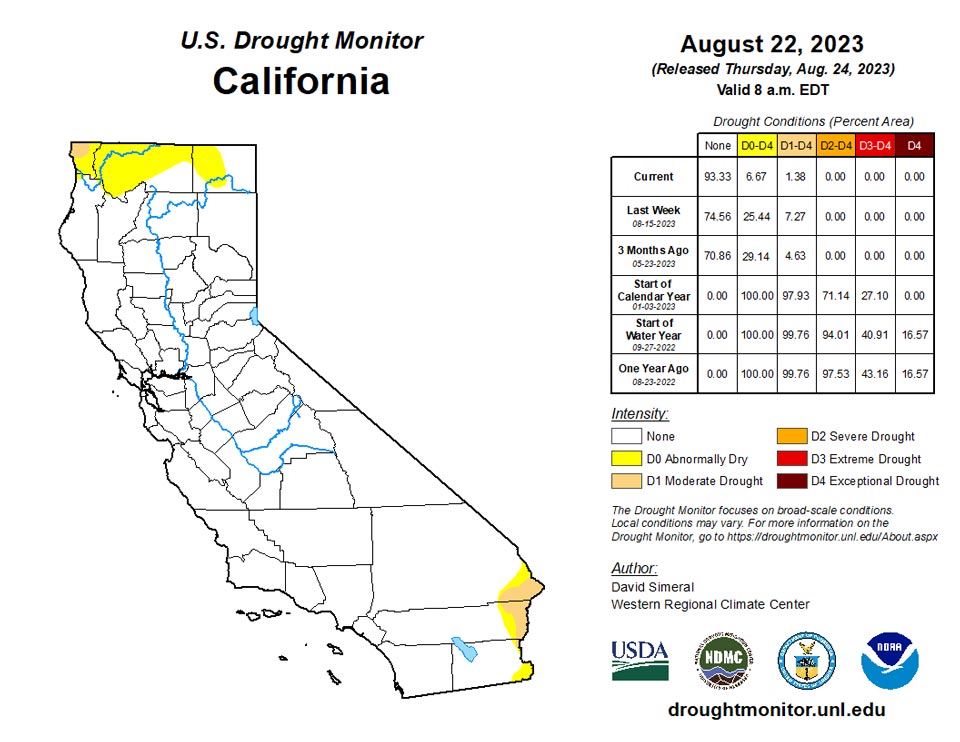
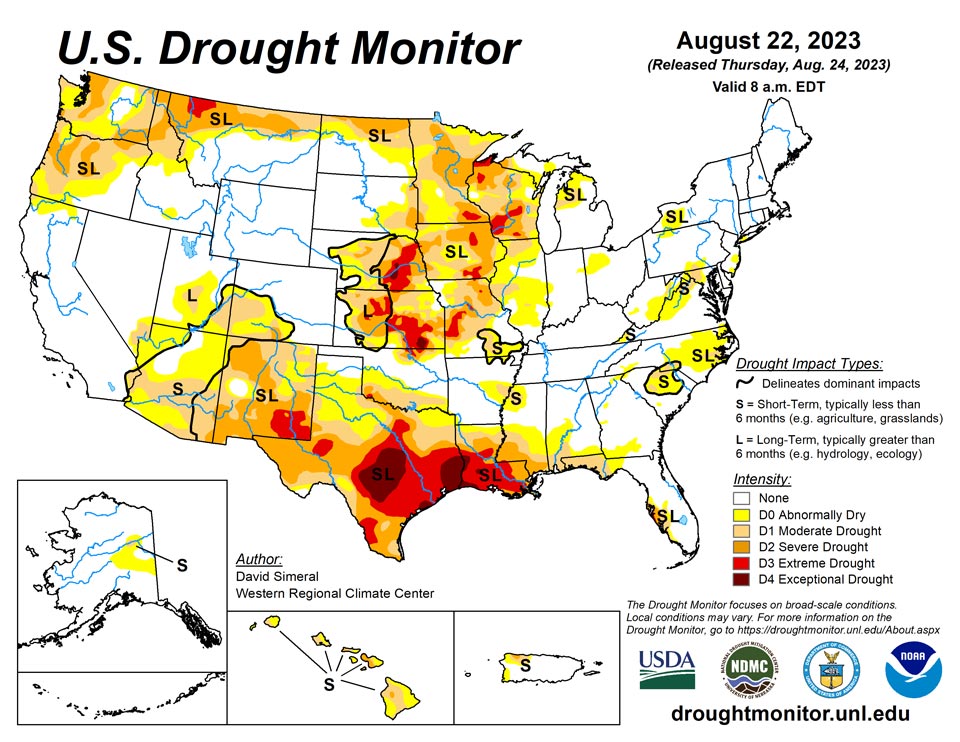
August 24, 2023 - This U.S. Drought Monitor (USDM) week saw drought-related improvements on the map across southern portions of California and Nevada in association with the impacts of Tropical Storm Hilary, which made landfall in Southern California over the weekend and into Monday. The tropical storm, the first to make landfall in Southern California since 1939, brought record-breaking rainfall accumulations leading to widespread life-threatening flash flooding, mud and rockslides, and debris flows to parts of the region. Rainfall totals for the event ranged from 2 to 12 inches with the heaviest accumulations observed in higher elevations including the San Gabriel and San Bernardino Ranges, southern Sierra Nevada, Panamint Range in Death Valley National Park, and in the Spring Mountains near Las Vegas. In terms of the urban areas, the Los Angeles Basin received totals ranging from 2 to 5 inches, while the greater San Diego area received 1 to 3 inches and Palm Springs 2 to 4 inches. The rainfall led to removal of lingering areas of drought across the Mojave Desert and southern Nevada. In the Southwest, conditions in New Mexico saw statewide degradation on the map in response to a combination of both short- and long-term dryness across the state, including a weak monsoon season with 60-day rainfall deficits ranging from 2 to 6-inches. In the South, drought-related conditions have deteriorated rapidly during the past month across areas of Texas and Louisiana where persistent heat and rainfall shortfalls have led to drought expansion and intensification on the map this week. During the past two weeks, average maximum temperatures were 6 to 10+ degrees F above normal across Texas, southern Oklahoma, Louisiana, and southern Mississippi with reports of impacts related to human health as well as severe impacts to agriculture, vegetation health, and surface water conditions. Looking at the latest climatological data released by NOAA NCEI (through July 2023), Louisiana Climate Division 7 (Southwest Louisiana) observed its warmest May-July period on record, while Texas Climate Division 8 (Upper Coast) experienced its warmest June-July period on record. In the Midwest, continued areas of dryness led to degradations in portions of Minnesota, Iowa, and Wisconsin. In the Eastern Tier, some minor deterioration in drought-related conditions occurred in areas of the Carolinas as well as in the Panhandle of Florida.
Northeast
For the week, only minor degradations were made on the map including in West Virginia where an area of Moderate Drought (D1) was introduced as well as expansion of areas of Abnormally Dry (D0) in response to short-term (past 30-day period) rainfall deficits (ranging from 1 to 3 inches) and numerous observed low streamflow levels (<20th percentile). Elsewhere, minor improvements were made to areas of Abnormally Dry (D0) in western Pennsylvania and western New York where precipitation has been slightly above normal during the past 60-day period. For the week, average temperatures ranged from 1 to 5 degrees F below normal across most of the region except for areas of Maine which experienced temperatures 1 to 5+ degrees F above normal. In terms of precipitation for the week, the region was somewhat dry except for some light precipitation accumulations (<1.5 inches) across parts of New England as well as an isolated area in Upstate New York which received some heavier accumulations (2 to 4 inches).
Southeast
During the past week, light to moderate rainfall accumulations (ranging from 1 to 4 inches) were observed across areas of the region with the highest accumulations observed in isolated coastal areas of the Carolinas and in west-central and southern Florida. This week’s rainfall led to minor improvements on the map in areas of North Carolina and Florida, while conditions deteriorated on the map in inland areas of the Carolinas as well as in Georgia, Alabama, and Florida. In the Florida Panhandle, areas of Moderate Drought (D1) were introduced to reflect short-term precipitation deficits (past 60-days) and declining streamflow levels. Average temperatures across the region were above normal (1 to 6 degrees F), with the greatest departures observed in eastern portions of North Carolina, while cooler than normal temperatures prevailed in northern portions of Alabama and Georgia (1 to 5 degrees F).
South
In the South, drought-related conditions continued to deteriorate as the hot and dry pattern continued across most of the region. Many impact reports came in this week emphasizing the rate at which the impact of the persistent heat is taking its toll. In both Louisiana and areas of Texas, numerous impacts are being observed including declining soil moisture, poor vegetation health, impacts within the agricultural sector, and poor surface and groundwater conditions. The combination of these factors led to expansive deterioration on the map in areas of Texas, Louisiana, and southern Oklahoma including expansion of areas of Extreme Drought (D3) and the introduction of Exceptional Drought (D4). For the week, average temperatures across the region were above normal with Louisiana, Oklahoma, and Texas observing temperatures ranging from 4 to 10+ degrees F above normal. Conversely, temperatures were near to slightly below normal across northern portions of Arkansas, Mississippi, and Tennessee. In terms of precipitation, the region was very dry except for some isolated areas of South Texas and southeastern Louisiana which received light accumulations.
Midwest
For the week, light precipitation accumulations (<2 inches) were observed across areas of northern Wisconsin, Upper Peninsula Michigan, and northern Michigan. On the map, degradations were made in areas of Minnesota, Wisconsin, and Illinois where both short- and long-term precipitation deficits persist. Conversely, rainfall during the past 30-60-day period and improving soil moisture and surface water conditions led to removal of areas of Moderate Drought (D1) and Severe Drought (D2) in Michigan. Average temperatures for the week were below normal (1 to 3 degrees F) across much of the region except for areas of southern Missouri, southern Illinois, and central Wisconsin where temperatures were a few degrees above normal.
High Plains
On this week’s map, no changes were made across the Plains states while some minor improvements were made in northwestern Wyoming and some degradations in south-central Colorado. Across the Plains, hot and dry conditions prevailed across much of the region this week with well-above normal temperatures (2 to 8 degrees F) observed, except for areas of the Dakotas where temperatures were a few degrees below normal. In terms of the overall drought situation, the past 60-day period has been marked with some improvements in response to above-normal precipitation across areas of Kansas and Nebraska. However, the longer-term dry signal has remained intact across areas of the region and continues to be reflected in various drought indicators including soil moisture and streamflow levels.
West
On the map, widespread improvements were made in drought-affected areas of southern California and Nevada in response to heavy rainfall accumulations associated with Tropical Storm Hilary and its remnant moisture that pushed northward across the Mojave Desert, Great Basin, and into the Pacific Northwest. The severe weather event helped to eliminate areas of lingering drought on the map across the Mojave Desert and in areas of southern Nevada. Likewise, conditions improved on the map in west-central Idaho and northeastern Oregon in response to this week’s rainfall. Conversely, continued dryness and below-normal streamflow activity led to an introduction of Extreme Drought (D3) in the Northern Rockies around Glacier National Park where streamflows on the North Fork of the Flathead River at Columbia Falls, Montana were in the 4th percentile. In north-central Montana, areas of Severe Drought (D2) expanded on the map due to a combination of factors including dry soils and below-normal precipitation during the past 60-day period. In the Four Corners states, the poor monsoon season and related precipitation shortfalls led to introduction of areas of Moderate Drought (D1) in southern and central Arizona as well as in south-central Colorado in the San Luis Valley. In New Mexico, the combination of short- and long-term precipitation deficits, poor soil moisture, and rangeland conditions led to widespread deterioration on the map across much of the state.
Caribbean
In Puerto Rico, areas of Severe Drought (D2) and Moderate Drought (D1) were trimmed back on the map in response to heavy rainfall in association with moisture from Tropical Storm Franklin.
Precipitation varied across portions of the U.S. Virgin Islands this week. The satellite data (i.e., National Weather Service’s seven-day quantitative precipitation estimates) and station observations show that the rainfall amount varied across the islands, with rainfall totals ranging from 0.50 to 2.72 inches. Standardized Precipitation Index (SPI) maps showed that conditions remain dry at St. Thomas, St. John and St. Croix this week.
Specifically, St. John (Rafe Boulon/Windswept Beach) reported 0.82 inch of rain this week. The depth to water level at Susannaberg DPW 3 well (St. John, USVI) on August 22 was 19.54 ft below land surface. The analysis showed a significant decrease in water level (about 12 ft) since November 25, when it was 7.54 ft below land surface. This week’s 6-month and 9-month SPI also confirms dry conditions persist on the island, so St. John remained in short- and long-term moderate drought (D1-SL) this week.
St. Croix (Henry Rohlsen AP) reported 1.53 inches of rain this week. The depth to water level at Adventure 28 Well (St. Croix, USVI) on August 22 was 33.03 ft below land surface. The analysis showed a significant decrease in water level (more than 8 ft) since November 25, when it was 25.04 ft below land surface. This week’s 6-month, 9-month and 12-month SPI also confirms dry conditions persist on the island, so St. Croix remained in short- and long-term extreme drought (D3-SL) this week.
St. Thomas (Cyril E. King Airport) received 0.55 inch of rain this week. The depth to water level at Grade School 3 well (St. Thomas, USVI) on August 22 was 8.96 ft below land surface. This is an increase of 7.69 feet since August 6th. SPI at all available timescales (1-, 3-, 6-, 9- & 12-month) also confirms dry conditions persist on the island, so St. Thomas remained in short- and long-term extreme drought (D3-SL) this week.
Pacific
In Alaska, improving conditions led to removal of Moderate Drought (D1) in the Central Interior, while D1 expanded slightly in the western Yukon Flats. Moreover, rainfall observed last week led to trimming back of areas of Abnormally Dry (D0) in the Tanana-Yukon Uplands.
For the Hawaiian Islands, drought-related conditions deteriorated on the map in areas of Maui, Molokai, Oahu, and Kauai in response to short-term rainfall deficits, low streamflows, and stressed vegetation. Elsewhere, the Big Island remained status quo for the week after receiving beneficial rainfall in association with remnant moisture from Hurricane Fernanda, which passed to the south of the Big Island on Monday bringing 2- to 4-inch accumulations to the windward side of the island. Similarly, 1- to 2-inch accumulations were observed in East Maui; however, other areas of the island continued to experience rainfall deficits leading to expansion of areas of Severe Drought (D2).
Dry conditions continued on American Samoa this week, with weekly rainfall amounts of 0.36 inch at Pago Pago, 0.26 inch at Siufaga Ridge and 0.22 inch at Toa Ridge. American Samoa remained in short-term abnormal dryness this week.
Palau remained free of drought or abnormal dryness this week, with reported rainfall totals of 4.12 inches at Palau Airport and 3.90 inches at Koror.
The Mariana Islands remained free of drought or abnormal dryness this week. Rota reported 4.16 inches of precipitation this week, while Guam and Saipan totaled 1.88 and 0.88 inches, respectively.
Wet weather continued across much of Micronesia. Nukuoro had a weekly rainfall amount of 4.19 inches, while Ulithi, Kosrae, Chuuk, Lukunoch, Woleai and Pohnpei reported rainfall totals of 3.64, 3.13, 2.94, 2.92, 2.76 and 2.16 inches, respectively. These locations remained drought free this week. Wet conditions were also observed on Fananu with 2.06 inches of rain this week but remained in short-term abnormal dryness due to previous dry weeks and months. Drier conditions were observed on Kapingamarangi and Yap, reporting 1.06 inches and 0.42 inch of rainfall this week. These locations were below the weekly threshold but remained drought free due to previous weeks and/or months being wet. Only 0.93 inch of rain has fallen on Pingelap this week, marking the third consecutive week below the weekly threshold. Therefore, Pingelap was degraded to short-term abnormal dryness.
Rainfall varied across much of the Marshall Islands this week. A weekly rainfall total of 3.34 inches fell on Majuro, while Jaluit and Mili each received rainfall amounts greater than 2 inches (2.64 and 2.83 inches) and remained free of drought and abnormal dryness this week. Dryness continues on Ailinglapalap with 1.65 inches of rainfall, marking the second consecutive week of below-normal precipitation. However, Ailinglapalap remains free of drought or abnormal dryness due wetter conditions from previous weeks and months. Dry conditions continued on Kwajalein with 0.29 inch of rainfall this week, while no rainfall was reported for Wotje. Kwajalein and Wotje remain in short-term abnormal dryness this week. No depiction was made for Utirik due to missing data.
Looking Ahead
The NWS WPC 7-Day Quantitative Precipitation Forecast (QPF) calls for light-to-moderate precipitation accumulations ranging from 1 to 3+ inches across portions of the Four Corners states as well as areas of Far West Texas. Likewise, similar accumulations are expected across areas of the Southeast, Mid-Atlantic, and the Northeast. In the eastern and northern portions of the Midwest, lighter accumulations (< 1 inch) are forecasted. The CPC 6-10Day Outlooks call for a moderate-to-high probability of above-normal temperatures across much of the conterminous U.S. including the West, South, Southeast, Plains states, and western portions of the Midwest. Conversely, below-normal temperatures are expected across the Lower Midwest, Mid-Atlantic, and the Northeast. In terms of precipitation, below-normal precipitation is expected across the Plains states, Midwest, and far western extent of the Northeast, while above-normal precipitation is forecasted for much of the western U.S. and across much of the Eastern Seaboard.
Author(s):
David Simeral, Western Regional Climate Center
Rocky Bilotta, NOAA/NCEI
Dryness Categories
D0 Abnormally Dry—used for areas showing dryness but not yet in drought, or for areas recovering from drought.
Drought Intensity Categories
D1 Moderate Drought
D2 Severe Drought
D3 Extreme Drought
D4 Exceptional Drought
Drought or Dryness Types
S Short-term, typically less than 6 months (agriculture, grasslands)
L Long-term, typically more than 6 months (hydrology, ecology)
SL Area contains both short- and long-term impacts
Source: National Drought Mitigation Center
