


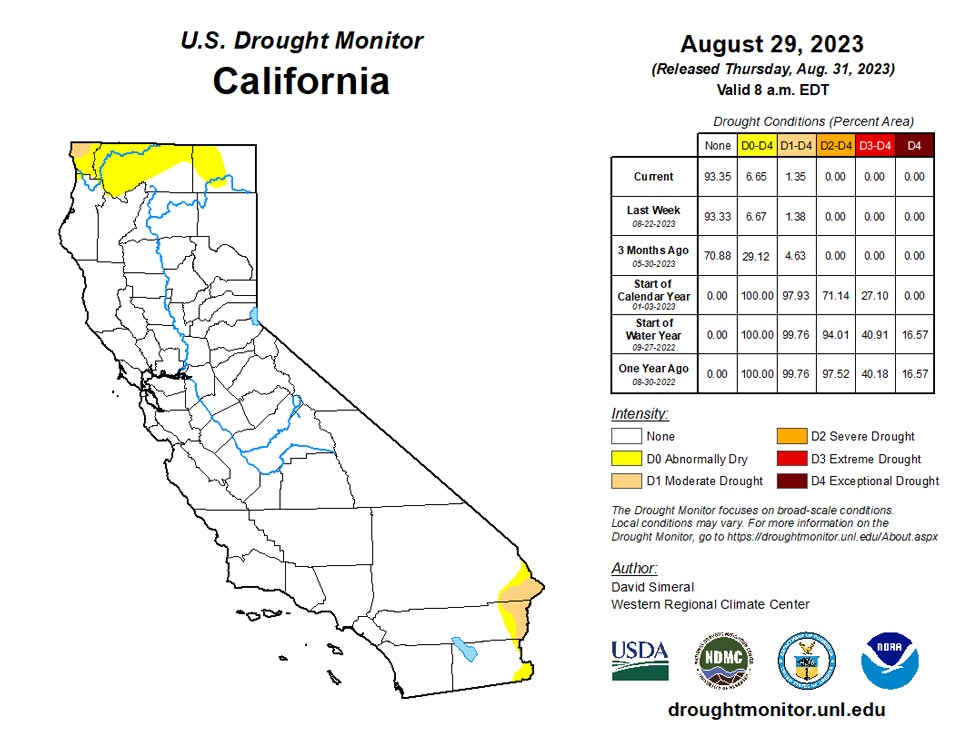
California and National Drought Summary for August 29, 2023
Summary
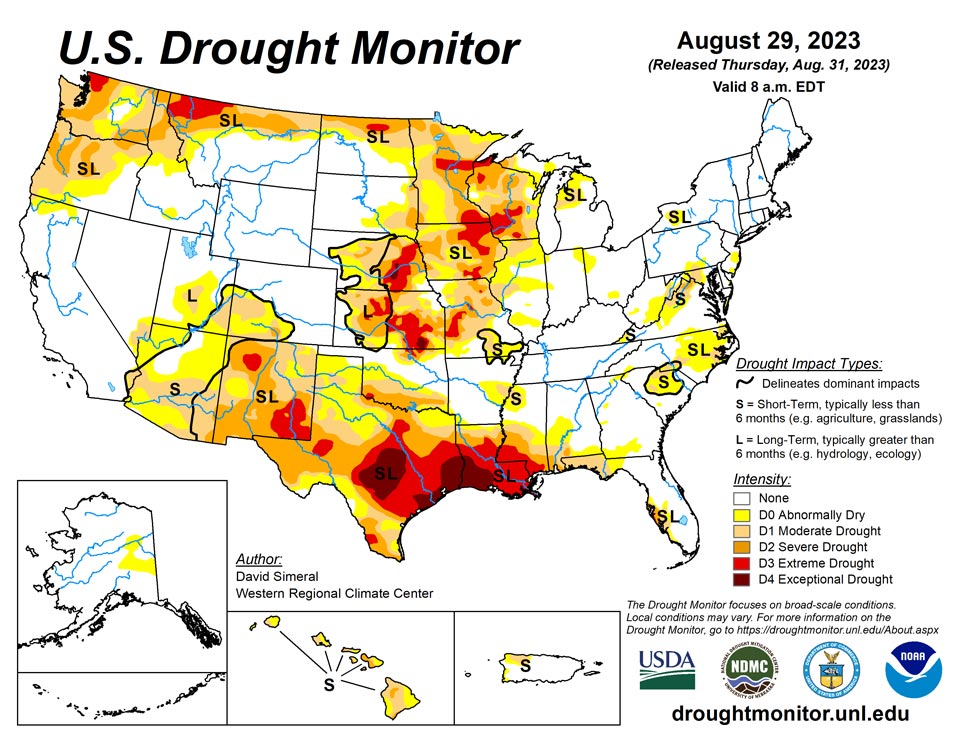
August 31, 2023 - This U.S. Drought Monitor (USDM) week saw continued intensification of drought across areas of the Midwest, South, Southwest, and the Pacific Northwest. In the Midwest, extreme heat impacted areas of the region including Minnesota, Iowa, Missouri, Wisconsin, and Illinois with temperatures soaring 6 to 10+ degrees F above normal. Daily high temperature records were broken across the region during the past week including in Chicago (98), Milwaukee (101), Minneapolis (101), and Des Moines (100). Similarly, areas of the South including the northern Gulf Coast of Texas, Louisiana, and southern Mississippi saw continued drought-related deterioration on this week’s map as the heatwave continued to push high temperatures over 100 degrees F with numerous records broken during the past week. Record daily highs were set or tied in various southern cities including Houston (109), San Antonio (104), Austin (107), Dallas (109), Baton Rouge (106), New Orleans (103), Jackson (106), and Mobile (101). In Louisiana and southern Mississippi, the continued hot and dry conditions have led to numerous wildfire outbreaks as well as widespread poor hydrologic conditions and severe impacts within the agricultural sector. In the Southwest, monsoon precipitation has been well below normal across much of the region with areas of southern Arizona and New Mexico reporting rainfall deficits ranging from 3 to 6 inches since the beginning of July. In the Pacific Northwest, areas of drought expanded on the map in Oregon, Washington, and Montana in response to a combination of above-normal temperatures over the past 90-day period, precipitation shortfalls, and poor surface water conditions. Conversely, some areas saw improved drought-related conditions on the map, including southern Texas where heavy rains, in association with Tropical Storm Harold last week, provided much-needed moisture to the region. Rainfall accumulations along the southern Gulf Coast and South Texas Plains regions ranged from 2 to 6 inches. In the Southeast, areas of Florida braced themselves for the impacts of Hurricane Idalia as it intensified rapidly early this week. The hurricane made landfall in the Big Bend region of Florida early Wednesday morning (8/30) as a dangerous Category3 hurricane bringing a life-threatening storm surge, catastrophic winds, and severe flooding.
Northeast
For the week, some minor degradations were made on the map including in southern New Jersey and West Virginia where areas of Abnormally Dry (D0) expanded in response to rainfall deficits (ranging from 1 to 3 inches) during the past 30-day period. Moreover, streamflow levels on numerous creeks and rivers in southern New Jersey dipped below the 10th percentile, according to the U.S. Geological Survey (USGS). In West Virginia, small areas of Moderate Drought (D1) were added in response to below-normal streamflow levels, low soil moisture, and short-term precipitation deficits over the past 30-day period. Conversely, some minor improvements were made for a second consecutive week to areas of Abnormally Dry (D0) in western Pennsylvania and western New York where recent precipitation has helped to boost soil moisture levels as well as streamflows. For the week, average temperatures ranged from 1 to 4 degrees F below normal across the northern two-thirds of the region, while areas in the southern extent including areas of southern Pennsylvania, New Jersey, and West Virginia were 2 to 4 degrees above normal. In terms of precipitation for the week, much of the region saw light precipitation accumulations (<1.5 inches), while areas of locally heavy precipitation (2 to 6 inches) were observed in West Virginia.
Southeast
During the past week, light to moderate rainfall accumulations (ranging from 1 to 5 inches) were observed across areas of the region, with the highest accumulations observed in isolated areas of southern Virginia and North Carolina. On the map, areas of Moderate Drought (D1) expanded in northern Virginia, North Carolina, and southern Alabama to reflect short-term precipitation deficits (past 60-days) and declining streamflow levels. In Florida, drought-affected areas remained status quo for the week; however, the abundant rainfall associated with Hurricane Idalia is expected to help ameliorate drought in some areas of the state. Average temperatures across the region were above normal (1 to 8 degrees F), with the greatest departures observed in areas of Alabama, Georgia, and the Florida Panhandle.
South
In the South, the heatwave continued across the region during the past week with record-breaking temperatures observed across the eastern half of Texas, Louisiana, and Mississippi. On the map, areas of Extreme Drought (D3) and Exceptional Drought (D4) expanded along the northern Gulf Coast of Texas and Louisiana as well as areas of Severe Drought (D2) and Extreme Drought (D3) in southern Mississippi. According to the latest U.S Department of Agriculture (USDA) Weekly Weather and Crop Progress Bulletin (8/29), the percentage of topsoil in Texas rated short to very short was 92%, while neighboring Louisiana was rated 88% short to very short. In addition, Water Data for Texas was reporting (8/30) reservoirs in the Edwards Plateau Climate Division were 35.9% full, while the South-Central Climate Division reservoirs were 44.2% full. In terms of drought-related impacts, the National Drought Mitigation Center’s Condition Monitoring Observer Reports (CMOR) were reporting hundreds of impact reports from across Louisiana and Mississippi during the past 30 days. For the week, average temperatures across the region were well above normal across most of the region with temperature departures ranging from 2 to 10+ degrees F above normal. In terms of precipitation, the region was generally very dry except for some isolated areas of light to moderate accumulations observed in areas of Texas (East Texas, Trans-Pecos), Louisiana, and southern Mississippi. In South Texas, some locally heavy rainfall was observed in association with Tropical Storm Harold making landfall and providing beneficial rainfall to drought-affected areas.
Midwest
For the week, light precipitation accumulations (<2 inches) were observed across areas of Missouri, southern Illinois, southern Indiana, Ohio, and Michigan. On the map, some degradations were made in areas of Iowa, Minnesota, Wisconsin, and Illinois where both short- and long-term precipitation deficits persist. According to the latest USDA Weekly Weather and Crop Progress Bulletin (8/29), the percentage of topsoil rated short to very short is as follows: Iowa 68%, Minnesota 60%, Wisconsin 48%, and Illinois 43%. Furthermore, the latest USDA Iowa Crop Progress and Condition report (8/28) noted that the persistent dry conditions have put stress on crops, especially soybeans, with numerous reports of disease entering fields. Average temperatures for the week were well above normal (2 to 10+ degrees F) across much of the region with the greatest anomalies observed across areas of southern Minnesota, Iowa, Missouri, southern Illinois, and southwestern Wisconsin.
High Plains
On this week’s map, degradations were made in northern portions of North Dakota and in eastern Kansas. Conversely, recent precipitation during the past 30-60-day period led to some minor improvements on the map in drought-affected areas of southeastern Nebraska. Across most of the Plains, hot and dry conditions prevailed this week except for some isolated shower activity along the Kansas-Nebraska border region where 1 to 3 inches were observed. Average temperatures for the week were well above normal (2 to 8 degrees F) with the greatest departures observed in northwestern North Dakota and eastern portions of Nebraska and Kansas.
West
On the map, degradations were made across areas of the Southwest and Pacific Northwest including New Mexico, Oregon, Washington, and Montana. In the Pacific Northwest, an area of Extreme Drought (D3) was added in the North Cascades where precipitation has been below normal both in the short and long term. Moreover, 7-day average streamflows on numerous creeks and rivers were below the 10th percentile and numerous other drought indices were supporting deterioration in the Cascades as well as other areas in the state. Likewise, poor soil moisture and low streamflow levels led to expansion of Extreme Drought (D3) in northwestern Montana. In New Mexico, the combination of short- and long-term precipitation deficits, poor soil moisture, and impacts in the agricultural sector (eastern New Mexico) led to continued deterioration on the map across parts of the state. For the week, some light precipitation accumulations (generally < 1 inch) were observed in isolated areas of the Four Corners states and Intermountain West.
Caribbean
In Puerto Rico, improving conditions over the past 30-day period led to removal of Severe Drought (D2) in the northwestern part of the island.
Dry conditions returned to the U.S. Virgin Islands this week. The satellite data (i.e., National Weather Service’s seven-day quantitative precipitation estimates) and station observations show that the rainfall amount varied across the islands, with rainfall totals ranging from 0.00 to 1.00 inch. Standardized Precipitation Index (SPI) maps showed that conditions remain dry at St. Thomas, St. John and St. Croix this week.
Specifically, St. John (Rafe Boulon/Windswept Beach) reported 0.89 inch of rain this week. The depth to water level at Susannaberg DPW 3 well (St. John, USVI) on August 29 was 19.43 ft below land surface. The analysis showed a significant decrease in water level (about 12 ft) since November 25, when it was 7.54 ft below land surface. This week’s 6-month and 9-month SPI also confirms dry conditions persist on the island, so St. John remained in short- and long-term moderate drought (D1-SL) this week.
St. Croix (Henry Rohlsen AP) had no reported rainfall this week. The depth to water level at Adventure 28 Well (St. Croix, USVI) on August 29 was 33.63 ft below land surface. The analysis showed a significant decrease in water level (more than 8 ft) since November 25, when it was 25.04 ft below land surface. This week’s SPI values at all timescales (1-, 3-, 6-, 9- & 12-month) also confirms dry conditions persist on the island. St. Croix remained in short- and long-term extreme drought (D3-SL) this week.
St. Thomas (Cyril E. King Airport) received 0.34 inch of rain this week. The depth to water level at Grade School 3 well (St. Thomas, USVI) on August 29 was 10.13 ft below land surface. This is about 6 ft above the monthly minimum of 16.65 ft set on August 6th. Weekly SPI at most timescales (1-, 6-, 9- & 12-month) also confirms dry conditions persist on the island, so St. Thomas remained in short- and long-term extreme drought (D3-SL) this week.
Pacific
In Alaska, recent rains and improving conditions led to removal of the remaining area of Moderate Drought (D1) in the eastern Interior as well as trimming back of areas of Abnormally Dry (D0).
In the Hawaiian Islands, moderate trade winds brought some shower activity to the windward slope and temperatures were seasonally warm. On the map, areas of Moderate Drought (D1) were expanded on the Big Island in response to reports of stock pond levels dropping and water hauling for personal use by individuals on catchment systems. Additionally, the Severe Drought (D2) was expanded based on data from satellite-based vegetation health indices.
Dry conditions and above-normal temperatures continued on American Samoa this week. Only 0.63 inch of rain fell at Pago Pago with average temperatures about 2°F above normal during the month of August, setting several daily high temperature records during the month. For these reasons, conditions on American Samoa have degraded to short-term moderate drought this week.
Palau remained free of drought or abnormal dryness this week, with reported rainfall totals of 1.47 inches at Palau Airport and 1.10 inches at Koror.
The Mariana Islands remained free of drought or abnormal dryness this week. Saipan reported 5.07 inches of precipitation this week, while Rota and Guam totaled 2.92 and 2.49 inches, respectively.
Wet weather continued across much of Micronesia. Pohnpei had a weekly rainfall amount of 7.54 inches, while Yap, Ulithi and Kosrae reported rainfall totals of 7.26, 5.17 and 3.12 inches, respectively. These locations remained free of drought and abnormal dryness this week. Wet conditions were also observed on Fananu, at 4.84 inches, and Pingelap, at 2.32 inches, of rainfall this week, but both locations remained in short-term abnormal dryness due to previous dry weeks and months.
Drier conditions were observed on Nukuoro, Chuuk, Kapingamarangi, Lukunoch and Woleai reporting 1.85, 1.65, 0.85, 0.76 and 0.20 inches of rainfall this week, respectively. These locations were below the weekly threshold but remained drought free due to previous weeks and/or months being wet.
Rainfall varied across much of the Marshall Islands this week. A weekly rainfall total of 4.73 inches fell on Majuro, while Jaluit and Mili each received rainfall amounts greater than 2 inches (2.66 and 3.92 inches) and remained free of drought and abnormal dryness this week. Wet conditions were also observed on Kwajalein with 2.67 inches of rainfall this week but remained in short-term abnormal dryness due to previous dry weeks and months.
Only 0.41 inch of precipitation fell at Wotje as short-term abnormal dryness remains on the island this week. Dryness continues on Ailinglapalap with 0.40 inch of rainfall, marking the third consecutive week of below-normal precipitation. Therefore, Ailinglapalap was degraded to short-term abnormal dryness this week. No depiction was made for Utirik due to missing data.
Looking Ahead
The NWS WPC 7-Day Quantitative Precipitation Forecast (QPF) calls for heavy precipitation accumulations ranging from 4 to 10+ inches in association with impacts of Hurricane Idalia, which is forecast to bring very heavy rains across the Big Bend region of Florida as well as across areas of the Coastal Plain of Georgia and the Carolinas. In the Northeast, dry conditions are expected, while most of the South, Midwest, and the Plains states are forecasted to experience generally dry conditions. In the West, some light to moderate accumulations ranging from 1 to 3 inches are expected across portions of Arizona, Utah, and in isolated areas of the central and northern Rockies. The CPC 6-10 Day Outlooks call for a moderate-to-high probability of above-normal temperatures across much of the conterminous U.S. in an area extending from the Rocky Mountains to the Eastern Seaboard, while near-normal temperatures are expected over the remainder of the West except in Washington state where temperatures are forecasted to be below normal. In terms of precipitation, below-normal precipitation is expected across much of the southern tier of the conterminous U.S. as well as portions of the Mid-Atlantic, Great Basin, and Intermountain West. Meanwhile, above-normal precipitation is forecasted for areas of the Upper Midwest, Northern Plains, and the Pacific Northwest.
Author(s):
David Simeral, Western Regional Climate Center
Rocky Bilotta, NOAA/NCEI
Dryness Categories
D0 Abnormally Dry—used for areas showing dryness but not yet in drought, or for areas recovering from drought.
Drought Intensity Categories
D1 Moderate Drought
D2 Severe Drought
D3 Extreme Drought
D4 Exceptional Drought
Drought or Dryness Types
S Short-term, typically less than 6 months (agriculture, grasslands)
L Long-term, typically more than 6 months (hydrology, ecology)
SL Area contains both short- and long-term impacts
Source: National Drought Mitigation Center
