


IMPORTANT NOTE: The employment data for the month of Sept. 2023 is taken from the survey week including Sept. 12th. Data for the month of Sept. is scheduled for release on Nov. 17, 2023.
Employers added 8,700 nonfarm payroll jobs
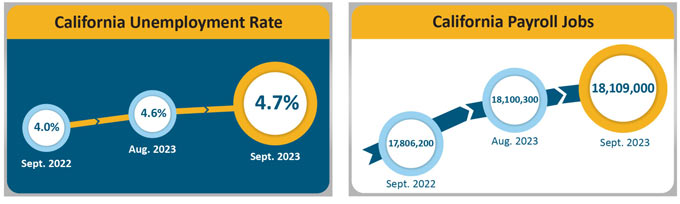
October 21, 2023 - SACRAMENTO – California’s unemployment rate rose slightly to 4.7 percent1 as the state’s employers added 8,700 nonfarm payroll jobs2 to the economy, according to data released on Friday by the California Employment Development Department (EDD) from two surveys. Total nonfarm employment for August 2023 was revised down by 19,900 jobs due, in large part, to revised reductions in the Professional & Business Services sector.
California's Labor Market, by the Numbers...
- Since the current economic expansion began in April 2020, California has gained 3,191,000 jobs, which averages out to a gain of 77,829 jobs per month.
- As of September 2023, California has added 436,400 more nonfarm jobs than it had in February 2020 at the state’s pre-pandemic high.
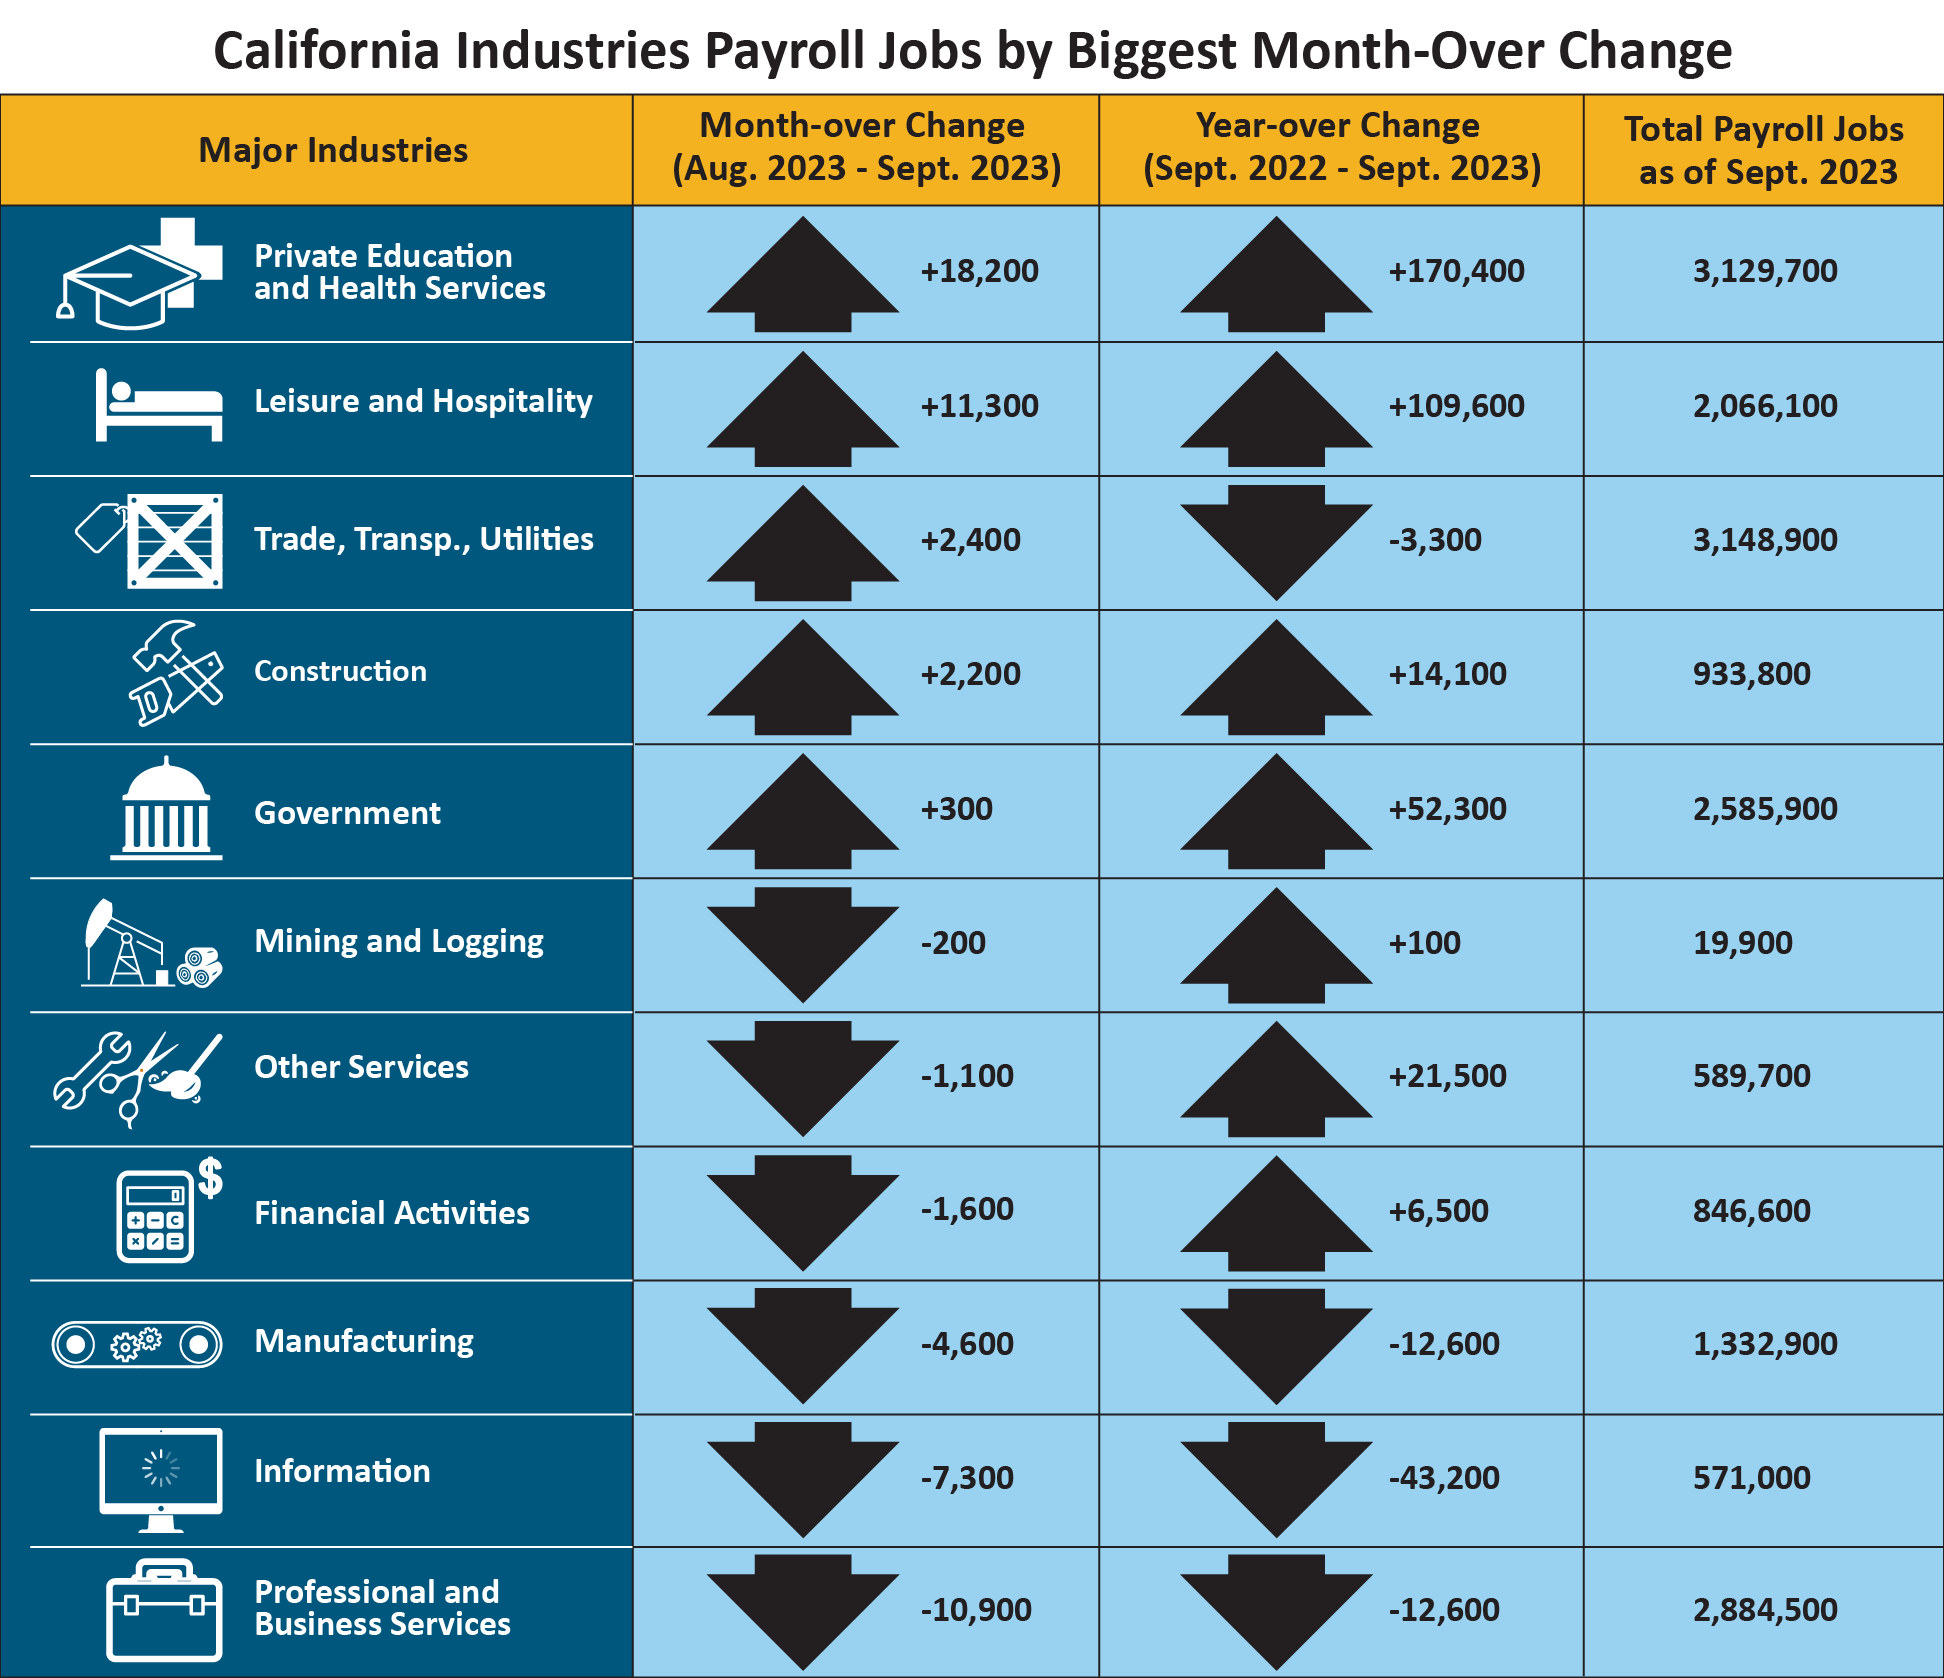
- Five of California’s 11 industry sectors gained jobs in September with Private Education & Health Services (+18,200) leading the way thanks to above average increases in General Medical and Surgical Hospitals, Continuing Care Retirement Communities and Assisted Living Facilities, and Individual and Family Services.
- Leisure & Hospitality (+11,300) also performed well thanks, in part, to job gains in the Accommodation industry group.
- Professional & Business Services (-10,900) posted the largest month-over job loss due to above average declines in Accounting, Tax Prep and Bookkeeping Services, Architectural, Engineering, and Related Services, and Scientific Research and Development Services.
1. The unemployment rate comes from a separate federal survey of 5,100 California households.
2. The nonfarm payroll job numbers come from a federal survey of 80,000 California businesses.
Data Trends about Jobs in the Economy
Total Nonfarm Payroll Jobs
Total Nonfarm Payroll Jobs (Comes from a monthly survey of approximately 80,000 California businesses that estimates jobs in the economy – seasonally adjusted)
- Month-over – Total nonfarm jobs in California’s 11 major industries totaled 18,109,000 in September – a net gain of 8,700 from August. This followed a downward revised (-19,900) month-over gain of 3,200 jobs in August.
- Year-over – Total nonfarm jobs increased by 302,800 (a 1.7 percent increase) from September 2022 to September 2023 compared to the U.S. annual gain of 3,192,000 jobs (a 2.1 percent increase).
Total Farm jobs – The number of jobs in the agriculture industry increased from August by 800 to a total of 431,300 jobs in September. The agricultural industry had 5,000 more farm jobs in September 2023 than it did in September a year ago.
Data Trends about Workers in the Economy
Employment and Unemployment in California (Based on a monthly federal survey of 5,100 California households which focuses on workers in the economy)
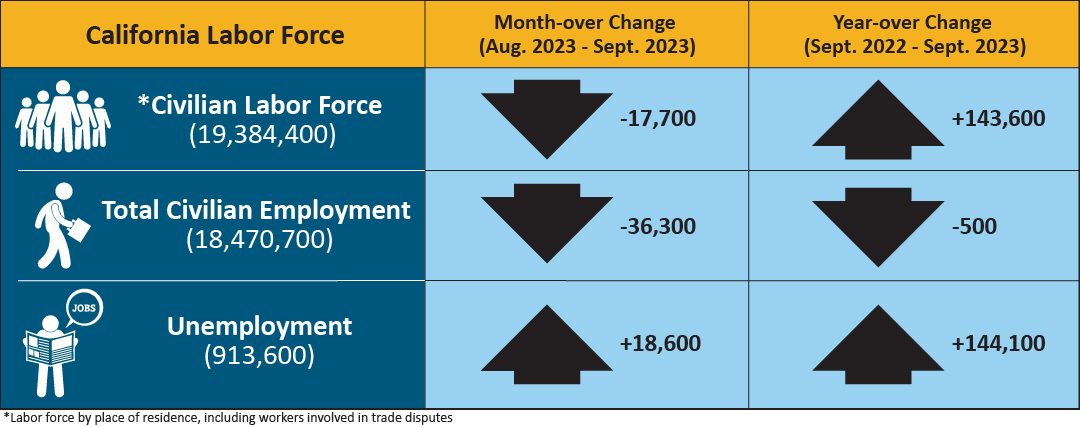
- Employed – The number of Californians employed in September was 18,470,700, a decrease of 36,300 persons from August’s total of 18,507,000 and down 500 from the employment total in September
- Unemployed – The number of unemployed Californians was 913,600 in September, an increase of 18,600 over the month and up 144,100 in comparison to September 2022.
Unemployment Insurance Claims (Not Seasonally Adjusted)
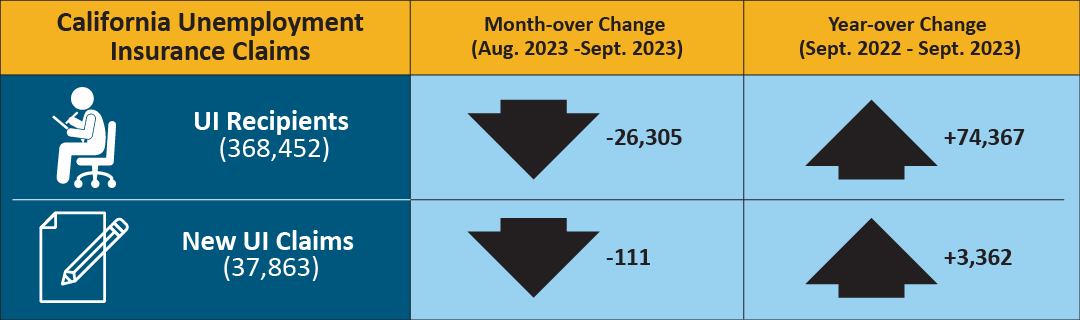
The following data is from a sample week that includes the 19th of each month: In related data that figures into the state’s unemployment rate, there were 368,452 people certifying for Unemployment Insurance benefits during the September 2023 sample week. That compares to 394,757 people in August and 294,085 people in September 2022. Concurrently, 37,863 initial claims were processed in the September 2023 sample week, which was a month-over decrease of 111 claims from August, but a year-over increase of 3,362 claims from September 2022.
| COUNTY | LABOR FORCE | EMPLOYMENT | UNEMPLOYMENT | RATE |
|---|---|---|---|---|
| STATE TOTAL |
19,340,800 |
18,347,200 |
993,600 |
5.1% |
| ALAMEDA |
831,600 |
794,200 |
37,400 |
4.5% |
| ALPINE |
510 |
470 |
40 |
7.5% |
| AMADOR |
14,570 |
13,830 |
740 |
5.1% |
| BUTTE |
91,100 |
86,200 |
4,900 |
5.3% |
| CALAVERAS |
22,510 |
21,560 |
950 |
4.2% |
| COLUSA |
10,550 |
9,560 |
1,000 |
9.4% |
| CONTRA COSTA |
553,600 |
528,700 |
24,900 |
4.5% |
| DEL NORTE |
9,480 |
8,920 |
560 |
5.9% |
| EL DORADO |
93,900 |
90,100 |
3,900 |
4.1% |
| FRESNO |
458,400 |
426,100 |
32,300 |
7.0% |
| GLENN |
12,240 |
11,450 |
800 |
6.5% |
| HUMBOLDT |
58,800 |
55,800 |
2,900 |
5.0% |
| IMPERIAL |
71,900 |
57,700 |
14,200 |
19.7% |
| INYO |
8,360 |
8,040 |
320 |
3.8% |
| KERN |
397,400 |
365,300 |
32,000 |
8.1% |
| KINGS |
57,500 |
53,100 |
4,400 |
7.7% |
| LAKE |
28,160 |
26,590 |
1,570 |
5.6% |
| LASSEN |
8,760 |
8,340 |
420 |
4.8% |
| LOS ANGELES |
5,004,300 |
4,712,300 |
292,000 |
5.8% |
| MADERA |
64,700 |
60,100 |
4,600 |
7.0% |
| MARIN |
132,300 |
127,400 |
4,900 |
3.7% |
| MARIPOSA |
7,700 |
7,330 |
370 |
4.8% |
| MENDOCINO |
36,630 |
34,930 |
1,700 |
4.6% |
| MERCED |
116,100 |
106,100 |
10,000 |
8.6% |
| MODOC |
3,230 |
3,070 |
160 |
5.1% |
| MONO |
9,160 |
8,810 |
350 |
3.9% |
| MONTEREY |
237,300 |
225,700 |
11,700 |
4.9% |
| NAPA |
72,000 |
69,400 |
2,600 |
3.6% |
| NEVADA |
47,630 |
45,640 |
1,990 |
4.2% |
| ORANGE |
1,592,500 |
1,529,900 |
62,600 |
3.9% |
| PLACER |
195,700 |
187,800 |
7,800 |
4.0% |
| PLUMAS |
7,520 |
7,090 |
430 |
5.7% |
| RIVERSIDE |
1,143,100 |
1,081,300 |
61,800 |
5.4% |
| SACRAMENTO |
734,900 |
700,400 |
34,500 |
4.7% |
| SAN BENITO |
32,500 |
30,700 |
1,800 |
5.6% |
| SAN BERNARDINO |
999,400 |
948,400 |
51,000 |
5.1% |
| SAN DIEGO |
1,594,100 |
1,525,700 |
68,400 |
4.3% |
| SAN FRANCISCO |
578,400 |
557,800 |
20,600 |
3.6% |
| SAN JOAQUIN |
345,900 |
324,400 |
21,500 |
6.2% |
| SAN LUIS OBISPO |
138,100 |
133,000 |
5,100 |
3.7% |
| SAN MATEO |
457,100 |
441,900 |
15,200 |
3.3% |
| SANTA BARBARA |
226,100 |
217,300 |
8,800 |
3.9% |
| SANTA CLARA |
1,051,800 |
1,011,100 |
40,700 |
3.9% |
| SANTA CRUZ |
135,800 |
128,900 |
6,900 |
5.1% |
| SHASTA |
73,000 |
69,300 |
3,700 |
5.1% |
| SIERRA |
1,350 |
1,290 |
60 |
4.1% |
| SISKIYOU |
17,230 |
16,240 |
1,000 |
5.8% |
| SOLANO |
202,000 |
192,100 |
9,900 |
4.9% |
| SONOMA |
250,100 |
240,500 |
9,600 |
3.8% |
| STANISLAUS |
241,200 |
225,500 |
15,700 |
6.5% |
| SUTTER |
47,700 |
44,700 |
3,100 |
6.5% |
| TEHAMA |
25,770 |
24,210 |
1,560 |
6.0% |
| TRINITY |
4,650 |
4,410 |
240 |
5.2% |
| TULARE |
209,400 |
188,800 |
20,600 |
9.8% |
| TUOLUMNE |
20,280 |
19,240 |
1,040 |
5.1% |
| VENTURA |
412,100 |
393,000 |
19,100 |
4.6% |
| YOLO |
110,400 |
105,300 |
5,100 |
4.7% |
| YUBA |
32,300 |
30,300 |
2,000 |
6.3% |
Source: EDD
