


January 14, 2024 - By Emily Becker - El Niño is very likely close to peak strength and is likely to continue for the next few months, while gradually weakening. Despite the expected weakening of El Niño’s tropical Pacific sea surface signature, impacts to global climate will continue for the next few months. Forecasters currently expect ENSO-neutral conditions (ENSO = El Niño/Southern Oscillation, the whole El Niño & La Niña system) by the April–June period. After that… you’ll have to read on to find out!
A bird in hand
Animation of maps of sea surface temperatures in the Pacific Ocean compared to the long-term average over five-day periods from the end of October 2023 to early January 2024. The waters in the key monitoring region, which scientists call "the Niño-3.4 region," are consistently warmer than average (red), reflecting the mature El Niño. NOAA Climate.gov, based on Coral Reef Watch maps available from NOAA View.
Decades of observations have shown us that it’s typical for El Niño’s sea surface temperature anomaly (anomaly = difference from the long-term average) to peak around December or early January. In December, the sea surface temperature in our key tropical Pacific monitoring region (dubbed “the Niño-3.4 region”) measured 2.1 °Celsius above the 1991–2020 average, the current averaging period, according to our most reliable long-term sea surface temperature dataset, the ERSSTv5.
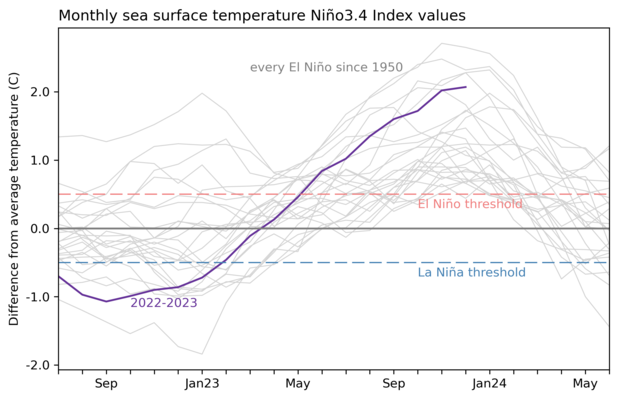
2-year history of sea surface temperatures in the Niño-3.4 region of the tropical Pacific for all events evolving into El Niño since 1950 (gray lines) and the current event (purple line). NOAA Climate.gov image based on a graph by Emily Becker and monthly Niño-3.4 index data from CPC using ERSSTv5.
The informal threshold for a “very strong” El Niño event is 2.0 °C above average, so we’re there for the second month in a row. To qualify as a very strong event in our official record, however, we’ll need to see the three-month-average Niño-3.4 index, the Oceanic Niño Index, meet or exceed the threshold. If January’s Niño-3.4 index ends up at 1.9 °C or greater, the November–January Oceanic Niño Index will qualify.
El Niño is a coupled system, meaning both the tropical Pacific Ocean and the overturning atmospheric circulation above it—the Walker circulation—are critical components. Over the past few months, we have observed all the characteristics of El Niño’s typical weaker-than-average Walker circulation, including more clouds and rain than average over the central tropical Pacific, as El Niño’s warmer waters lead to more rising air and storms than average (remember this for later in the post!). We’ve also seen the expected drier conditions over Indonesia and the far western Pacific.
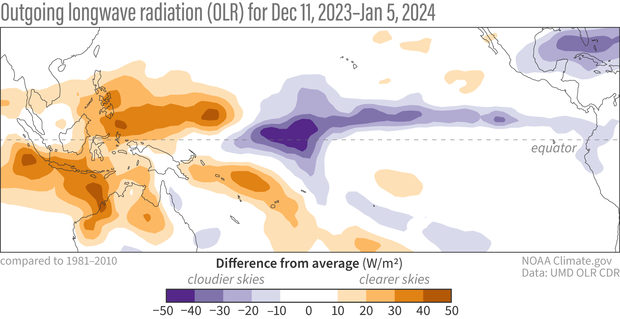
Outgoing long-wave radiation anomaly from December 11, 2023–January 5, 2024. Outgoing long-wave radiation is radiation leaving the Earth's surface. It is blocked by clouds, so areas with more clouds show up as negative outgoing long-wave radiation anomalies. Regions with more clouds and rain than average are shown in blue; areas with fewer clouds and less rain are shown in orange. Climate.gov image from CPC data.
El Niño is also a seasonal phenomenon, lasting for several months in a row. Our requirement to qualify as an ENSO event is that the Oceanic Niño Index stays above the threshold for at least 5 overlapping three-month-average periods in a row. (We call any three-month-average period a “season.”) This El Niño event started in the April–June period and is still going strong, seven overlapping seasons later.
Birds of a feather
Sea surface temperatures change relatively slowly, but atmospheric indicators bounce around a bit more. This is why we look for the monthly or seasonal average atmospheric patterns to reflect El Niño conditions, and we don’t cancel El Niño if a shorter period deviates from what we expect. An interesting current example of this arises from the activity of the Madden-Julian Oscillation, or “MJO.”
The MJO is another pattern of climate variability, operating on intraseasonal (weekly average) timescales, as opposed to ENSO’s seasonal average timescales. In brief, the MJO is a recurring cluster of storms that travels from the west to the east along the equator. This moving cluster of storms is accompanied by changes in tropical winds and can circle the globe in about 30–60 days. Like ENSO, the MJO affects global atmospheric circulation, transmitting its impacts to regions far away from the center of storminess. We’ve written about the MJO before, here and here.
Averages of all January–March MJO events from 1979–2016. Green shading shows below-average OLR (outgoing longwave radiation, or heat energy) values, indicating more clouds and rainfall, and brown shading identifies above-average OLR (drier and clearer skies than normal). The purple contours show the location and strength of the Pacific jet at the 200-hPa level (roughly 38,000 feet at that location). Note the eastward movement of the wet and dry areas. How far the Pacific jet extends past the international dateline also changes with the phase of the MJO. NOAA Climate.gov animation, adapted from original images provided by Carl Schreck.
As you can see in this animation, the MJO area of increased storms and rain is flanked by drier areas. And, since the MJO moves along the equator, it can travel through El Niño’s territory. This means that the MJO can temporarily overlap with El Niño’s expected regions of drier and wetter conditions, making them more intense. But the MJO can also work against the expected El Niño atmospheric pattern, depending on the MJO’s location.
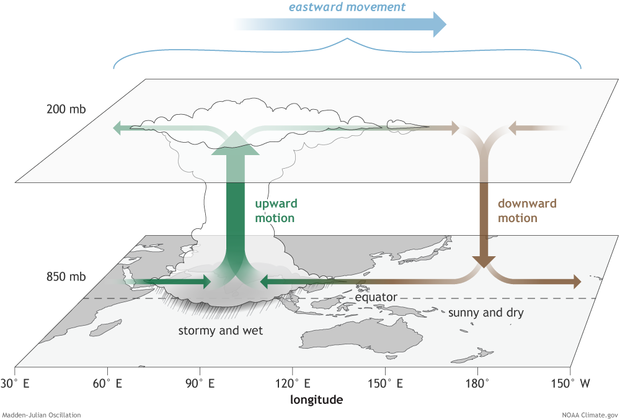
The surface and upper-atmosphere structure of the MJO for a period when the enhanced convective phase (thunderstorm cloud) is centered across the Indian Ocean and the suppressed convective phase is centered over the west-central Pacific Ocean. Horizontal arrows pointing left represent wind departures from average that are easterly, and arrows pointing right represent wind departures from average that are westerly. The entire system shifts eastward over time, eventually circling the globe and returning to its point of origin. Climate.gov drawing by Fiona Martin.
NOAA’s Climate Prediction Center closely monitors the MJO. According to their most recent update, the MJO has been active since early November, and recently completed a circumnavigation of the globe. The MJO team’s update says there was destructive interference—the patterns working against each other’s influence—between the MJO and ENSO in early January, something that shows up when you break the map from earlier up into three periods.
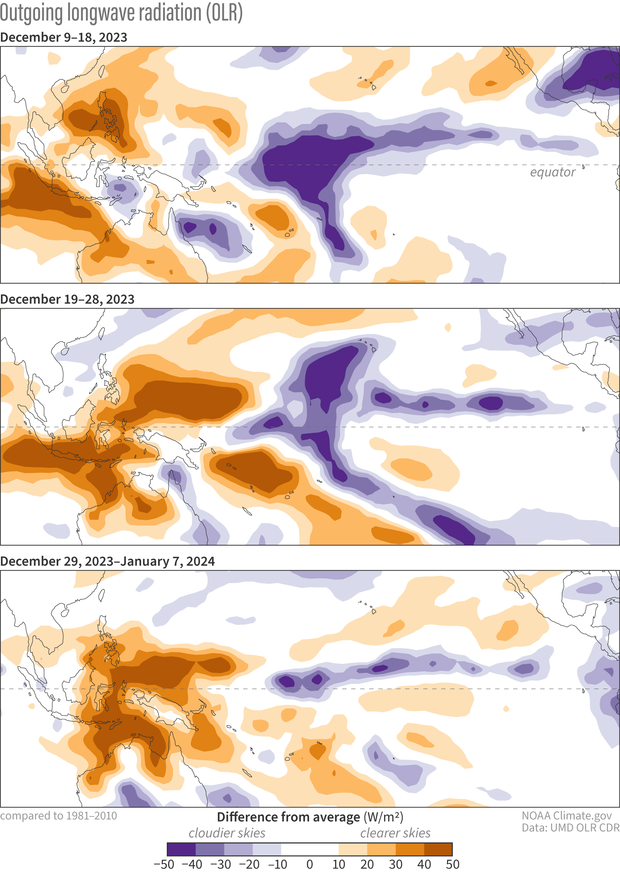
Outgoing long-wave radiation anomaly from December 9, 2023–January 7, 2024, shown as three 10-day-average periods. Regions with more clouds and rain than average are shown in blue; areas with fewer clouds and less rain are shown in orange. Climate.gov image from CPC data.
The bottom panel in particular, the most recent, shows that the increased storminess near the International Date Line (a hallmark of El Niño, as I mentioned above) has been disrupted somewhat, weakening relative to the earlier periods. This is likely the influence of the MJO, which is suppressing rainfall there while increasing rainfall over the Indian Ocean.
The MJO is likely to continue to move around the tropics, where it could eventually enhance the El Niño-related atmospheric patterns again in late January or early February. The MJO is a great illustration of the difference between a seasonal pattern, which shows up in longer averages like monthly or three-month, and intraseasonal variability, which can enhance or oppose the seasonal pattern over a few weeks.
Bluebird
What might we have upcoming? Is that a chance for La Niña flapping its wings in the distance?
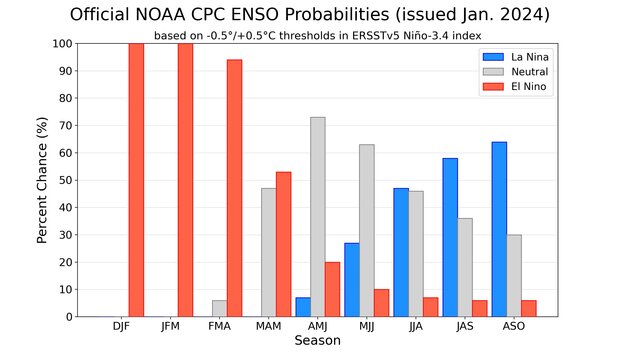
NOAA Climate Prediction Center forecast for each of the three possible ENSO categories for the next 8 overlapping 3-month seasons. Blue bars show the chances of La Niña, gray bars the chances for neutral, and red bars the chances for El Niño. Graph by Michelle L'Heureux.
Chances of La Niña conditions are topping 50-60% by the Northern Hemisphere late summer/fall, as many of our computer climate models are predicting that La Niña will develop. La Niña has its own set of global impacts, of course, including a tendency to increase Atlantic hurricane activity. We’ll be keeping an eagle eye on conditions in the tropical Pacific as this El Niño wanes over the next several months.
A blog about monitoring and forecasting El Niño, La Niña, and their impacts.
Disclaimer:
The ENSO blog is written, edited, and moderated by Michelle L’Heureux (NOAA Climate Prediction Center), Emily Becker (University of Miami/CIMAS), Nat Johnson (NOAA Geophysical Fluid Dynamics Laboratory), and Tom DiLiberto and Rebecca Lindsey (contractors to NOAA Climate Program Office), with periodic guest contributors.
Ideas and explanations found in these posts should be attributed to the ENSO blog team, and not to NOAA (the agency) itself. These are blog posts, not official agency communications; if you quote from these posts or from the comments section, you should attribute the quoted material to the blogger or commenter, not to NOAA, CPC, or Climate.gov.
Source: ENSO blog team
