


February 12, 2024 - February – May 2024 South Ops Highlights
• The odds show a slight tilt towards above normal temperatures and a slight tilt towards above normal precipitation for the February – May 2024 period.
• The odds tilt towards above normal dead and live fuel moisture to occur for the majority of the forecast period, especially through March.
• The odds tilt strongly towards El Niño conditions to persist for the entirety of the forecast period, but it is favored to weaken significantly by later spring.
Weather Discussion
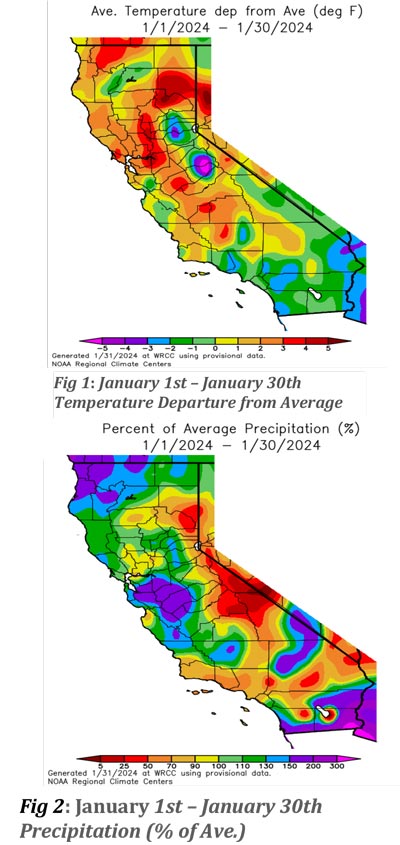 January 2024 was overall drier than average for most of the geographic area with near normal temperatures (Figures 1 and 2). Most areas were within 1 to 2 degrees of average temperature, with the exception of the Central Valley ranging 2-4oF above average. The coldest anomalies were along the South Coast, Lower Deserts and Eastern Deserts. The warmest anomalies were located in the Central Valley. Precipitation had a larger variance, though most areas remain below average. The driest anomalies occurred in the Northern Deserts with some areas receiving less than 5% of the average January precipitation for that area. However, there were other locations that remained wetter than normal with the Eastern Deserts receiving over 200% of their average January precipitation and along the upper deserts. Portions of the Central Mojave Desert and Kern County west of the Tehachapi Mountains also experienced a wetter than average January.
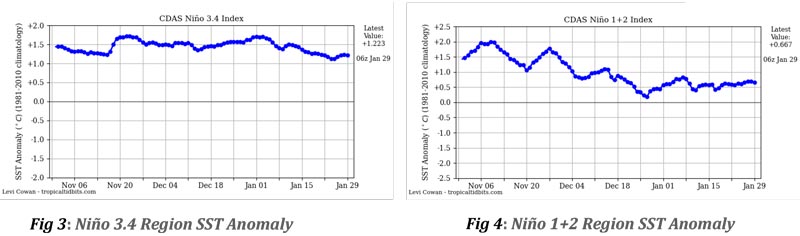
 The current state of the El Niño Southern Oscillation (ENSO) is a transition between a traditional East Pacific El Niño and a Central Pacific El Niño Modoki as the core of the warmest waters in the equatorial Pacific is slowly propagating westward (Figures 3 and 4).
Fuels Discussion
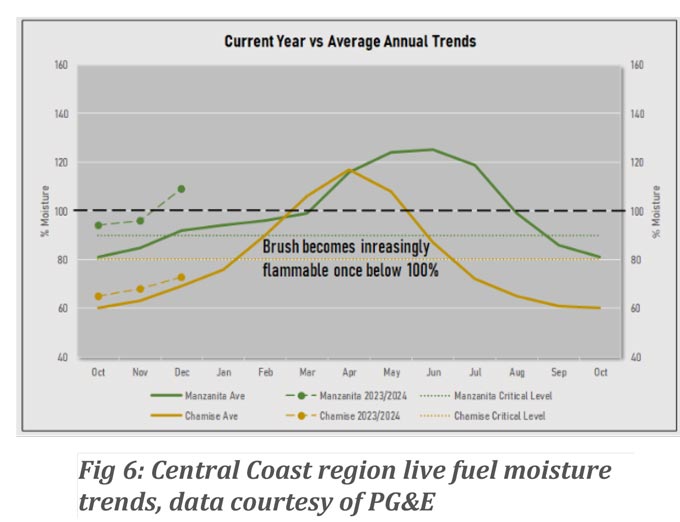
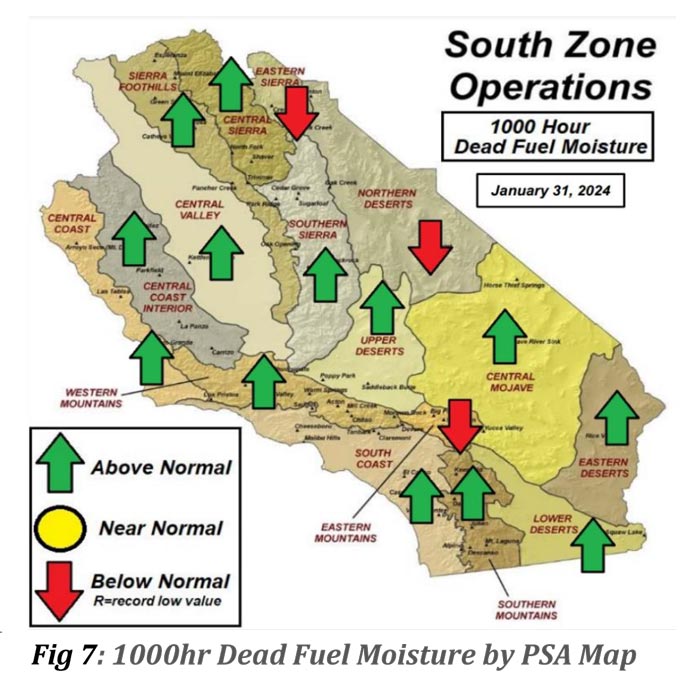
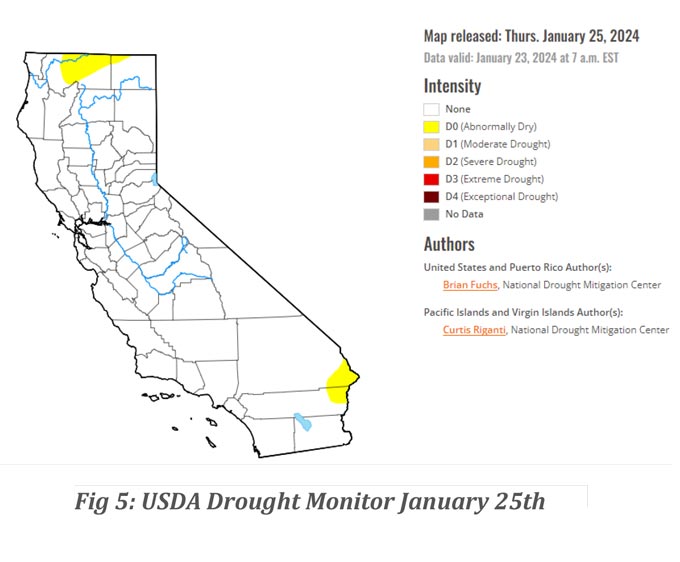
Latest USDA Drought Monitor shows zero areas in drought status across Southern California (Figure 5). The current fuel loading pattern significantly favors the live fuel component as live fuel accounts for the overwhelming majority of the current fuels. Live fuel moistures continue to remain mostly above normal (Figure 6). 1000-hr dead fuel moisture also remains mostly above normal (Figure 7). The odds tilt in favor of live fuel moisture remaining wetter than normal for February and March and near-normal for April and May. Forecast confidence is significantly lower for April and May due to the uncertainty given the weather pattern this winter does not represent a textbook El Niño pattern across Southern California.
SOUTH OPS OUTLOOK
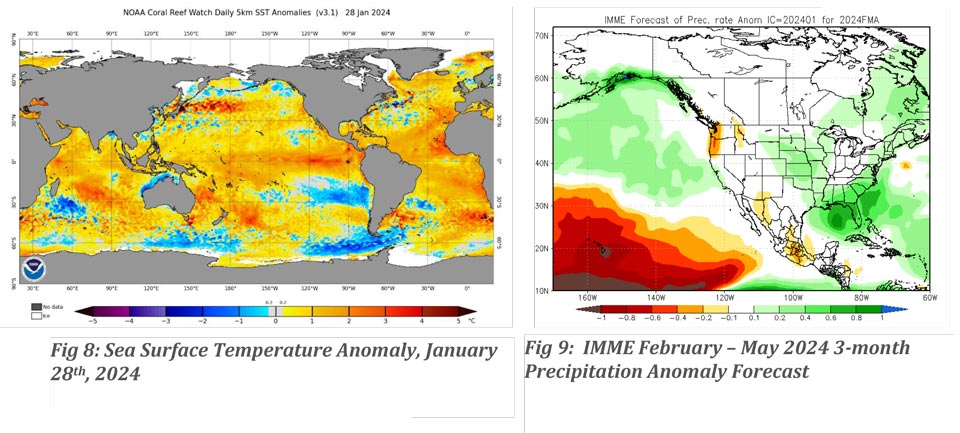
Climate models suggest a transition in ENSO from the El Niño phase to an ENSO Neutral phase as upwelling is projected to strengthen and thus sea surface temperatures (Figure 8) in the equatorial Pacific cool. Given that the current wet season is not following the typical El Niño pattern combined with the likely phase change of ENSO, there is a high degree of uncertainty this forecast period, especially the second half of the period. The odds tilt in favor of live fuel moisture remaining above normal for February and March given the persistent trends of above normal fuel combined with February and March being the wettest and third wettest months of the year climatologically. The time lag in fuel moistures from February and March is likely to carry well into April.
Climate models suggest equal chances for above, near and below normal temperature and precipitation anomalies for Southern California during the February – May 2024 period (Figure 9). Given the aforementioned dynamics of this season not following the typical El Niño pattern combined with the likely phase change in ENSO, the solution of equal chances is plausible given the large variance in possible outcomes with these dynamics. Given the warmer than normal SST anomalies off the immediate California coast, the odds tilt in favor of a weaker than normal marine layer (i.e. less “May-June gloom”) across Southern California this upcoming spring season. A weaker marine layer corresponds to ample sunshine and drier conditions due to more nights of poor overnight recoveries and lower daily minimum relative humidity.
Translating this to the upcoming fire season, if precipitation from February through May remains nearnormal, then the odds tilt towards near-normal large fire potential by the end of the forecast period. If February through May continue the same moisture trend as October 2023 – January 2024, then the odds will begin tilting to above normal potential for large fires
Source: Predictive Services
