


California and National Drought Summary for December 29, 2015
Summary
A large complex storm system produced copious amounts of precipitation in the Central and Southern US during this USDM week. The seasonably cold air behind the system mixed with the unseasonably warm, moist air that was entrenched across the east. This produced an unstable air mass kicking off heavy rains, thunderstorms, blizzards, tornadoes and historic flooding. Rainfall amounts on the warm side of the system were in excess of 10 inches, while some areas received more than 20 inches of snow on the cold side. The 7-day precipitation totals amounted to 800 percent of normal or greater for a large swath stretching from eastern Oklahoma, northwest Arkansas, much of Missouri, and Illinois. Portions of Alabama and Georgia also recorded far greater than normal precipitation amounts. The larger precipitation amounts missed areas in western Kansas, eastern Colorado, south Texas, Florida, the Desert Southwest, and areas in the Northern and High Plains. Record setting warm temperatures occurred across large portions of the eastern third of the US. Average temperature departures were in the range of 20-25 degrees above normal for the USDM week. Temperature anomalies were as much as 20 degrees below normal in the western third of the country. The following is a list of preliminary daily and monthly temperature data records that were tied or broken during the period from December 23 – 29:1926 highest daily max temperatures; 2019 highest daily min temperatures; 59 highest monthly max temperatures; 240 highest monthly min temperatures
Alaska, Hawaii, and Puerto Rico
No changes were made in these areas.Central
As the storm moved northeastward, a mixture of rain and blizzard like conditions affected the Central region. Heaviest rain amounts were in Missouri and Illinois where much of the area received at least 5 inches or more. Historic flooding was a concern along the banks of the Mississippi. In St Louis, the river was expected to crest at 44.8 feet – its second highest level ever recorded - only behind the great flood of 1993. For some places along the Mississippi and its tributaries, a record high crest is expected or has occurred. The storm left nearly a foot of snow in some locals. Iowa, Michigan and Wisconsin had several sites measuring 10 inches or more. A 1-cat improvement was made in southern Indiana where abundant precipitation has fallen during the last 30 days. D0 was removed from eastern Illinois and western Indiana. In Nebraska, D0 was trimmed back along the northwest corner based on recent percent of normal (>300 percent), but eradication was put on hold for one more week in the southwest. Kansas saw a slight expansion of D0 into Pawnee County based on 7 and 14 day percent of normals (<5%). DO was removed from the eastern portion of Kansas based on the recent precipitation more than double the normal.East
As the powerful storm moved northeastward it produced much needed rain and snow for the Northeast. Precipitation amounts during the last 7 days brought 1-3 inches to the area. However, 30-day deficits are still in the range of 1-3 inches below normal for some areas. In Massachusetts, December precipitation is coming in near or above normal however, ground water levels appear to be lagging behind in recovery. Snowfall totals from the most recent storm in Maine were upwards of 10 inches in some locales. Temperatures for the rest of the region have continued to be too warm to support frozen precipitation. Average temperatures during the 7-day period were more than 20 degrees above normal. Numerous daily and monthly high max and high min temperatures were broken by a large margin during the course of the week. Some of the largest high maximum temperature differences from the previous record included: 66DegF at Glens Falls, NY besting the previous daily record by 20DegF; 68 DegF at Burlington, VT besting the previous daily record by 16DegF; and 69 Degrees in New York, NY besting the previous daily record by 11DegF. Some of the largest high minimum temperature differences from the previous record included: 63DegF Washington DC (Dulles) besting the previous daily record by 21DegF; 64DegF in Danville, VA (18DegF above the previous daily record); 66DegF Raleigh/Durham, NC (17DegF above the previous record); and 62DegF Philadelphia, PA (15DegF above the previous daily record). Further south, precipitation was below normal for the South Carolina and Georgia coast as well as much of Florida. Everywhere else, precipitation was at least 200 percent of normal for the period. Temperatures along the North Carolina coast during the period were at least 25DegF above what is normally expected this time of year. The same anomalies were also seen in eastern Tennessee and much of Mississippi.South
The massive storm system brought heavy snows in New Mexico and West Texas. According to storm reports, snow totals topped out at 41” in New Mexico and 24” in Texas. Severe weather affected East Texas dumping in excess of 10 inches of rain in the region. Violent tornadoes, some rated as high as EF4, caused extensive damage and loss of life. Record high streamflows currently exist for much of East Texas. Meanwhile, South Texas remained dry prompting slight expansions and introductions of D0 in the area. Oklahoma bore the brunt of the precipitation where the eastern portion of the state received as much as 11 inches of rain in a 3-day period. For some areas, the wet December bolstered the annual totals, topping the wettest calendar year on record for the state of Oklahoma. Exceptionally high winds caused power outages in western Oklahoma. Gusts as high as 70mph were measured. The southern jet stream continued its track along the gulf coast states and into the southern Appalachian’s pumping in above normal precipitation. From southeast Alabama, northeastward into Western North Carolina, precipitation was more than double what is expected during the last 30, 60 and 90 days. However, portions of Florida and southeast Georgia continued to miss out. During the last 90 days, precipitation deficits were less than half of what is expected in portions of that region.West
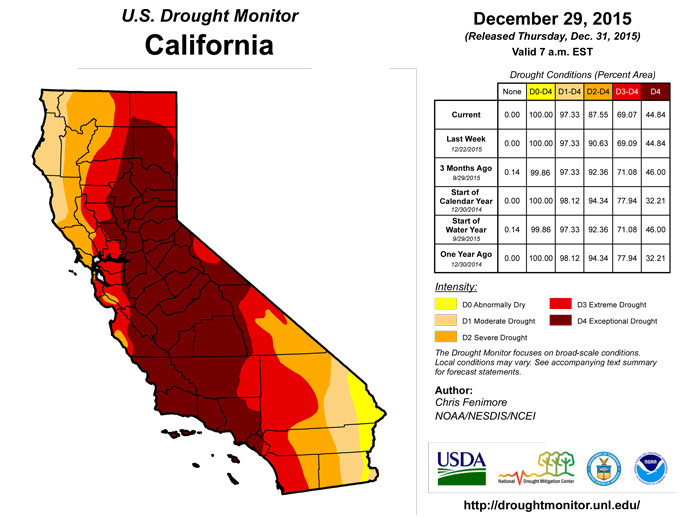
The relentless flow of moisture has benefited the drought stricken areas of the Northwest and West Coast. In Washington the past 7 days has seen precipitation 150 -400 percent above normal. Out to 14 days, the above normal precipitation is more widespread covering the entire western half of the state. Further out, precipitation totals are at least 150 percent of normal at 30, 60, and 90 days. The temperatures are cold enough to support snow at the higher elevations. Snow water equivalents (SWE’s) are ranging from near normal to greater than 200 percent of normal. The reservoirs in Yakima River Basin are at or above average for this time of year. The better-than-average conditions for the start of the water year allowed for a 1-cat drought improvement across the entire state. In Oregon, abundant precipitation has relieved drought conditions across much of the state and SWE’s are near-to-much above normal. Eastern Oregon remained status quo.For December, precipitation in northwest California was 150-300 percent of normal. From the most recent rain event, 72 hour totals ranged from 4-6 inches in Del Norte County to 3-6 inches southward in Mendocino County. These storms in Modoc and Siskiyou counties have been very orographic, so the valley locations in Central Siskiyou County haven't gotten much precipitation at all. So while the improvements along the coast are evident, they have not been seen inland, yet. Further south, the recent storms have dried out as they moved south into the Monterey area. It was noted that ground water and reservoir levels remain unchanged and ground water in Santa Clara Valley is not recovering. In Los Angeles, much like Monterey, all precipitation locations are below normal for the current water year as nearly all of the storm systems have weakened as they approach the area. Reservoirs in San Diego remained unchanged as most of the recent rains soaked into the ground. In Sacramento recent storms have helped with local precipitation totals, and are finally beginning to generate runoff, but not enough to warrant changes in the drought status. The storms have been fairly orographic in nature. After a week of no rain, the Northern Sierra has fallen to 98% of normal and the Central Sierra is at 127 percent of normal. The Sacramento Valley precipitation amounts are still behind normal for the water year. Only limited spots in the Central Sierra are above average. Snow pack looks great this water year so far but is only 110 percent and 121 percent of normal for the Northern and Central Sierra respectively. No changes to the drought status were made in this region.
Looking Ahead
During the next 5 days (December 31 – January 5) a system pumps Pacific moisture into southern Texas. Totals are projected to be 1-2 inches for the area. That same system skirts across the southern Gulf States and eventually makes its way into Florida by day 3. Precipitation totals are projected to exceed 1 inch. In the Northeast, lake effect snows are expected to ramp up during the first part of the period. On Day 4, a Pacific system is expected to bring much needed precipitation to most of California. This is followed by another Pacific system 2 days later. Much of the rest of the country is quiet during this 5-day period. Above average temperatures that have been present in the eastern half of the country are expected to give way to temperatures that are closer to average.For the ensuing 7 days (January 6 - 12), odds favor above normal temperature in the east and below normal temperatures in the west. Chances are likely that precipitation will be above normal in the Southwest, South and parts of the Southeast. The probability of below normal precipitation exists for the Northwest, Great Lakes and Northeast regions. The outlook is for wetter- and warmer-than-normal weather for much of Alaska.
Author(s):
Chris Fenimore, NOAA/NESDIS/NCEI
Dryness Categories
D0 ... Abnormally Dry ... used for areas showing dryness but not yet in drought, or for areas recovering from drought.Drought Intensity Categories
D1 ... Moderate DroughtD2 ... Severe Drought
D3 ... Extreme Drought
D4 ... Exceptional Drought
Drought or Dryness Types
S ... Short-Term, typically <6 months (e.g. agricultural, grasslands)L ... Long-Term, typically >6 months (e.g. hydrology, ecology)
National Drought Mitigation Center

