


August 10, 2024 - By Tom DiLiberto - You’ll have to excuse this ENSO Blogger for a minute while I drink some sweet tea on the porch and lament about all the heat and humidity, “Woof, it’s hot!” Things truly seem to move slower during the dog days of summer in late July and early August. And it seems like the El Niño/Southern Oscillation (ENSO), a climate pattern in the tropical Pacific Ocean that can affect weather across the world, is no exception. The expected transition from ENSO-Neutral to La Niña continues to proceed slowly, as if the whole Pacific is stuck in a summer daze, moving as slow as molasses.
According to the August ENSO outlook, ENSO-Neutral conditions remain across the Pacific, with La Niña favored to develop during Autumn (66% chance) before persisting through the Northern Hemisphere winter (74% chance during November-January).

Out of the three climate possibilities—La Niña, El Niño, and neutral—forecasts say that neutral conditions are the most likely for the July-September season (tall gray bar above the JAS label, over 80 percent chance). By the September-November (SON) season, La Niña has the highest chance of occurring (blue bar, above 65 percent chance). NOAA Climate Prediction Center image.
Can I get a fan, please?
All that summer heat can make one forgetful so let’s go back over why we care so much about ENSO. First, a reminder that El Niño and La Niña are opposite phases of ENSO. El Niño occurs when the water in the eastern and central tropical Pacific is warmer than average, while La Niña occurs when the water is cooler than average. That change in water temperature can jumble up the tropical atmosphere above it, causing a global cascade of atmospheric impacts. The end result is shifts in the jet stream and changes in weather patterns, often leading to wild weather including floods, droughts, and heatwaves.
But unlike other climate phenomena which can be difficult to predict even two weeks prior, the phase of ENSO can be predicted many months in advance, giving communities worldwide vital time to prepare.
ENSO-Neutral, meanwhile, simply reflects that ocean temperatures are near-average, with little unusual impacts on the atmosphere above it.
Toes in the water
The last month has seen near-average sea surface temperatures across most of the equatorial Pacific Ocean, so we are squarely ENSO-Neutral. The Niño-3.4 region of the Pacific, which is our primary monitoring region for ENSO, was 0.1°C warmer than the long-term average from 1991-2020, according to ERSSTv5, our most reliable sea surface temperature dataset. Yep, I did say “warmer.” So let’s dive deeper into the Pacific for the reason we are still forecasting the development of La Niña (eventually) this year.
While sea surface temperatures are currently perfectly cromulent, below-average water temperatures in the subsurface (the surface to 300 meters below the surface) of the tropical Pacific Ocean strengthened in the past month, expanding across more of the central and eastern Pacific Ocean. These cooler-than-average waters will be one of the driving forces behind any La Niña that forms later this year.
Beneath the surface of the tropical Pacific Ocean at the equator, a deep pool of cooler-than-average (blue) waters has been building up throughout the summer to date (June 7-August 1, 2024). This pool of relatively cool water is a key factor behind the prediction for La Niña later this fall and winter. NOAA Climate.gov image, based on analysis from Michelle L'Heureux, Climate Prediction Center.
Meanwhile, for as interesting as the ocean has been, the atmosphere has been the opposite. The trade winds were slightly more easterly than normal in July (which reflects slightly stronger-than-average trade winds), while thunderstorm activity was generally near-average. A pretty clear reflection of ENSO-Neutral.
Whew! When is that cold front coming?
Let’s talk about the forecast. So far this summer, the climate models we use for guidance have been trending toward a weaker and delayed development of La Niña than they first hinted in the spring. In May and June, the models forecasted a start during summer. But the most recent forecasts pinpoint early fall as the most likely start time. Regardless, the overall model consensus remains that La Niña will likely form this year and last through the upcoming winter.

Line graph showing observed and predicted temperatures (black line) in the key ENSO-monitoring region of the tropical Pacific from winter 2023-24 though winter 2024-25. The gray shading shows the range temperatures predicted by individual models that are part of the North American Multi Model Ensemble (NMME, for short). Most of the shading appears below the dashed blue line by the fall, meaning most models predict that temperature in the Niño-3.4 region of the tropical Pacific will be cooler than average by at least 0.5 degrees Celsius (0.9 degrees Fahrenheit)—the La Niña threshold. NOAA Climate.gov image, based on data provided by Climate Prediction Center.
This fact, combined with current observations of cooler-than-average water at depth across the Pacific and slightly enhanced trade winds, give forecasters confidence that even though the transition to La Niña has been slower than initially expected, it’s still likely to form later this year.
Can someone just turn the AC on?
The burning-hot, must-be-suffering-from-heat-exhaustion-at-this-point elephant in the room continues to be the hot streak Earth has been going through for more than a year (as well as the longer warming trend associated with human-caused climate change). Global ocean temperatures have been record breaking every month for well over a year. And just as we noted some uncertainty on how this would affect the 2023-24 El Niño (RIP), the same goes for any developing La Niña.
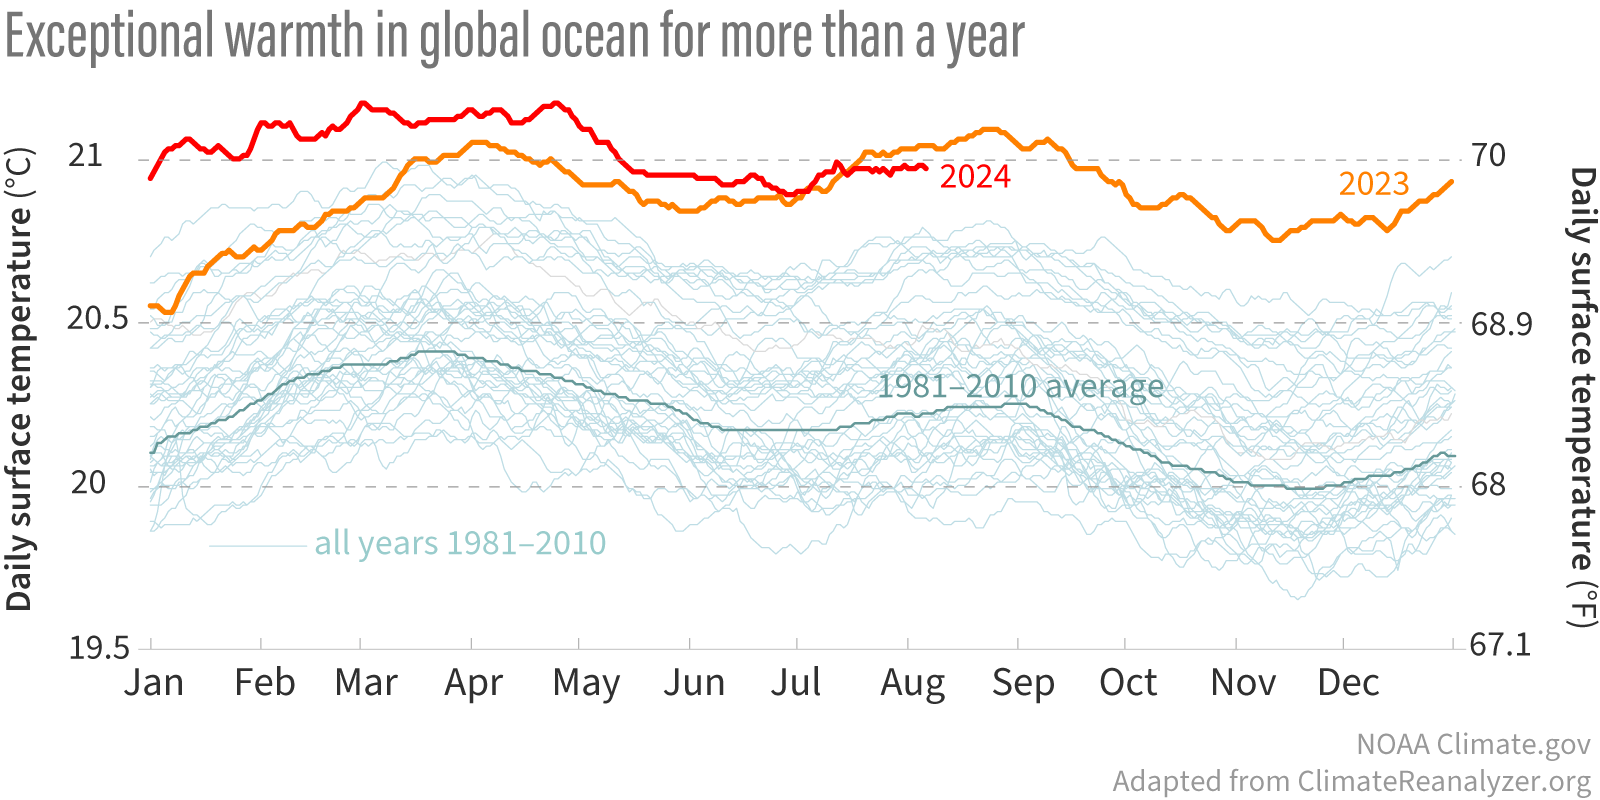
Daily surface temperatures for the global oceans between 60˚ North and South from 1981-2024 to date. From April of 2023 (orange line) through May 2024 (red line) temperatures were not only been much warmer than the 1981-2010 average (thick blue-green line), but record warm by a wide margin compared to all other years (thin blue-green lines). NOAA Climate.gov image adapted from Climate Reanalyzer. Explore NOAA's official monthly rankings with the Climate at a Glance tool from the National Centers for Environmental Information.
This overall heat brings me back to an excellent post Michelle wrote a few years ago describing the relative Oceanic Niño Index, which takes the temperature anomaly in the Niño3.4 region and subtracts the anomaly for the entire tropics. This helps to shine a clearer light on the local regions of relative warming or cooling across the Pacific, which is directly tied to increased or decreased tropical rainfall. While it is not NOAA’s official ENSO index, it is a newer index that the team monitors on the side.
Said more simply, it’s not just how much warmer or colder than average that part of the tropical Pacific is that jumbles up the tropical atmosphere, it’s the difference in warming or cooling compared the rest of the Pacific. And that’s where the relative ONI comes in!
So where do things stand? The regular ONI for May-July was +0.2°C. But the relative ONI was already down to -0.4°C. That means there could be a scenario later this year where the ONI is not yet below -0.5°C, but the relative ONI already is, and the atmosphere might start reflecting La Niña-like impacts. Doesn’t that seem like a pain to communicate? Tell me about it!
Luckily for me, if that does happen it will be Emily’s job to communicate it all when she’s back writing the monthly outlook posts next month. Sorry, Emily.
A blog about monitoring and forecasting El Niño, La Niña, and their impacts.
Disclaimer:
The ENSO blog is written, edited, and moderated by Michelle L’Heureux (NOAA Climate Prediction Center), Emily Becker (University of Miami/CIMAS), Nat Johnson (NOAA Geophysical Fluid Dynamics Laboratory), and Tom DiLiberto and Rebecca Lindsey (contractors to NOAA Climate Program Office), with periodic guest contributors.
Ideas and explanations found in these posts should be attributed to the ENSO blog team, and not to NOAA (the agency) itself. These are blog posts, not official agency communications; if you quote from these posts or from the comments section, you should attribute the quoted material to the blogger or commenter, not to NOAA, CPC, or Climate.gov.
Source: ENSO blog team

