


Important Note: The employment data for the month of July 2024 is taken from the survey week including July 12. Data for August is scheduled for release on September 20, 2024.
Unemployment Rate Stays at 5.2 Percent
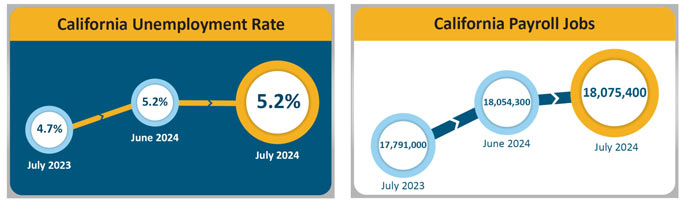
August 17, 2024 - SACRAMENTO – California’s employers added 21,100 nonfarm payroll jobs1 in July 2024 as the unemployment rate remained at 5.2 percent2 for the third consecutive month according to data released by the Employment Development Department (EDD). July’s job gain follows a revised job gain of 20,800 for June 2024.
California's Labor Market, by the Numbers...
- California’s gain of 21,100 accounted for 18.5 percent of the nation’s overall July gain of 114,000 jobs, which is notably stronger than California’s 11 percent share of jobs nationally.
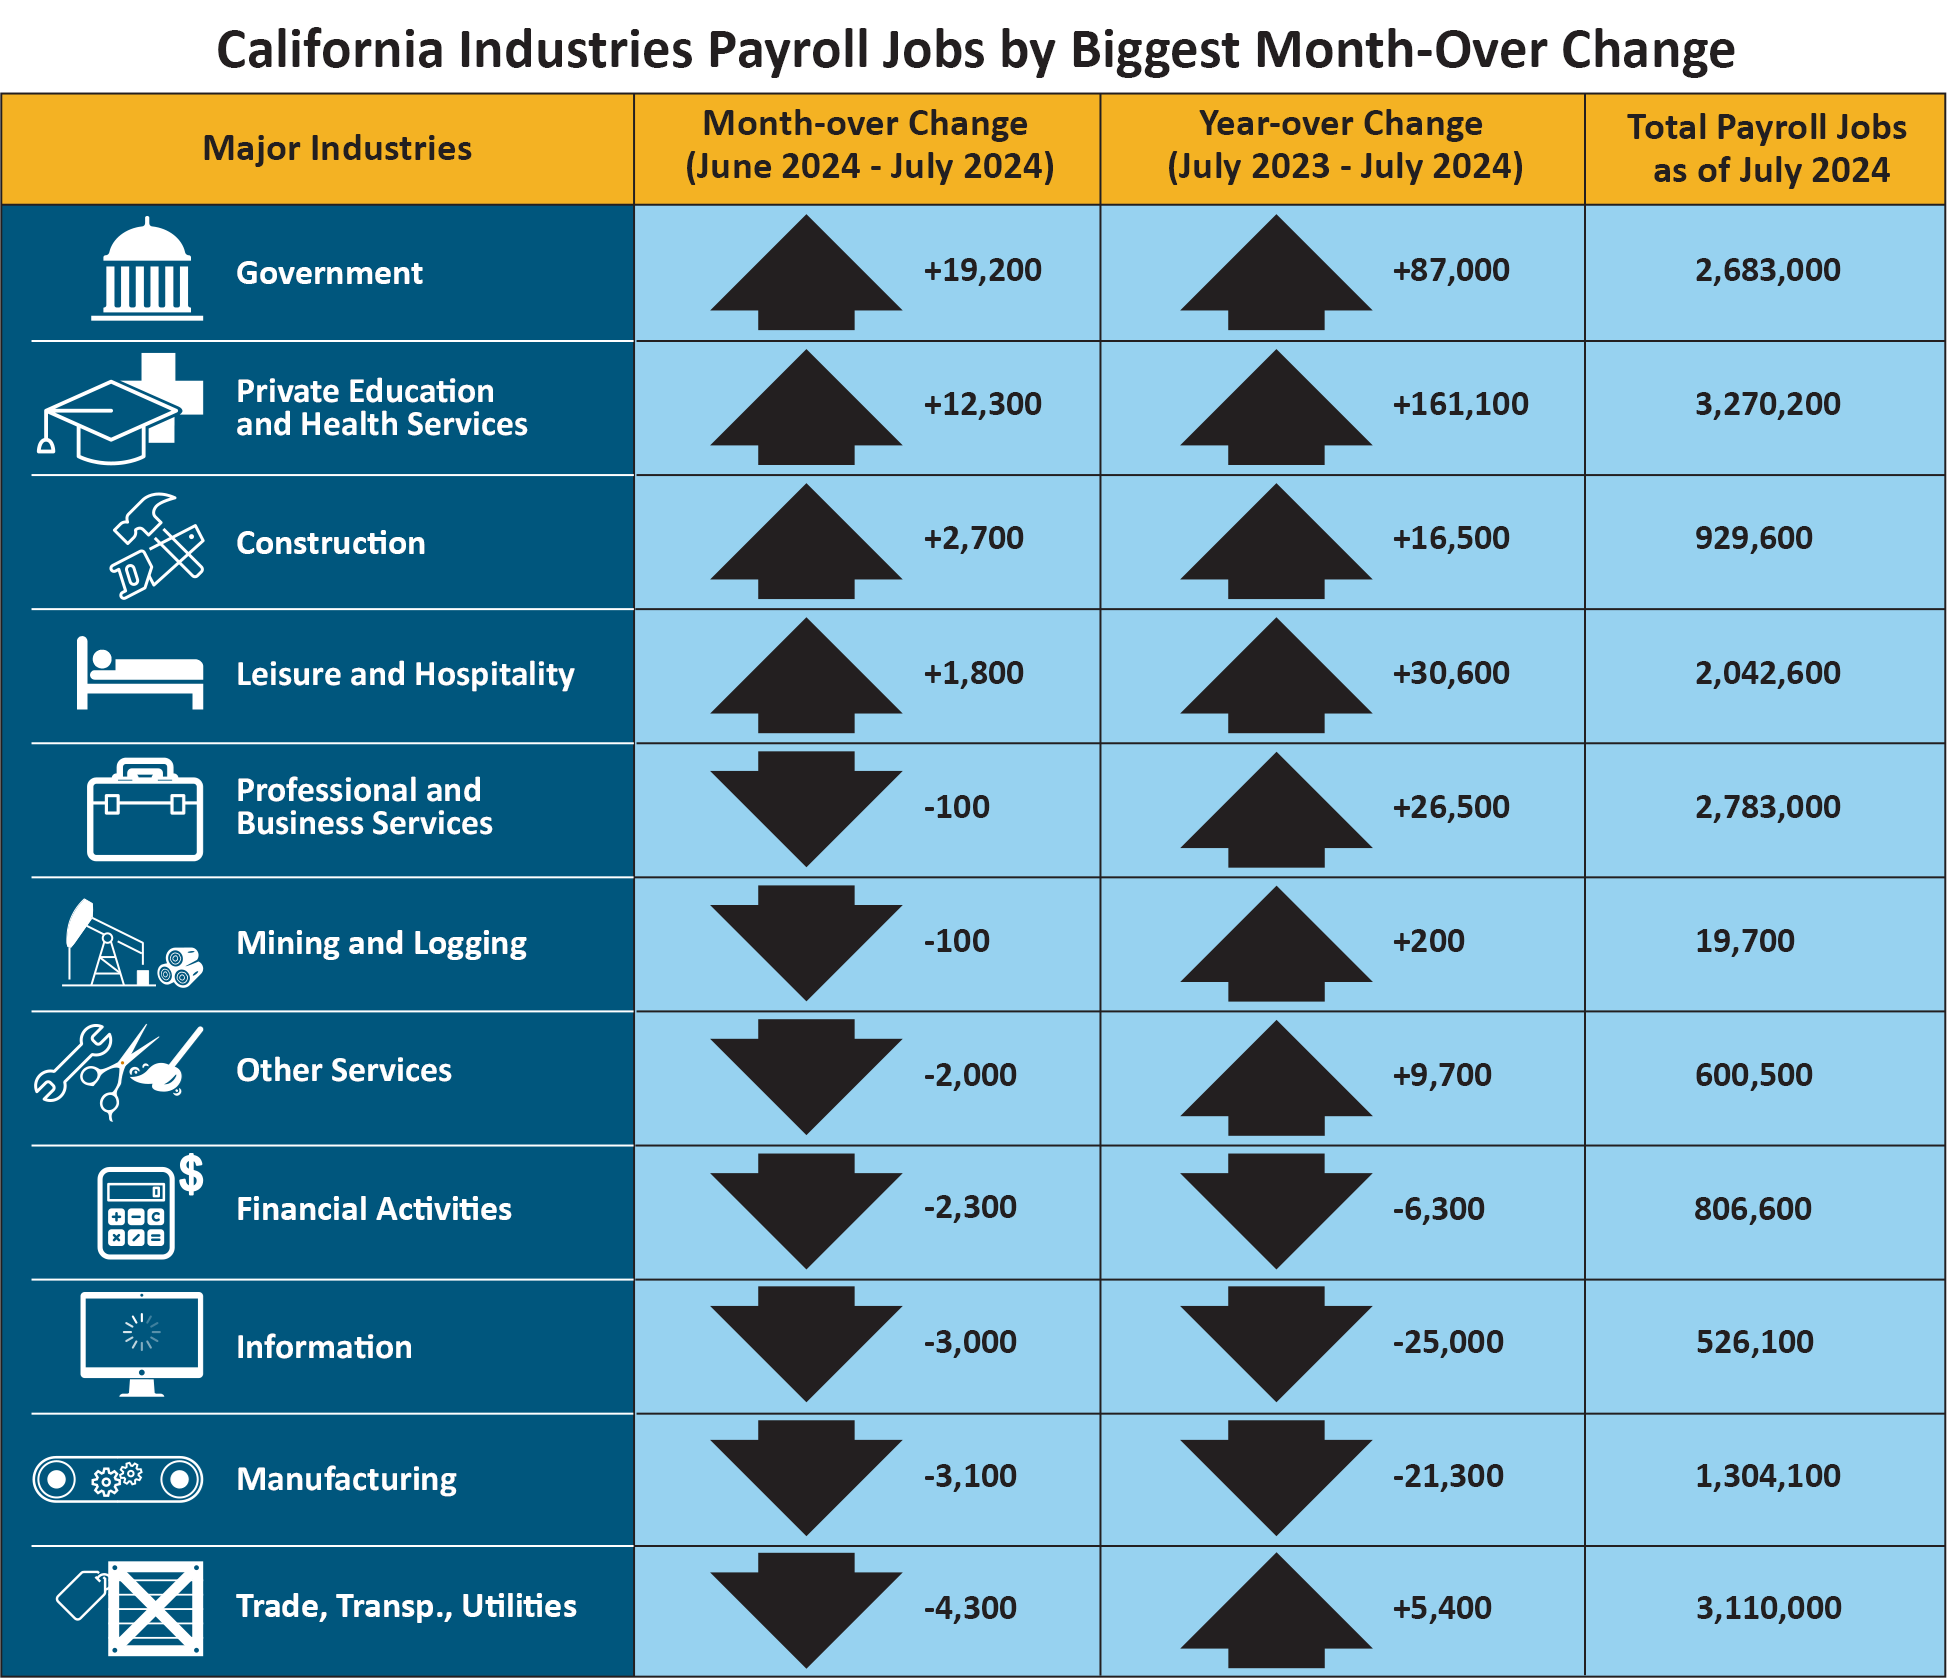
- Four of California's 11 industry sectors gained jobs in July with the largest increase in Government (+19,200). Both State and Local Government are prone to changes in the month of July due to end of school year impacts on educational services jobs.
- Private Education and Health Services (+12,300) showed significant growth, especially in Ambulatory Health Care Services and Private Education.
- Leisure & Hospitality (+1,800), which includes Limited Service Restaurants, also posted a month-over gain.
- The Trade, Transportation, and Utilities sector (-4,300) recorded the largest month-over job loss but has still posted an estimated 5,400 year-over job gain in comparison with July 2023.
1. The unemployment rate comes from a separate federal survey of 5,100 California households.
2. The nonfarm payroll job numbers come from a federal survey of 80,000 California businesses.
Data Trends about Jobs in the Economy
Total Nonfarm Payroll Jobs (Comes from a monthly survey of approximately 80,000 California businesses that estimates jobs in the economy – seasonally adjusted)
- Month-over – Total nonfarm jobs in California’s 11 major industries amounted to 18,075,400 in July – a net gain of 21,100 from June. This followed a downward revised (-1,700) month-over gain of 20,800 jobs in June.
- Year-over – Total nonfarm jobs increased by 284,400 (a 1.6 percent increase) from July 2023 to July 2024 compared to the U.S. annual gain of 2,512,000 jobs (a 1.6 percent increase).
 EEOmail@edd.ca.gov or call toll free 1-866-490-8879. " width="100%" style="box-sizing: border-box; vertical-align: middle; border-style: none;">
Total Farm Jobs – The number of jobs in the agriculture industry increased from June by 4,400 to a total of 419,100 jobs in July. The agriculture industry had 13,400 more farm jobs in July 2024 than it did in July of last year.
Data Trends about Workers in the Economy
Employment and Unemployment in California (Based on a monthly federal survey of 5,100 California households which focuses on workers in the economy)
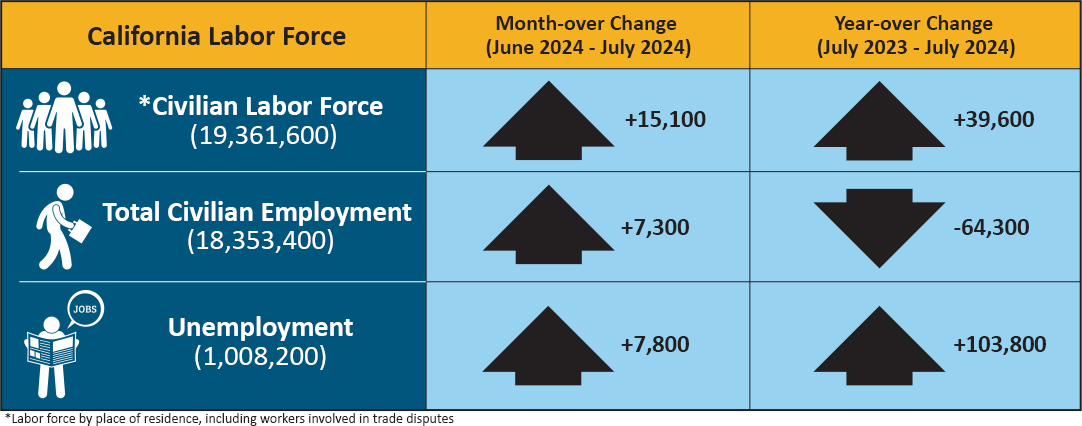
- Employed – The number of Californians employed in July was 18,353,400, an increase of 7,300 persons from June’s total of 18,346,100, but down 64,300 from the employment total in July 2023.
- Unemployed – The number of unemployed Californians was 1,008,200 in July, an increase of 7,800 over the month, but up 103,800 in comparison to July 2023.
Unemployment Insurance Claims (Not Seasonally Adjusted)
The following data is from a sample week that includes the 19th of each month:
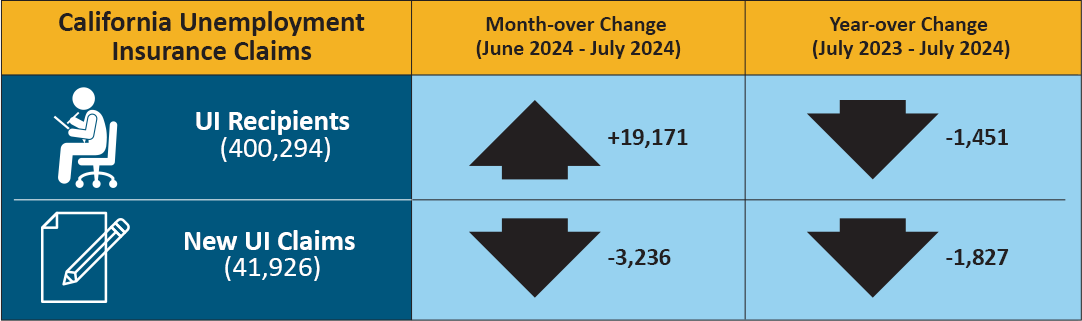
In related data that figures into the state’s unemployment rate, there were 400,294 people certifying for Unemployment Insurance (UI) benefits during the July 2024 sample week. That compares to 381,123 people in June and 401,745 people in July 2023. Concurrently, 41,926 initial claims were processed in the July 2024 sample week, which was a month-over decrease of 3,236 claims from June and a year-over decrease of 1,827 claims from July 2023.
| COUNTY | LABOR FORCE | EMPLOYMENT | UNEMPLOYMENT | RATE |
|---|---|---|---|---|
| STATE TOTAL | 19,439,600 | 18,315,300 | 1,124,300 | 5.8% |
| ALAMEDA | 827,400 | 785,300 | 42,200 | 5.1% |
| ALPINE | 520 | 480 | 40 | 7.7% |
| AMADOR | 14,540 | 13,730 | 800 | 5.5% |
| BUTTE | 90,300 | 84,600 | 5,700 | 6.4% |
| CALAVERAS | 22,680 | 21,580 | 1,100 | 4.9% |
| COLUSA | 11,100 | 9,900 | 1,200 | 10.8% |
| CONTRA COSTA | 551,800 | 523,300 | 28,500 | 5.2% |
| DEL NORTE | 9,150 | 8,570 | 580 | 6.3% |
| EL DORADO | 94,600 | 90,200 | 4,400 | 4.7% |
| FRESNO | 460,700 | 423,600 | 37,200 | 8.1% |
| GLENN | 12,340 | 11,470 | 870 | 7.1% |
| HUMBOLDT | 59,300 | 56,100 | 3,200 | 5.5% |
| IMPERIAL | 73,400 | 59,700 | 13,700 | 18.7% |
| INYO | 8,770 | 8,420 | 350 | 4.0% |
| KERN | 391,700 | 354,700 | 37,100 | 9.5% |
| KINGS | 59,100 | 53,900 | 5,100 | 8.7% |
| LAKE | 28,420 | 26,700 | 1,730 | 6.1% |
| LASSEN | 8,440 | 7,940 | 500 | 6.0% |
| LOS ANGELES | 5,091,300 | 4,760,000 | 331,400 | 6.5% |
| MADERA | 65,500 | 60,200 | 5,300 | 8.1% |
| MARIN | 132,600 | 127,200 | 5,400 | 4.1% |
| MARIPOSA | 8,210 | 7,790 | 410 | 5.0% |
| MENDOCINO | 38,020 | 36,030 | 1,990 | 5.2% |
| MERCED | 124,300 | 112,400 | 11,900 | 9.6% |
| MODOC | 3,270 | 3,080 | 190 | 5.9% |
| MONO | 9,060 | 8,690 | 370 | 4.1% |
| MONTEREY | 230,000 | 216,400 | 13,500 | 5.9% |
| NAPA | 73,600 | 70,500 | 3,100 | 4.1% |
| NEVADA | 50,010 | 47,760 | 2,250 | 4.5% |
| ORANGE | 1,596,400 | 1,526,200 | 70,200 | 4.4% |
| PLACER | 196,800 | 188,000 | 8,900 | 4.5% |
| PLUMAS | 7,890 | 7,420 | 470 | 6.0% |
| RIVERSIDE | 1,162,500 | 1,093,300 | 69,200 | 5.9% |
| SACRAMENTO | 739,800 | 700,900 | 38,800 | 5.3% |
| SAN BENITO | 32,300 | 30,100 | 2,200 | 6.7% |
| SAN BERNARDINO | 1,016,900 | 958,800 | 58,100 | 5.7% |
| SAN DIEGO | 1,594,300 | 1,516,300 | 78,000 | 4.9% |
| SAN FRANCISCO | 557,100 | 535,100 | 22,000 | 3.9% |
| SAN JOAQUIN | 350,500 | 326,000 | 24,500 | 7.0% |
| SAN LUIS OBISPO | 136,600 | 130,800 | 5,800 | 4.2% |
| SAN MATEO | 440,900 | 424,100 | 16,800 | 3.8% |
| SANTA BARBARA | 223,500 | 213,600 | 10,000 | 4.5% |
| SANTA CLARA | 1,035,000 | 989,300 | 45,700 | 4.4% |
| SANTA CRUZ | 135,200 | 127,400 | 7,800 | 5.8% |
| SHASTA | 74,200 | 69,900 | 4,300 | 5.8% |
| SIERRA | 1,410 | 1,350 | 60 | 4.3% |
| SISKIYOU | 16,330 | 15,240 | 1,090 | 6.7% |
| SOLANO | 205,100 | 193,700 | 11,400 | 5.6% |
| SONOMA | 249,500 | 238,600 | 10,900 | 4.4% |
| STANISLAUS | 250,000 | 231,400 | 18,700 | 7.5% |
| SUTTER | 48,400 | 44,500 | 3,800 | 7.9% |
| TEHAMA | 25,790 | 24,010 | 1,770 | 6.9% |
| TRINITY | 4,800 | 4,530 | 270 | 5.6% |
| TULARE | 211,500 | 188,500 | 23,100 | 10.9% |
| TUOLUMNE | 20,620 | 19,450 | 1,170 | 5.7% |
| VENTURA | 412,100 | 391,400 | 20,700 | 5.0% |
| YOLO | 111,300 | 105,300 | 6,000 | 5.4% |
| YUBA | 32,600 | 30,200 | 2,500 | 7.5% |
Source: EDD

