


September 14, 2024 - By Emily Becker - The tropical Pacific is still in neutral, but nature continues giving us signs that La Niña is on the way, and our La Niña Watch remains. Forecasters estimate a 71% chance that La Niña will emerge during September–November and expect it will persist through the Northern Hemisphere winter. A weak La Niña is the most likely scenario.
Opening credits
While there are no plot twists since Tom’s August post—frequent readers could be forgiven for fast-forwarding this month’s update—that 71% chance of La Niña developing this autumn is a small upward tick. Also, the slower-than-expected development of La Niña is a great example of how the short-term (subseasonal) and very long-term (climate change) complicate seasonal outlooks. I’ll run the numbers in a minute, after a word from our sponsor.
Hello folks! Do you wish you could get a heads-up about what your winter rain, snow, and temperature conditions might be like? Ask your forecaster about ENSO, the El Niño/Southern Oscillation! This seasonal climate phenomenon is made from the surface temperature of the tropical Pacific, including warmer-than-average water (El Niño) and cooler-than-average water (La Niña), and can be predicted months in advance. ENSO changes global atmospheric circulation in known ways; common side-effects may include shifts in the jet stream and changes in global temperature and precipitation patterns, droughts, and heatwaves.
Back to our regularly scheduled program
ENSO forecasters get their information from two general areas: climate prediction models and current observed conditions in the ocean and atmosphere. Climate models are up first, today. (See footnote.)
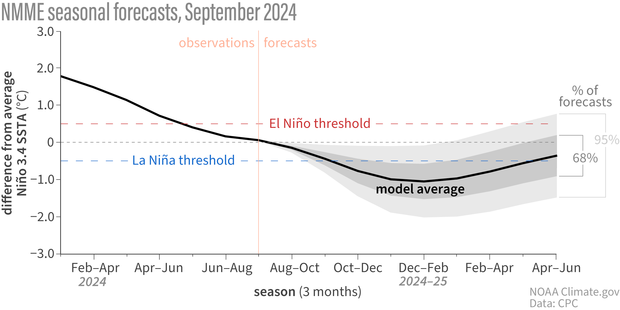
Line graph showing observed and predicted temperatures (black line) in the key ENSO-monitoring region of the tropical Pacific from early 2024 though spring 2025. The gray shading shows the range of temperatures predicted by individual models that are part of the North American Multi Model Ensemble (NMME, for short). Most of the shading appears below the dashed blue line by the fall, meaning most models predict that temperature in the Niño-3.4 region of the tropical Pacific will be cooler than average by at least 0.5 degrees Celsius (0.9 degrees Fahrenheit)—the La Niña threshold. NOAA Climate.gov image, based on data provided by Climate Prediction Center.
The North American Multi-Model Ensemble (NMME) is a collection of computer models that take information about current global conditions and apply physical equations to make predictions about upcoming weather and climate. For more about the NMME, check out this ENSO Blog post and this recent one from our friends at Seasoned Chaos.
This set of climate models has been predicting the development of La Niña since last winter, and continues to do so, although it’s taking a little longer than initially expected. This isn’t particularly surprising, since predictions made in the spring are often less accurate than predictions made at other times of the year. Overall, though, the models’ prediction of La Niña this upcoming winter has been consistent, including from last month to this month, providing continued confidence in the forecast despite the slowdown.
Reality TV
Time to check in with a few of our favorite characters. Our primary metric for ENSO, the surface temperature of the tropical Pacific Ocean in the Niño-3.4 region, was about 0.1 °C cooler than the long-term average (long-term = 1991–2020) in August, according to the ERSSTv5 dataset. This is solidly neutral—the La Niña threshold is 0.5 °C cooler than average—and only a small drop from July.
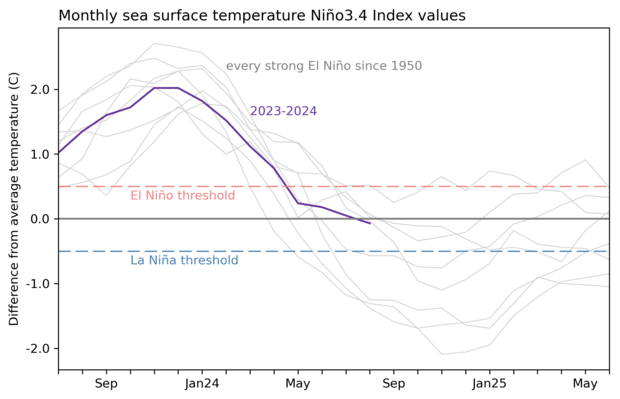
2-year history of sea surface temperatures in the Niño-3.4 region of the tropical Pacific for all strong El Niño events since 1950 (gray lines) and the recent (2023-24) event (purple line). Five of the eight gray lines dip below the dashed blue line (the La Niña threshold) in the winter following the El Niño. The 2023-24 event appears headed in the same direction. Graph by Emily Becker based on monthly Niño-3.4 index data from CPC using ERSSTv5.
The winds over the tropical Pacific play an important role in ENSO’s dramatic arc. When the near-surface winds in the tropics—the trade winds—are stronger, they cool the surface and keep warmer water piled up in the far western Pacific. They can also trigger an upwelling Kelvin wave, an area of cooler-than-average water under the surface that moves from west to east. Throughout August, the trade winds were stronger than average across most of the tropical Pacific, helping to maintain the gradual surface cooling tendency and to bolster the amount of cooler water under the surface. This cooler subsurface water will provide a source to the surface over the next few months.
Beneath the surface of the tropical Pacific Ocean at the equator, a deep pool of cooler-than-average (blue) waters has been building up over the past couple of months (July 12–Sept. 5, 2024). This pool of relatively cool water is a key factor behind the prediction for La Niña later this fall and winter. NOAA Climate.gov image, based on analysis from Michelle L'Heureux, Climate Prediction Center.
Character development
We started this La Niña Watch party back in February. Looking back at that forecast, the probability of La Niña developing by June–August was about 55%, with about a 42% chance of ENSO-neutral during that period. These probabilities mean that La Niña’s development in June–August was favored, but there was still a good chance that neutral would linger. As it turned out, the June–August average sea surface temperature in the Niño-3.4 region, the “Oceanic Niño Index,” was 0.1 °C below average, in the neutral range.
So why is La Niña behind schedule? Honestly, nature is wild and crazy and it amazes me that we can predict anything ever, especially many months in advance. In this case, though, there are a couple of complicating factors we can point to. The first is our old frenemy, short-term variability, or, essentially, unpredictable weather events that complicate seasonal or longer predictions. For example, just a few periods of weaker trade winds can delay surface cooling. Unfortunately, predicting such short-term variations is an ongoing challenge, and currently we can only predict these trade wind fluctuations a week or so in advance.
On the other side of the timeline, we have climate change. The global ocean temperatures are still way above average, and they are predicted to drop only slightly over the next several months. We don’t yet have a clear picture of how global warming may affect ENSO in general, or the development of La Niña this year in specific.
Coming up on La Niña Watch
That said, the most likely outcome is still that La Niña will be in place this winter, with slightly greater than 80% chance of La Niña in November–January, probably a weaker event (see strength probabilities here).
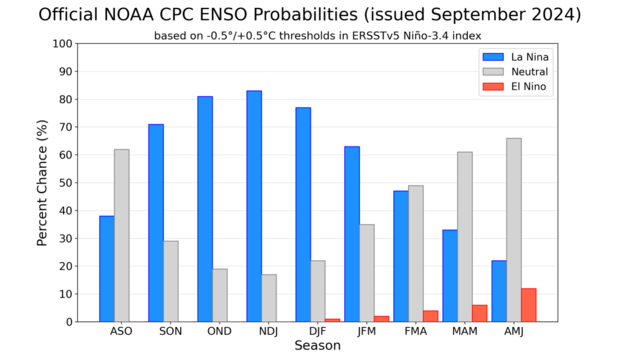
Out of the three climate possibilities—La Niña, El Niño, and neutral—forecasts say that neutral conditions are the most likely for the August–October season (tall gray bar above the ASO label, slightly over 60 percent chance). By the September-November (SON) season, La Niña has the highest chance of occurring (blue bar, 71 percent chance). NOAA Climate Prediction Center image.
A weak La Niña wouldn’t play as large a part in steering global atmospheric circulation patterns, meaning a lower chance of La Niña’s typical impacts on winter conditions. However, even a weak La Niña can nudge the winter climate and would likely factor into CPC’s winter outlook.
Stay tuned here for recaps and predictions about your favorite program, ENSO!
Footnote
There are two kinds of prediction models, dynamical and statistical. The model information I discuss in this post is from dynamical models. Statistical models use historical observations and their relationships to predict how conditions might evolve. Statistical models do not use physical equations, but rather statistical formulations that produce forecasts based on a long history of past observations of sea surface temperature, atmospheric pressure, subsurface temperature, and others. Statistical models have been around longer than dynamical models, because the dynamical ones require high performance computers.
A blog about monitoring and forecasting El Niño, La Niña, and their impacts.
Disclaimer:
The ENSO blog is written, edited, and moderated by Michelle L’Heureux (NOAA Climate Prediction Center), Emily Becker (University of Miami/CIMAS), Nat Johnson (NOAA Geophysical Fluid Dynamics Laboratory), and Tom DiLiberto and Rebecca Lindsey (contractors to NOAA Climate Program Office), with periodic guest contributors.
Ideas and explanations found in these posts should be attributed to the ENSO blog team, and not to NOAA (the agency) itself. These are blog posts, not official agency communications; if you quote from these posts or from the comments section, you should attribute the quoted material to the blogger or commenter, not to NOAA, CPC, or Climate.gov.
Source: ENSO blog team

