


New Ipsos polling finds that Americans believe people like themselves are among the most underrepresented groups in entertainment
October 21, 2024 - Washington, D.C. – The latest Ipsos Entertainment Poll finds that, on average, Americans feel personally excluded from or negatively represented in the entertainment, TV, and movies they watch. In particular, men, LGB* Americans, Republicans, and independents are more likely than their counterparts to believe people like them are generally excluded or negatively portrayed in the media they consume. These sentiments are stable from the first annual Ipsos Entertainment Poll fielded in August 2023.
Download Poll
This poll also finds that Americans, on average, believe people with disabilities and Asian Americans are some of the most excluded groups in the media they consume. Conversely, Americans, on average, believe that liberal, gay or lesbian, white, or male people are over-exposed in the entertainment, TV, or movies they watch.
Beyond media representation, this study explores personal beliefs in the media as well as Americans’ perceptions of streaming services. The poll finds that few Americans say they can always find entertainment that reflects their values. In fact, a plurality of Americans says that the stuff coming out of Hollywood is too liberal for their taste. Lastly, when it comes to streaming, the majority of Americans feel the number of streaming services to choose from is overwhelming, but most acknowledge they also do not have trouble finding what they want to watch.
For more information about the 2023 Ipsos Entertainment Poll, please click here.
*Note: LGB Americans include Americans who identify their sexual orientation as gay, lesbian, bisexual, or “something else” other than heterosexual.
Detailed Findings:
1. Americans, on average, feel personally excluded from and negatively portrayed in the media they consume. These sentiments vary significantly by subgroup, including sexual orientation and party affiliation.
- Consistent from August 2023, Americans, on average, report that people like themselves are among the most excluded groups in the entertainment, movies, or TV they watch. Notably, one-third of Americans report that people like them are excluded from the media they consume, while 9% say that people like themselves are over-exposed. Just half of Americans (52%) say that people like them are represented the right amount, neither excluded nor over-exposed.
- Similar to August 2023, Americans, on average, report that people like themselves are among the most negatively portrayed groups in the media they consume. About one-quarter of Americans (28%) say that people like them are portrayed negatively in the media they consume, while just 16% say they are positively portrayed. Half of Americans say that the media portrayal of people like them is generally balanced, neither positive nor negative.
- LGB Americans are more likely than heterosexual Americans, on average, to say that people like them are generally excluded from the entertainment, TV, and movies they watch. And, while straight Americans are more likely to say the portrayals of people like them are generally balanced, LGB Americans are more likely to report that portrayals of people like them in the media they consume lean negative.
- Republicans and independents are, on average, more likely than Democrats to report that they are excluded from the entertainment, TV, and movies they watch. Additionally, Republicans and independents are more likely to say that, on average, people like them are negatively portrayed in the media they consume compared to Democrats.
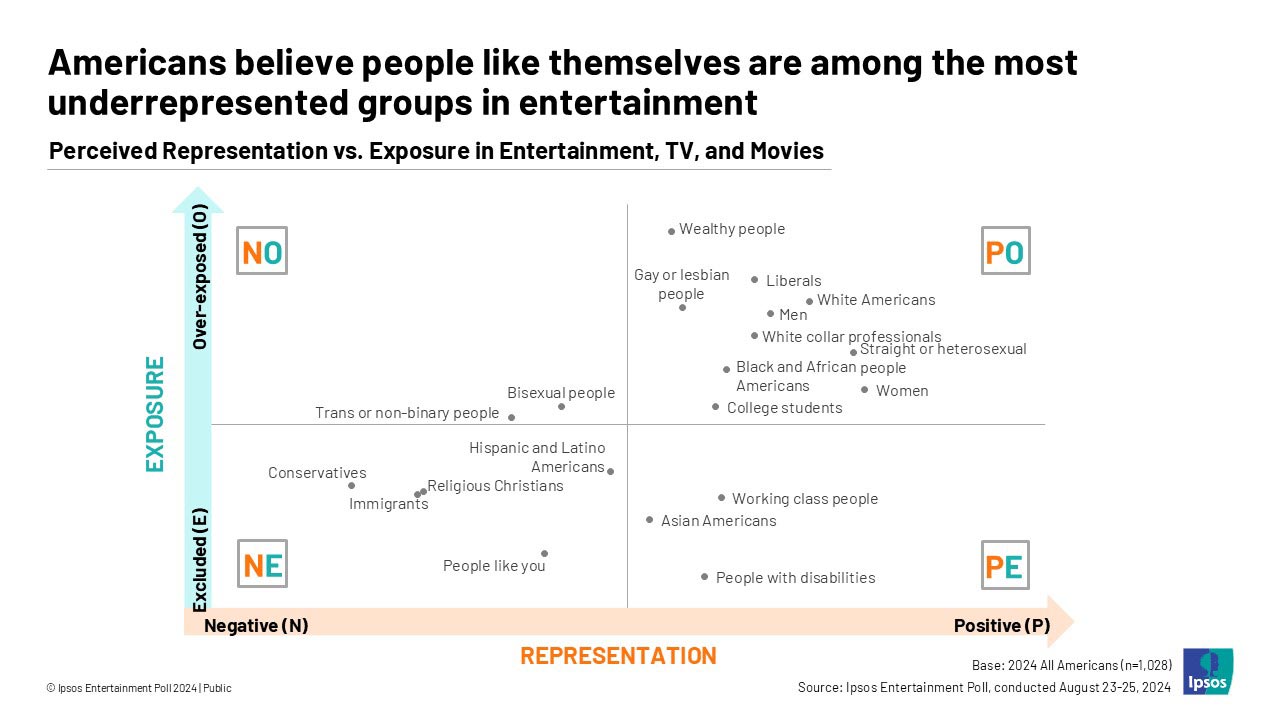
2. Americans say people with disabilities and Asian Americans are the most excluded, underrepresented groups in entertainment. Meanwhile, Americans say wealthy, liberal, gay or lesbian, white, and male people are the most over-exposed groups in entertainment.
- Americans are most likely to say people with disabilities and Asian Americans are excluded from the entertainment, TV, and movies they watch.
- In contrast, Americans are most likely to say wealthy people, liberals, white Americans, and gay or lesbian people are overexposed in the media they consume. These sentiments are consistent from August 2023.
- Americans are most likely to say women, heterosexual people, and white people are represented positively in the entertainment they consume. Conversely, Americans are most likely to believe that conservatives, immigrants, religious Christians, and trans or non-binary people are represented negatively.
- While Americans generally say the working class, Asian Americans, and people with disabilities are excluded from the media they consume, they also say that these groups, when portrayed, are shown in a balanced light (neither negative nor positive).
3. A plurality of Americans says that the stuff coming out of Hollywood is too liberal for their taste, and few say they can always find entertainment that reflects their values. These perspectives vary significantly by party affiliation.
- Similar to August 2023 (39%), about two in five Americans (37%) agree that most of the stuff coming out of Hollywood is too liberal for their taste. One-quarter (25%) disagree, and 29% say they neither agree nor disagree.
- Two in five (39%) Americans agree that they can always find entertainment that reflects their beliefs and values, stable from 40% in August 2023. One-fifth (22%) say they disagree, and 32% say they neither agree nor disagree.
- More Republicans (67%) and independents (42%) say the stuff coming out of Hollywood is too liberal for them compared to Democrats (11%).
- That said, Democrats are more likely than independents or Republicans to say they can always find entertainment that reflects their beliefs and values (51% vs. 40% and 32%, respectively).
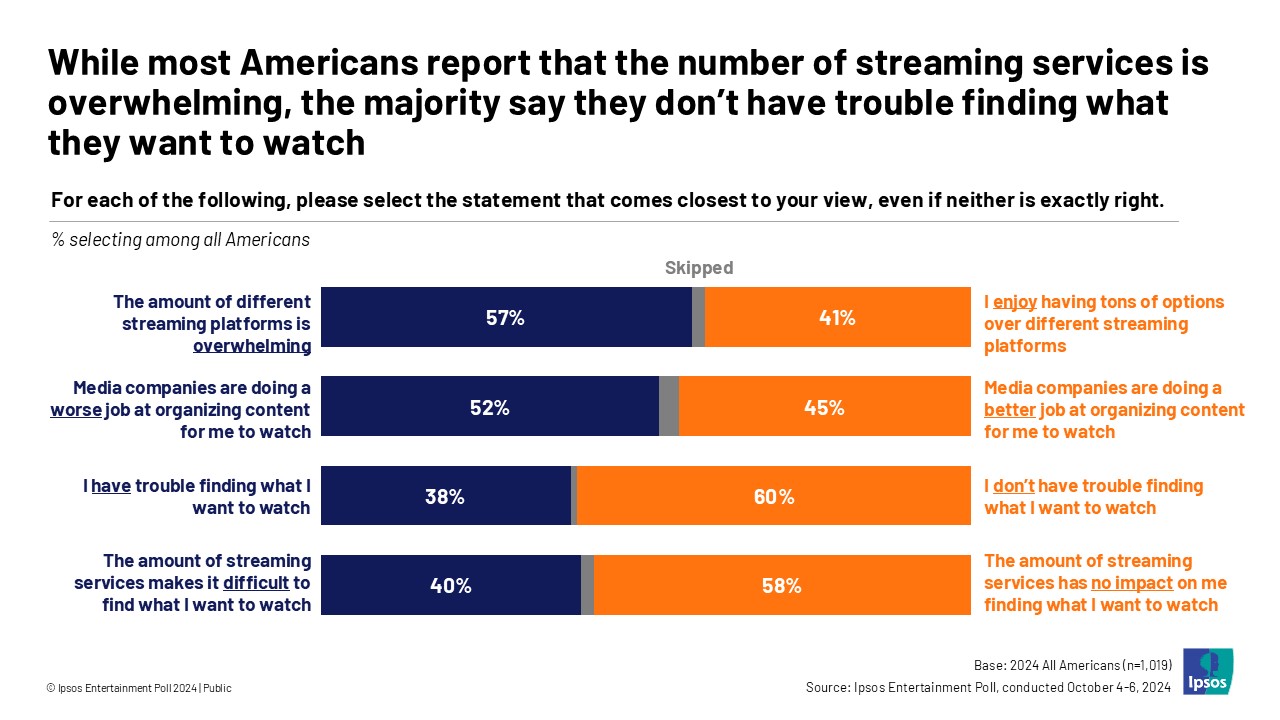
4. While most Americans report that the number of streaming services is overwhelming, the majority say the number of streaming services has no impact on finding what they want to watch.
- About three in five (57%) Americans say that the amount of streaming services is overwhelming. Just 41% say they enjoy having tons of options over different streaming services.
- More than half (58%) of Americans say the amount of streaming services has no impact on them finding what they want to watch. Two in five (40%) say that the amount of streaming services makes it difficult to find what they want to watch.
- A majority of Americans across age groups say the amount of different streaming services is overwhelming, including 53% of those ages 18-34, 54% of those ages 35-49, and 61% of those ages 50-64 and ages 65+. However, Americans ages 18-34 are more likely than those ages 65+ to say that the amount of streaming services makes it difficult to find what they want to watch (47% vs. 32%, respectively).
- Black Americans are more likely than Hispanic or white Americans to say they enjoy having tons of options over different streaming services (62% vs. 41% and 37%, respectively). Black Americans are also more likely than Hispanic and white Americans to say that the amount of streaming services has no impact on them finding what they want to watch (72% vs. 57% each, respectively).
- Americans are split on the job that media companies are doing at organizing content. Fifty-two percent believe they are doing a worse job, while 45% say they are doing a better job.
- Lastly, 60% of Americans report that they do not have trouble finding what to watch. Those ages 18-34 (51%) are less likely to share this sentiment than their older counterparts.
About the Study
This Ipsos poll was conducted between August 23-25, 2024, by Ipsos using the probability-based KnowledgePanel®. Questions 1-12 were conducted during these dates. This poll is based on a nationally representative probability sample of 1,028 general population adults age 18 or older.
This Ipsos poll was also conducted between October 4-6, 2024, by Ipsos using the probability-based KnowledgePanel®. Question 13 was conducted during these dates. This poll is based on a nationally representative probability sample of 1,019 general population adults age 18 or older.
The margin of sampling error for this study is plus or minus 3.3 percentage points at the 95% confidence level, for results based on the entire sample of adults. The margin of sampling error takes into account the design effect, which was 1.17 for all respondents.
In our reporting of the findings, percentage points are rounded off to the nearest whole number. As a result, percentages in a given table column may total slightly higher or lower than 100%. In questions that permit multiple responses, columns may total substantially more than 100%, depending on the number of different responses offered by each respondent.
The survey was conducted using KnowledgePanel, the largest and most well-established online probability-based panel that is representative of the adult US population. Our recruitment process employs a scientifically developed addressed-based sampling methodology using the latest Delivery Sequence File of the USPS – a database with full coverage of all delivery points in the US. Households invited to join the panel are randomly selected from all available households in the U.S. Persons in the sampled households are invited to join and participate in the panel. Those selected who do not already have internet access are provided a tablet and internet connection at no cost to the panel member. Those who join the panel and who are selected to participate in a survey are sent a unique password-protected log-in used to complete surveys online. As a result of our recruitment and sampling methodologies, samples from KnowledgePanel cover all households regardless of their phone or internet status and findings can be reported with a margin of sampling error and projected to the general population.
The data for the total sample were weighted to adjust for gender by age, race/ethnicity, education, Census region, metropolitan status, and household income. The demographic benchmarks came from the 2022 March Supplement of the Current Population Survey (CPS).
- Gender (Male, Female) by Age (18–29, 30–44, 45–59 and 60+)
- Race/Hispanic Ethnicity (White Non-Hispanic, Black Non-Hispanic, Other, Non-Hispanic, Hispanic, 2+ Races, Non-Hispanic)
- Education (Less than High School, High School, Some College, Bachelor or higher)
- Census Region (Northeast, Midwest, South, West)
- Metropolitan status (Metro, non-Metro)
- Household Income (Under $25,000, $25,000-$49,999, $50,000-$74,999, $75,000-$99,999, $100,000-$149,999, $150,000+)
- Party ID (Democrat, Republican, Independent, Something else)
This topline is trended with data from a study conducted August 25-27, 2023 by Ipsos using the probability-based KnowledgePanel®. The August 2023 poll is based on a nationally representative probability sample of 1,026 general population adults age 18 or older. For the August 2023 study, the margin of sampling error is plus or minus 3.1 percentage points at the 95% confidence level for results based on the entire sample of adults. The margin of sampling error takes into account the design effect, which was 1.03 for all respondents.
About Ipsos
Ipsos is one of the largest market research and polling companies globally, operating in 90 markets and employing over 18,000 people.
Our passionately curious research professionals, analysts and scientists have built unique multi-specialist capabilities that provide true understanding and powerful insights into the actions, opinions and motivations of citizens, consumers, patients, customers or employees. We serve more than 5000 clients across the world with 75 business solutions.
Founded in France in 1975, Ipsos is listed on the Euronext Paris since July 1st, 1999. The company is part of the SBF 120 and the Mid-60 index and is eligible for the Deferred Settlement Service (SRD).
Source: Ipsos

