


Click Here to View Document
August 19, 2016 - From 1989 to 2013, family wealth grew at significantly different rates for different segments of the U.S. population, and the distribution among the nation’s families was more unequal in 2013 than it had been in 1989.
Summary
In 2013, aggregate family wealth in the United States was $67 trillion (or about four times the nation’s gross domestic product) and the median family (the one at the midpoint of the wealth distribution) held approximately $81,000, CBO estimates. For this analysis, CBO calculated that measure of wealth as a family’s assets minus its debt. CBO measured wealth as marketable wealth, which consists of assets that are easily tradable and that have value even after the death of their owner. Those assets include home equity, other real estate (net of real estate loans), financial securities, bank deposits, defined contribution pension accounts, and business equity. Debt is nonmortgage debt, including credit card debt, auto loans, and student loans, for example.
How Is the Nation’s Wealth Distributed?
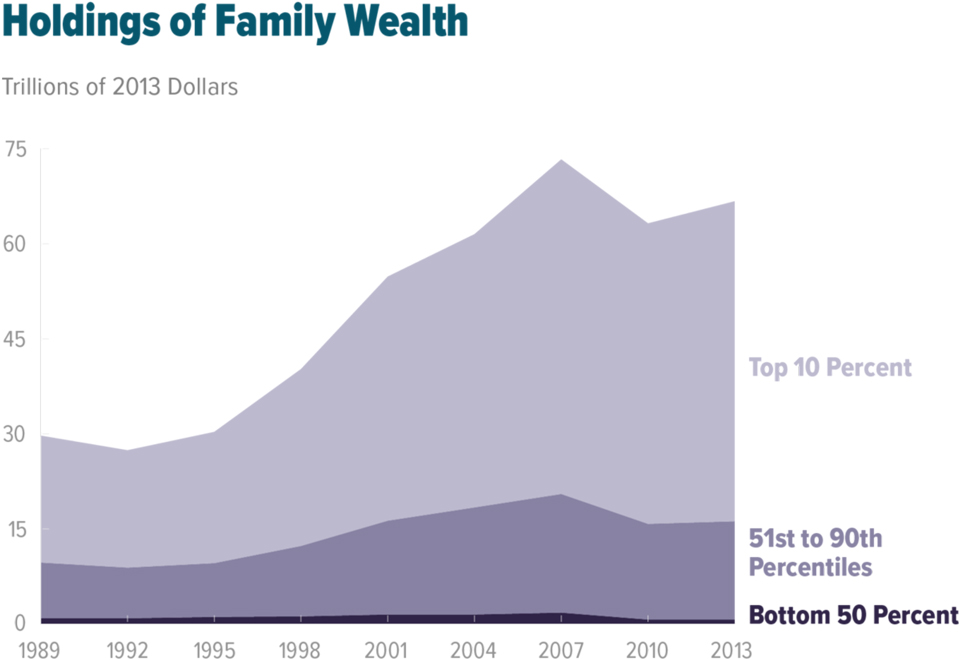
In 2013, families in the top 10 percent of the wealth distribution held 76 percent of all family wealth, families in the 51st to the 90th percentiles held 23 percent, and those in the bottom half of the distribution held 1 percent. Average wealth was about $4 million for families in the top 10 percent of the wealth distribution, $316,000 for families in the 51st to 90th percentiles, and $36,000 for families in the 26th to 50th percentiles. On average, families at or below the 25th percentile were $13,000 in debt.There are significant differences in wealth among different age and education groups. In 2013, the median family wealth of families headed by someone who was age 65 or older—$211,000—was more than 3½ times the median wealth of families headed by someone between the ages of 35 and 49. Similarly, median wealth of families headed by someone with a college degree—$202,000—was almost four times the median wealth of families headed by someone with a high school diploma.
How Did the Distribution of Wealth Change From 1989 to 2013?
Over the period from 1989 through 2013, family wealth grew at significantly different rates for different segments of the U.S. population. In 2013, for example:- The wealth of families at the 90th percentile of the distribution was 54 percent greater than the wealth at the 90th percentile in 1989, after adjusting for changes in prices.
- The wealth of those at the median was 4 percent greater than the wealth of their counterparts in 1989.
- The wealth of families at the 25th percentile was 6 percent less than that of their counterparts in 1989.
Two developments contributed to the change in the distribution of wealth: Compared with families in the top half of the distribution, families in the bottom half experienced disproportionately slower growth in wealth between 1989 and 2007, and they had a disproportionately larger decline in wealth after the recession of 2007 to 2009.
Estimates of the trends in wealth dispersion at the very top of the distribution differ depending on data set and methodology. Estimates based on data from the Survey of Consumer Finances (SCF), supplemented with data on the nation’s 400 wealthiest families, suggest that the share of wealth held by those in the top 1 percent increased by 6 percentage points—from 31 percent to 37 percent—between 1989 and 2013. By contrast, estimates based on other data and methodologies suggest that the share of wealth held by the top 1 percent increased by 14 percentage points—from 28 percent to 42 percent—between 1989 and 2012.
CBO’s analyses in this report—including that of trends in the share of wealth held by the top 10 percent of the distribution—are not very sensitive to the differences in estimates of wealth in the top 1 percent of the distribution. A detailed investigation of the sources of the differences in estimates of wealth held at the very top of the distribution would have been a significant undertaking that was outside the scope of this analysis.
Changes in wealth over the period were not the same for families headed by people of different ages or with different amounts of education. Families headed by someone who was age 65 or older held greater median wealth in 2013 than their counterparts did in 1989, but the same was not true for families headed by a person younger than 65. Median wealth was greater in 2013 than it had been in 1989 for families headed by someone with at least a bachelor’s degree; the opposite was true for their less educated counterparts. (Examining median wealth for those groups over time allowed CBO to avoid placing disproportionate weight on changes in wealth at the top of the distribution.)
How Did Changes in Families’ Assets and Debt Contribute to Changes in the Wealth Distribution From 1989 to 2013?
To explore changes in assets and debt, this report focuses on wealth held by those in the bottom 90 percent of the wealth distribution. A detailed analysis of the categories of assets and debt held by families above the 90th percentile of the wealth distribution is not possible because information about the composition of wealth for the nation’s 400 wealthiest families is incomplete. Also, estimates of the share of total wealth held by families in the bottom 90 percent and its change over time are generally consistent, regardless of data or methodology. (See the appendix for additional discussion.)In 2013, average wealth for families in the 51st to 90th percentiles was greater than it had been in 1989. In contrast, average wealth for families in the bottom half of the distribution was less in 2013 than in 1989. (Examining average wealth for various groups below the 90th percentile allowed CBO to assess the relative contributions of changes in assets and debt to the changes in those averages over time. Because those averages exclude the top 10 percent of the distribution, they are not influenced by the wealth at the top of the distribution.)
Although average wealth had increased for families in the 51st to 90th percentiles and for those in the 26th to 50th percentiles between 1989 and 2007, the decline in wealth associated with the recession more than offset earlier increases for the latter group. For those families, increases in home equity and in financial and other assets contributed to rising wealth between 1989 and 2007, and conversely, losses in home equity and in financial and other assets after 2007 contributed to the decline in average wealth over the period. Average wealth of families in the bottom 25 percent changed little between 1989 and 2007 but declined after 2007. Declines in home equity and increases in nonmortgage debt were among the factors contributing to the decline in average wealth for those families.
For those at the bottom of the distribution of wealth between 1989 and 2013, but especially after 2007, the share of families that had more debt than assets increased, as did their average indebtedness. For instance, 8 percent of families had more debt than assets in 2007, and they were, on average, $20,000 in debt. By 2013, 12 percent of families had more debt than assets, and they were, on average, $32,000 in debt.

