


2025 Ford Maverick Credit: Ford
KEY TAKEAWAYS
- August new-vehicle retail sales on track for 6.9% decrease year over year, though annual comparisons are skewed by EV tax credit pull-ahead in 2025
- Hybrid market share expected to increase 4.8 percentage points to 18.2%, representing 35.5% year-over-year growth
- Average monthly payments expected to rise 3.7% to an August record $812, while interest rates projected to drop 6 basis points to 6.55%, the lowest August level since 2022
The Total Sales Forecast
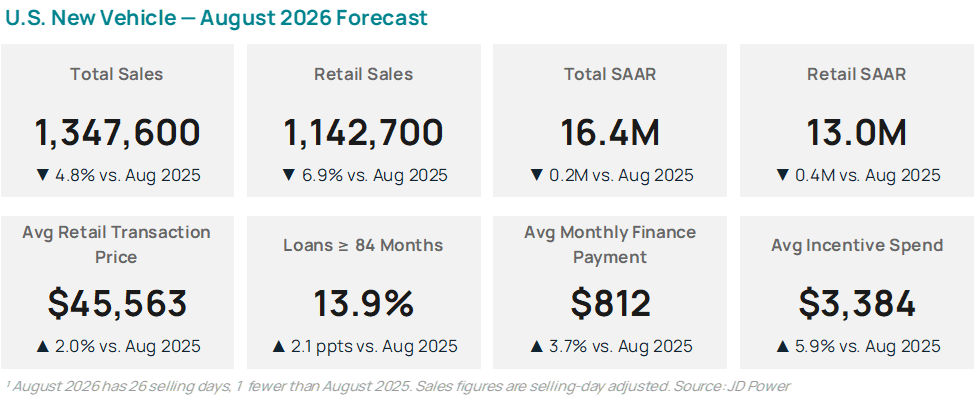
August 24, 2026 - Total new-vehicle sales for August 2026, including retail and non-retail transactions, are projected to reach 1,347,600, a 4.8% decrease year over year, according to a joint forecast from JD Power and GlobalData. Reporting the same numbers without adjusting for the number of selling days translates to a decrease of 8.4% from August 2025. The seasonally adjusted annualized rate (SAAR) for total new-vehicle sales is expected to be 16.4 million units, down 0.2 million units from 2025.
The Retail Sales Forecast
New-vehicle retail sales for August 2026 are projected to reach 1,142,700, a 6.9% decrease from August 2025. Reporting the same numbers without adjusting for the number of selling days translates to a decrease of 10.3% from 2025. The seasonally adjusted annualized rate (SAAR) for retail new-vehicle sales is expected to be 13.0 million units, down 0.4 million units from August 2025.
Thomas King, president of OEM solutions at JD Power:
“Vehicle sales in August are on pace to deliver solid results, with total sales expected to reach 16.4 million units on an annualized basis. However, comparison to August of last year presents a less positive picture, with total sales down 4.8%, and retail sales down 6.9% on a selling day adjusted basis.
“This apparent contradiction reflects technical and timing issues. August 2025 sales were inflated by the announcement that federal EV credits of up to $7,500 would expire on September 30, 2025, prompting many EV intenders to accelerate purchases into August that would otherwise have occurred later in the year. In addition, the Labor Day holiday, which is traditionally one of the biggest vehicles sales weekends of the year, fell into the August sales reporting month last year vs. September this year. Said differently, year-over-year volume comparisons are not especially useful for assessing the underlying health of new-vehicle demand this month.
“Putting aside last year’s results, August 2026 shows continued strong demand for new vehicles, despite concerns around fuel prices and economic uncertainty. In fact, August results would have been even stronger were it not for unusually low availability of hybrid vehicles this month. Furthermore, the strong demand is despite the elimination of Federal Electric Vehicle credits, which means that consumers interested in acquiring an EV face higher prices.
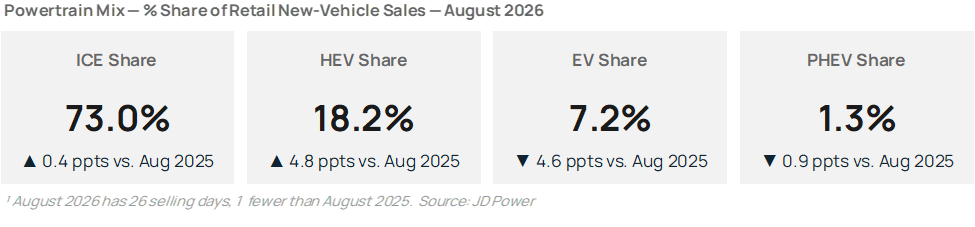
“While EV share has softened to 7.2% following the elimination of federal EV credits, the combination of elevated fuel prices and increased availability of vehicles with hybrid powertrains is driving a shift in the sales mix with hybrid share of retail sales expected to reach 18.2%, up 4.8 percentage points from last year, despite tight inventory on some of the best-selling hybrid models on the market.
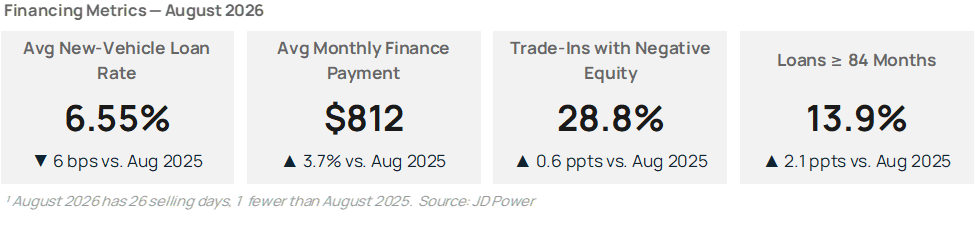
“Regarding affordability, the cost of financing a new vehicle keeps easing, though not by enough to offset the structural affordability pressures on buyers. The average interest rate on new-vehicle loans is expected to fall 0.06 percentage points to 6.55%, the lowest August reading since 2022. However, the average transaction price of a new vehicle has increased to $45,563, an increase of 2.0% from a year ago, while average monthly finance payments have climbed 3.7% to $812, the highest ever for the month of August. A key driver of the higher monthly payment, despite longer loan terms, is lower trade-in equity. Many of the buyers returning to showrooms today purchased when prices were at their peak several years ago when inventory was scarce. This is manifesting itself as more buyers carrying negative equity on their trade-in. 28.8% of trade-ins had negative equity in August, up 0.6 percentage points from a year ago.
“Subprime penetration remains elevated from last year, with the mix rising 2.0 percentage points from August 2025 to 10.8% this month, in part because many buyers with strong credit and the ability to accelerate their purchases did so last year. To manage monthly payments, consumers are using longer loan terms. 13.9% of loans now have terms of 84 months or longer, up 2.1 percentage points year over year, helping to partially bridge the affordability gap.
“Manufacturers are leaning harder into discounts to keep buyers in the market. Average incentive spending per vehicle is trending towards $3,384, a 5.9% increase from a year ago. Part of that jump reflects tariff-related dynamics a year ago, when several OEMs made unseasonal pullbacks in incentive spending to preemptively offset tariff costs. Incentives as a percentage of MSRP are expected to hit 6.6% in August, up 0.3 percentage points from August 2025.
“The divergence in manufacturer incentive strategies by powertrain continues to be evident in August. Incentive spending on traditional internal-combustion engine and hybrid vehicles is expected to increase $651 per unit year over year, up 26.2% to $3,140 in August 2026. Meanwhile, EV incentives moved in the opposite direction, with a forecasted decline of $2,297 per unit or 19.9% to $9,228, contributing to the 4.6 percentage point decline in EV share of new vehicle sales compared to last year.
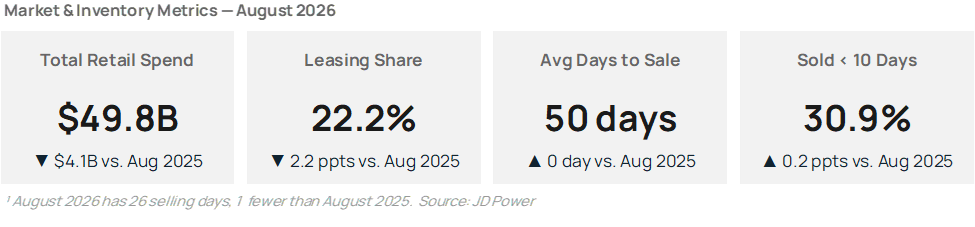
“Regarding the value of new vehicles being purchased, the decline in retail sales volume is outweighing the increase in transaction prices, meaning that total retail consumer expenditure is projected to fall 7.6% to $49.8 billion, a decrease of $4.1 billion from August 2025.”
Global Sales Outlook
David Oakley, manager, Americas vehicle sales forecasts at GlobalData:
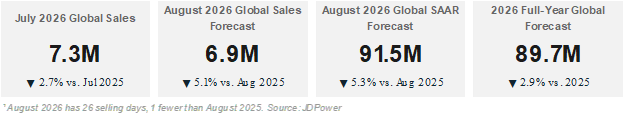
“July global light-vehicle sales are estimated to have declined 2.7% year over year to 7.3 million units. As has been the case for the past several months, the global decline in sales was driven by a large slump in China, with most other major markets showing flat to positive year-over-year results. The selling rate for July was estimated at 91.2 million units, up from 90.2 million units in June.
“The Chinese market saw a 24% year-over-year decrease in sales in July, excluding any vehicles intended for export. Chinese domestic demand has struggled throughout 2026 to date, due to the withdrawal of some government subsidies and tax exemptions, while the authorities are also trying to prevent a “race to the bottom” price war by banning automakers from selling vehicles below the cost of production. Elsewhere, India remained a standout performer in July, with sales estimated to have increased by 33.8% year over year. Sales were boosted by tax reductions, improving financing conditions, and the launching of new products, among other factors. Other key regions such as Western Europe and North America delivered relatively flat year-over-year results.
“August sales are expected to decline 5.1% from August 2025 to 6.9 million units. This would translate to a selling rate of 91.5 million units, down by 5.3% year over year. Similar dynamics observed in recent months are expected to continue in August, with Chinese sales dragging on global volumes, while growth in markets such as India and Japan is only likely to be able to partially offset China’s losses.
“Our forecast for total global sales in 2026 has been revised down marginally since last month, but still rounds to 89.7 million units. This forecast would represent a 2.9% year-over-year decline, with China’s falling sales, combined with geopolitical instability in the Middle East, being major contributing factors to the decrease.”
About JD Power
JD Power is a proven leader in business-critical data and intelligence to drive auto-related decisions with confidence and clarity. By leveraging unmatched proprietary data, advanced analytics and deep industry expertise, JD Power fuels original equipment manufacturers, retailers, lenders, insurers and partners to enhance their performance.
Since 1968, JD Power has delivered incisive guidance and intelligence about customer interactions with brands and products. To learn more about the company’s business offerings, visit JDPower.com.
About GlobalData: https://www.globaldata.com/
Source: JD Power
