


February 4, 2017 - Super Bowl 51 will be played Feb. 5, 2017 at NRG Stadium in Houston, Texas. The first Super Bowl was played on Jan. 15, 1967, at Los Angeles Memorial Coliseum, with the Green Bay Packers beating the Kansas City Chiefs 35-10. This will be the third time the NFL’s championship game will be held in Houston. In the last one, the New England Patriots beat the Carolina Panthers 32-29 in 2004.
The U.S. Census Bureau has compiled a collection of demographic and economic statistics examining the host metropolitan area, as well as the metro areas represented by the two participating teams — the Atlanta Falcons and the New England Patriots.
Atlanta
463,878
The population of Atlanta, Ga., in 2015.Source:

9th
The ranking of the Atlanta metro area on the list of the nation’s most populous metropolitan areas in 2015. The estimated population of the Atlanta-Sandy Springs-Roswell, Ga., metro area on July 1, 2015, was 5,710,795. The Atlanta metro area gained 95,431 people from July 1, 2014, to July 1, 2015.Source:
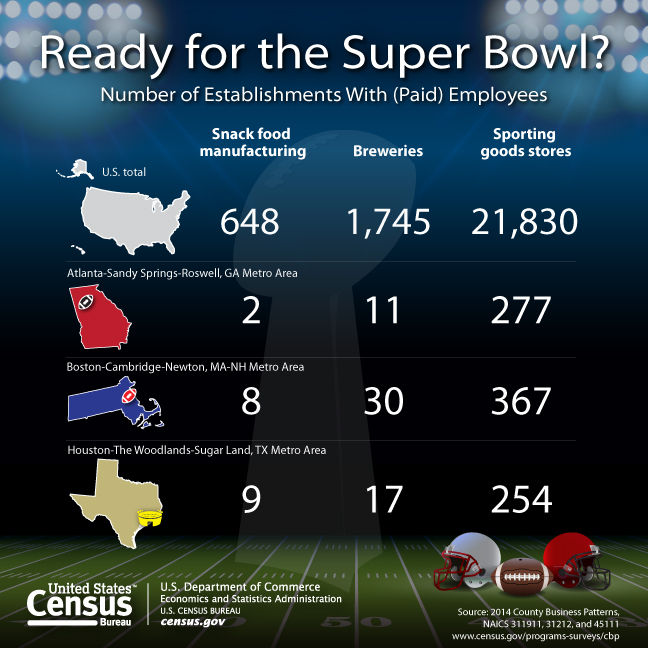
Number of Establishments With (Paid) Employees
37.0%
The percentage of Atlanta metro area residents age 25 and older who had a bachelor’s degree or higher in 2015; 88.7 percent had at least graduated from high school. The respective national figures were 30.6 percent and 87.1 percent.Source:
18.1%
The percentage of Atlanta metro area residents age 5 and older who spoke a language other than English at home in 2015. The national average was 21.5 percent.Source:
$60,219
The median household income for the Atlanta metro area in 2015. The national median was $55,775.Source:
$186,300
The median home value of owner-occupied homes in the Atlanta metro area in 2015. The national median was $194,500.Source:
31.3 minutes
The average amount of time it took Atlanta metro area residents to get to work in 2015; 77.9 percent of the metro area’s workers drove to work alone, 9.6 percent carpooled and 3.1 percent took public transportation. Nationally, it took an average of 26.4 minutes to get to work.Source:
2
The number of snack food manufacturing establishments in the Atlanta metro area in 2014. In addition, there were 11 breweries and 277 sporting goods stores in the Atlanta metro area.Source:
New England
667,137
The population of Boston, Mass., in 2015.Source:
10th
The ranking for Boston on the list of the nation’s most populous metropolitan areas in 2015. The estimated population of the Boston-Cambridge-Newton, Mass.-N.H., metro area on July 1, 2015, was 4,774,321. The Boston metro area gained 34,936 people from July 1, 2014, to July 1, 2015.Source:
46.0%
The percentage of Boston metro area residents age 25 and older who had a bachelor’s degree or higher in 2015; 91.4 percent had at least graduated from high school. The respective national figures were 30.6 percent and 87.1 percent.Source:
24.3%
The percentage of Boston metro area residents age 5 and older who spoke a language other than English at home in 2015. The national average was 21.5 percent.Source:
$78,800
The median household income for the Boston metro area in 2015. The national median was $55,775.Source:
$393,000
The median home value of owner-occupied homes in the Boston metro area in 2015. The national median was $194,500.Source:
31.4 minutes
The average amount of time it took Boston metro area residents to get to work in 2015; 66.8 percent of the metro area’s workers drove to work alone, 7.0 percent carpooled and 13.6 percent took public transportation. Nationally, it took an average of 26.4 minutes to get to work.Source:
8
The number of snack food manufacturing establishments in the Boston metro area in 2014. There were 30 breweries and 367 sporting goods stores in the Boston metro area.Source:
Host Site – Houston, Texas
2,296,224
The population of Houston, Texas, in 2015, the location of NRG Stadium where Super Bowl 51 will be played.Source:
5th
The ranking of the Houston metro area on the list of the nation’s most populous metro areas in 2015. The estimated population of the Houston-The Woodlands-Sugar Land, Texas, metro area on July 1, 2015, was 6,656,947. The Houston metro area gained 159,083 people from July 1, 2014, to July 1, 2015.Source:
31.5%
The percentage of Houston metro area residents age 25 and older who had a bachelor’s degree or higher in 2015; 82.3 percent had at least graduated from high school. The respective national figures were 30.6 percent and 87.1 percent.Source:
38.5%
The percentage of Houston metro area residents age 5 and older who spoke a language other than English at home in 2015. The national figure was 21.5 percent.$61,465
The median household income for the Houston metro area in 2015. The national median was $55,775.$168,300
The median home value of owner-occupied homes in the Houston metro area in 2015. The national median was $194,500.30.2 minutes
The average amount of time it took Houston metro area residents to get to work in 2015; 80.7 percent of the metro area’s workers drove to work alone, 10.1 percent carpooled and 2.2 percent took public transportation. Nationally, it took an average of 26.4 minutes to get to work.
