


California and National Drought Summary for March 10, 2020
Summary
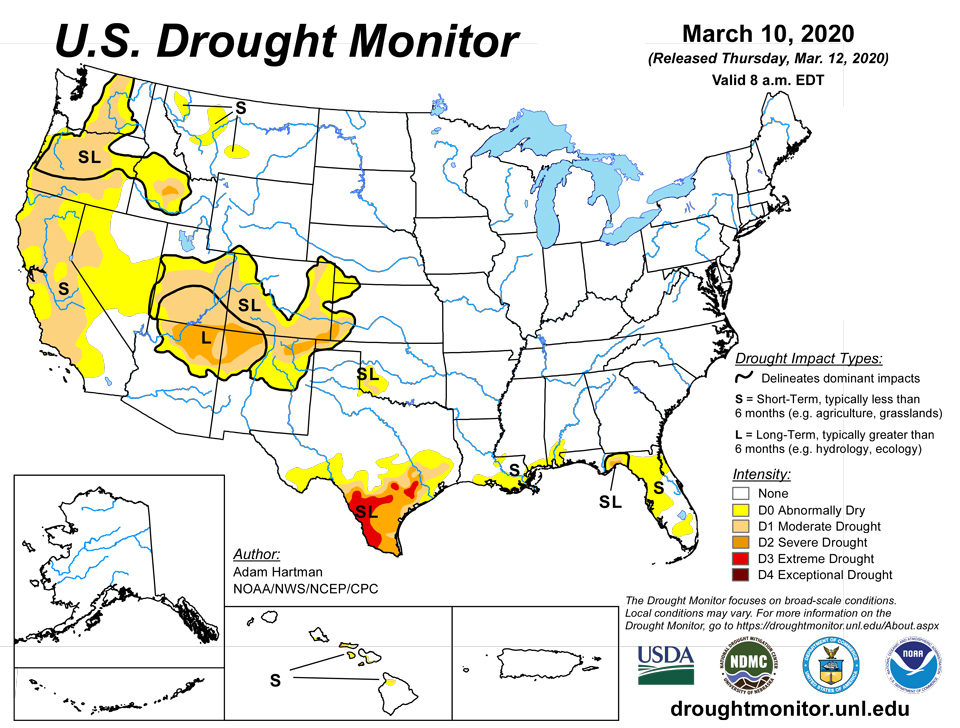
March 12, 2020 - A low pressure system propagated eastward across much of the southern tier states early in the period (March 4-6) and merged with a short-wave trough dropping southeastward from the Midwest before moving off the Mid-Atlantic coast on March 7. This system dropped more than 2 inches of rainfall over large areas from extreme southeastern New Mexico eastward to South Carolina. Some areas of central Alabama and Georgia saw more than 5 inches of rainfall, which fell over saturated soil. However, much of the heavier rainfall remained north of the I-10 corridor from southern Texas to northern Florida, while areas south of I-10 received only modest amounts, which were not nearly enough to reduce deficits. The Pacific Northwest and California also saw some precipitation over the past week, but amounts were not enough to reduce any deficits. Some recent dryness over southern Iowa and northern Missouri was mitigated a bit with near- to above-normal precipitation falling last week as well. Deficits increased in the Mid-Atlantic and New England over the past 30 days, but were kept at bay, as these areas saw 0.1 to 1 inch and 0.1 to 0.5 inches of rainfall, respectively. The active storm track continued last week for Alaska, with the southeastern Panhandle receiving 2 to 6 inches of precipitation over many areas. This precipitation, along with near- to below-normal temperatures, has finally produced above-normal snowpack in the Alaska Panhandle for the first time in 7 to 8 years, warranting D0 removal. Hawaii remained dry on the leeward slopes last week due to persistent trade winds, leading to some D0 expansion and development on the Big Island and Oahu, respectively. Puerto Rico saw D0 removal, as northern portions of the island saw much above-normal precipitation, eliminating short-term deficits.
Northeast
New England and parts of Maine have seen drier-than-normal conditions since the start of 2020, with several areas seeing 2 to 4 inch deficits, and localized pockets of 4 to 6 inch shortages. However, February brought above-normal precipitation to much of the Northeast, reducing deficits in some of the dry areas. The past 7 days brought near-normal precipitation to much of the region, although New England and coastal Maine received slightly less than surrounding areas (0.1 to 0.25 inches, compared to 0.25 to 1 inch in surrounding areas). In addition, 7-day average USGS stream flows saw reductions, compared to 14-day average flows, which was enhanced by below-normal snowpack. Although D0 is not warranted at this time, New England and coastal areas of Maine will need to be closely monitored in the coming weeks if the dryness continues.
Southeast
A large swath of more than 2 inches of rain fell across central Alabama and most of Georgia and South Carolina as a mid-level low pressure system propagated eastward across the southern tier states early in the period. Parts of central Alabama and Georgia saw more than 5 inches of rainfall. Unfortunately, the sharp north-south precipitation gradient along the I-10 corridor was reinforced, as much of the precipitation fell to the north over saturated areas. Locations south of the I-10 corridor, near and along the Gulf Coast, only received a trace to 0.25 inches, which is well below what is needed to overcome deficits (60- and 90-day deficits of around 5 inches and 6-month deficits over 10 inches in some locations). The Florida Peninsula saw little to no precipitation over the past week. D0 was added in southern Florida due to seeing 1 to 2 inch deficits over the past 30 days and slightly below-normal rainfall at 60 and 90 days, along with below-normal stream flows downstream from the area. Much of Virginia has also seen some dryness over the past 30 days, as 1 to 2 inch rainfall deficits have developed, and 7-day average USGS stream flows were below normal (10th to 24th percentile with some gauges reporting flows in the 10th percentile), particularly in the Tidewater area. Parts of the Tidewater saw some temporary relief, as 0.5 to 1 inch of rainfall fell March 6-7, in association with the low pressure system that moved northeastward off the Mid-Atlantic coast. In addition, soil moisture conditions were near to slightly below normal for the region. The status quo remained for Virginia this week, but this area bears watching in the coming weeks if the dryness continues.
South
D0 was expanded northward from the Gulf Coast of Louisiana, Mississippi, and Alabama. Many of these areas have 6-month deficits of over 8 inches; 6-month deficits over 12 inches in southeastern LA (i.e. 50 to 75 percent of normal). Rainfall over the past 30 days has been particularly low, with precipitation falling to 25 to 50 percent of normal, with some locations in the new D1 area seeing 10 to 25 percent of normal. Some expansion of D1 was made northeast of Corpus Christi, Texas, and D2 toward the coast, as USGS stream flows were well below normal at many locations and soil moisture has diminished further in recent weeks. Meanwhile, many areas in western and northern Texas (north of the I-10 corridor) saw anywhere from 0.5 to 3 inches (in isolated locations). The heavier rainfall extended southward into the upper Rio Grande Valley where many areas saw 0.25 to 1 inch of rainfall, warranted some reduction in D0, D1, and D2 areas along the river. It is status quo elsewhere for the Southern Region, including southwestern Oklahoma, whose 7-day totals (0.25 to 1 inch) were not enough to cut into rainfall deficits.
Midwest
Southern Iowa and northern Missouri have seen drier-than-normal conditions over the past 30 days. However, this has been welcomed dryness as long-term surpluses are widespread across the Midwest. There were a few reports of good soil conditions and some isolated field work in southwestern Iowa. In addition, sub-soil conditions continued to be wetter than normal for much of the Midwest Region and USGS average stream flows were near and above normal for the entirety of the region. As such, no D0 development was required.
High Plains
D1 was expanded a bit in northeastern Colorado (i.e. existing D1 areas were connected). This area has continued to experience warmer-than-average temperatures in recent weeks, which has had adverse effects on winter wheat and rangelands prior to green-up. In addition to SPIs showing D1 (and worse over longer periods at a couple locations), USGS stream flows in surrounding locations were showing flows below the 10th percentile. Some drier-than-normal conditions crept into eastern portions of the Dakotas over the past 30 days (25 to 50 percent of normal precipitation, with some small areas of 10 to 25 percent of normal in extreme eastern South Dakota). However, 60- and 90-day precipitation was near and above normal, respectively, for these areas. Therefore, it was status quo for the rest of the High Plains Region.
West
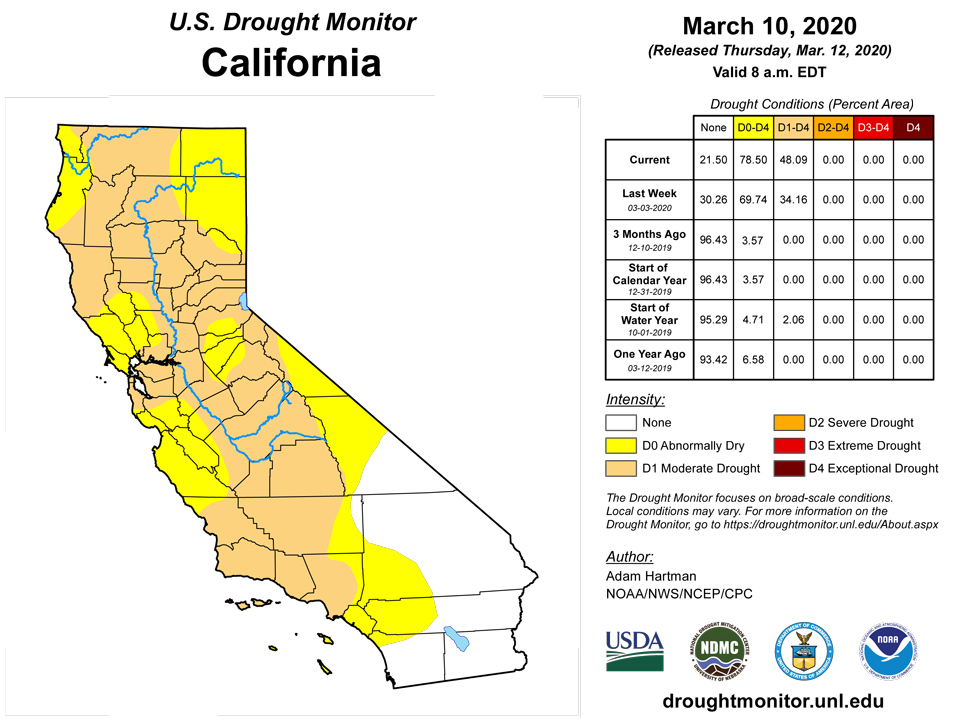
D0 was expanded to the coast in Monterey County, California, with 5 to 10 inch year-to-date (YTD) deficits over much of the county (greater than 10 inch deficits on some of the windward slopes). D0 was also expanded eastward and southeastward from Los Angeles County in favor of those areas receiving 10 to 25 percent of YTD precipitation with some locations seeing 25 to 50 percent of normal water-year-to-date (WYTD) precipitation. However, this area was not extended further southward as most of San Diego County has seen near-normal precipitation going back 6 months, and near-normal rainfall over the past week. D1 was expanded to connect the areas in California and Nevada (near Reno, Nevada). March 10 snow water content (SWC) was still below normal, and YTD precipitation was 5 to 10 percent of normal within the expanded area. D1 was also expanded southward into San Luis Obispo, Santa Barbara, Ventura, and Los Angeles Counties in California, with several locations seeing the January-February period falling within the top 5 driest on record. This has already had large impacts to natural vegetation needed for feeding livestock, as many ranchers have resorted to supplemental feeding. Similar reports have come from northern California (Siskiyou County), over the past couple of weeks, along with unregulated streams running dry, hence the D1 expansion there as well.
Elsewhere in the Western Region, D0 was reduced in southeastern New Mexico and D1 was removed in eastern New Mexico due to last week’s rainfall. In addition, many of these areas are seeing greater than 150 percent of normal YTD precipitation and near-normal (former D0 and D1 areas) and above-normal (former D0 area) WYTD precipitation. D0 was also expanded in eastern Nevada (northeast White Pine County). 6-month precipitation is 25 to 50 percent of normal, which has become worse over the past 30 days (areas of 2 to 5 percent of normal), supporting ground reports of abnormal dryness. D1 was expanded eastward in central and northern Washington. Although the past 60 to 90 days have seen near-normal precipitation for these areas, 6-month deficits show precipitation at 25 to 50 percent of normal and little to no precipitation has fallen in the past 30 days, which has contributed to some below-normal snowpack over eastern portions of the state. D1 was also expanded westward in northwest Oregon (northern Willamette Valley) and eastward in southeastern Oregon in favor of WYTD deficits of over 13 inches and below-normal SWC. In addition, 7-day USGS stream flows continued to be below the 10th percentile last week. Additional D1 expansion was made in southeastern Oregon due to 25 to 50 percent of normal YTD and WYTD precipitation.
Alaska, Hawaii, and Puerto Rico
Much of the Alaska received normal or above-normal precipitation during the month of February. The big winners for the month were Southeast Alaska, Southwest Alaska, and the Matanuska and Susitna Basins, where many sites received over 150 percent of normal monthly precipitation. Most of Alaska made greater-than-average snowpack gains during February also. In locations in southeast Alaska, south-central, and parts of the Tanana basin, these gains were 2 to 4 times the average monthly gains. The Southeast Panhandle saw some of the greatest gains this month and the above-normal snowpacks there are more robust than they have been since 2012 or 2013. Snowpack in Southeast Alaska made extraordinary gains during February with most sites logging the 2nd to 4th highest February gains in their histories. Gains were 200 to 600 percent of average. While the current snowpacks are not record-breaking, most locations have their deepest or wettest snowpacks recorded since 2012 or 2013. The 7 snow sites measured in Southeast Panhandle averaged 137 percent of normal.
The easterly trade winds have persisted over the past 7 days over Hawaii, leading to a lack of precipitation in many of the leeward areas of the islands. With several locations seeing less than 50 percent of normal precipitation over the past couple of weeks, which corresponded with drier areas seen in the NDVI, a small area of D0 was added in Oahu, and D0 was expanded southwestward on the Big Island.
Puerto Rico has seen 2 to 5 inches of precipitation fall over the D0 area in the northwest over the past week, erasing deficits there, while all other areas of the island received near- to much above-normal precipitation. As such, D0 was completely removed from the island.
Pacific Islands
During the Northern Hemisphere winter, the North Pacific subtropical high and the low latitude Inter-Tropical Convergence Zone (ITCZ) migrate south toward the equator. The seasonal migration brings drier subtropical trade winds to the northern portions of Micronesia and ITCZ rainfall to the southern regions. The weather conditions across the U.S.-Affiliated Pacific Islands (USAPI) during this USDM week (3/4/20-3/10/20) reflected this pattern, as the trade winds spread a very dry air mass across most of Micronesia. Localized troughs or trade-wind convergence developed across southern parts of Palau and the Federated States of Micronesia (FSM) and across the Marshall Islands (RMI), and a weak circulation or tropical disturbances made short-lived appearances in these areas, but dry weather was generally the rule. At Guam, the KBDI (Keetch-Byram Drought Index) soared past 600 into the high category as vegetation continued to dry, with the lack of wind the only thing preventing the issuance of a Fire Weather Watch. For the Marianas, Yap, and the RMI, March is normally the driest month of the year. South of the equator, a trough moved across the Samoan Islands early in the week, followed by a ridge with a drier air mass.
Satellite-based estimates of 7-day precipitation (QPE) showed areas of 2-4 inches of rain west of Koror, over southeast Yap State to southwest Chuuk State, and southeast of the RMI, with little to no rain registering across most of the rest of Micronesia. The QPE showed bands of 2+ inches of rain surrounding American Samoa, with less than an inch indicated just to the east of the islands.
This week on American Samoa, 1.73 inches of rain fell at Pago Pago, and over 2 inches of rain fell at Suifaga Ridge and Toga Ridge. Therefore, drought-free conditions continued there this week.
Only 0.14 inches of rain fell this week on Yap, which was less than half of their weekly minimum rainfall; thus, short-term moderate drought continued for another week. Short-term abnormal dryness continued this week on Ulithi, where a paltry 0.08 inches of rain fell this week. Rainfall on Woleai was also low this week, with only 0.36 inches being reported; thus, short-term moderate drought continued. No data were reported for Fananu, so no Drought Monitor analysis was done there. Short-term abnormal dryness continued this week on Chuuk, where minimal rain fell this week. On Lukunor, only 1.08 inches of rain fell this week, and short-term moderate drought continued. Nukuoro received 1.42 inches of rain, and short-term abnormal dryness continued there. Only 0.20 inches of rain fell this week on Kapingamarangi, and short-term abnormal dryness continued there. Conditions on Pohnpei, Pingelap, and Kosrae were free of drought or abnormal dryness this week, though only 0.48 and 0.96 inches of rain fell on Pohnpei and Kosrae, and Pingelap received no rain.
Conditions this week degraded from moderate to severe short-term drought on Saipan, where only 0.02 inches of rain fell this week, following three straight months when precipitation was below half of monthly minimums. Short-term abnormal dryness continued on Rota, where a paltry 0.06 inches of rain fell. Conditions also degraded on Guam, where short-term moderate drought developed after no rain fell this week.
Dry conditions continued this week in the Republic of the Marshall Islands. Only 0.33 inches of rain fell this week on Kwajalein, where short-term abnormal dryness continued. On Ailinglapalap, 0.93 inches of rain fell, and short-term abnormal dryness also continued there. Short-term abnormal dryness continued on Jaluit, where 1.09 inches of rain fell this week. On Utirik, 0.54 inches of rain fell (with one day of data missing), and severe short-term drought continued there. Severe short-term moderate drought also continued on Wotje, where no rain fell this week. On Majuro and Mili, where 0.38 inches and 1.02 inches, respectively, fell this week, short-term abnormal dryness continued.
Palau received 1.40 inches of rain this week, so short-term abnormal dryness continued there for another week.
Virgin Islands
Long-term moderate drought continued on St. Croix, where precipitation deficits at 6-12 month time scales were still entrenched. Conditions on St. Thomas and St. John were free of abnormal dryness or drought, as short-term precipitation was above normal in these locations.
Looking Ahead
During the next 5 days (March 12-16), low pressure will be moving into southern California and the Southwest. This will help to deepen troughing over the western CONUS allowing for a southern stream of moisture to develop, enhancing chances for precipitation over California, the Southwest, southern Great Plains, and the Ohio River Valley. Below-normal temperatures (5°F to 10°F) are also expected for much of the West Coast and northern Rockies. Meanwhile, the Gulf Coast is likely to see temperatures 5°F to 10°F above normal, south of a lingering frontal boundary.
The 6-10 day (March 17-21) extended range forecast favors an amplified 500-hPa height pattern with Pacific ridging building northward into Alaska, leading to above-normal temperatures and precipitation over much of Mainland Alaska, with near- and below- normal precipitation along the southern coast and southeastern Panhandle. Troughing is favored over much of the western CONUS, enhancing probabilities for below-normal temperatures and above-normal precipitation in central and southern California and the southern Rockies, which would be welcome for areas with below-normal snowpack. Above-normal precipitation is favored for the eastern two-thirds of the CONUS, as the pattern is favorable for lee-side cyclogenesis east of the Rockies. Weakly above-normal chances for precipitation are favored along the Gulf Coast east of Texas, with below-normal probabilities favored over the drier areas of the Florida Peninsula. The odds favor above-normal temperatures in the eastern half of the lower 48 states.
Author(s):
Adam Hartman, NOAA/NWS/NCEP/CPC
Curtis Riganti, National Drought Mitigation Center
Dryness Categories
D0 Abnormally Dry—used for areas showing dryness but not yet in drought, or for areas recovering from drought.
Drought Intensity Categories
D1 Moderate Drought
D2 Severe Drought
D3 Extreme Drought
D4 Exceptional Drought
Drought or Dryness Types
S Short-Term, typically less than 6 months (e.g. agricultural, grasslands)
L Long-Term, typically greater than 6 months (e.g. hydrologic, ecologic)
Source: National Drought Mitigation Center

