


California and National Drought Summary for March 24, 2020
Summary
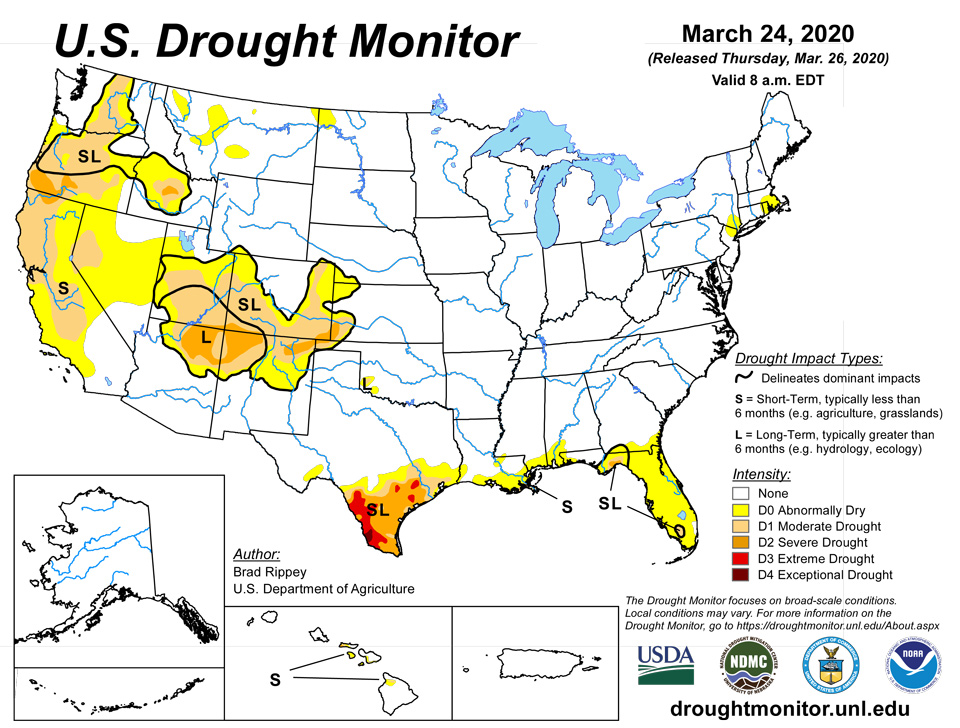
March 26, 2020 - Storms delivered much-needed precipitation to California’s key watershed areas before soaking an area from the southeastern Plains into the Ohio and Tennessee Valleys with as much as 2 to 4 inches of rain. Some of the rain overlapped existing drought areas in southern Texas, providing substantial relief. Widespread precipitation also fell across the remainder of the West, except in the northern Rockies. Significant precipitation was also noted in Iowa and environs, while wind-driven snow blanketed parts of northeastern Colorado and western Nebraska. In contrast, warm, dry weather dominated the lower Southeast, including Florida, boosting irrigation demands and further reducing topsoil moisture. Weekly temperatures averaged more than 10°F above normal in many areas from the central Gulf Coast into the Southeast, contributing to further introduction or intensification of abnormal dryness (D0) and moderate to severe drought (D1 to D2).
Northeast
The newly added area of abnormal dryness (D0), stretching from the Delaware River Valley to southern New England, received two rounds of heavy precipitation. From March 19-24, precipitation totaled at least 2 inches in many locations within last week’s D0 area, including Providence, Rhode Island (2.67 inches); Newark, New Jersey (2.25 inches); and Bridgeport, Connecticut (2.19 inches). As a result, the D0 area was significantly reduced in size and split into two pieces. Despite the recent precipitation much of the Northeast remains in a “snow drought,” with season-to-date totals through March 24 including 15.1 inches (37% of normal) in Boston; 11.8 inches (36%) in Providence; and 4.8 inches (19%) in New York’s Central Park.
Southeast
The Southeast remains a tale of two landscapes: wet to the north in recent weeks, except in some locations across the coastal plain and along the Atlantic Coast, but dry along the Gulf Coast and in Florida. The dryness extends back several months in parts of Florida, where moderate to severe drought (D1 to D2) was introduced or expanded. The new D1 area, highlighted by dry soils, low streamflow, and increasing fire danger, encompasses part of interior southern Florida, south of Lake Okeechobee. During the first 24 days of March, no measurable rain fell in many Florida locations, including Tampa, Lakeland, and Sarasota-Bradenton. Those values are 2 to 3 inches below normal—and have been accompanied by temperatures averaging 4 to 6°F above normal. March 1-24 rainfall totaled just 0.02 inch in Orlando, Fort Myers, and Daytona Beach, Florida. According to the U.S. Department of Agriculture, topsoil moisture in Florida was 51% very short to short on March 22, up from 38% a week earlier.
South
Heavy rain across interior southern Texas provided significant drought relief. According to the U.S. Department of Agriculture, statewide topsoil moisture rated very short to short stood at 19% in Texas on March 22, down from 40% the previous week. On the same date, 49% of the winter wheat in Texas was rated in good to excellent condition. In southern Texas, a small patch of exceptional drought (D4) persisted along and near the Rio Grande, but rain resulted in a general reduction in coverage of moderate to extreme drought (D1 to D3) in many other areas. Cotulla, Texas, in La Salle County, received 2.98 inches of rain from March 18-22. Closer to the Gulf Coast, however, March 1-24 totals included 0.22 inch in Corpus Christi and 0.01 inch in Rockport. Farther north near the coast, there was some expansion of moderate to severe drought (D1 to D2) in southeastern Texas. Meanwhile, there was no change in the drought depiction across Oklahoma’s panhandle, but the small area of abnormal dryness (D0) and moderate drought (D1) in southwestern Oklahoma was split into two pieces and reduced in size and intensity. Elsewhere, dryness persisted along and near the central Gulf Coast. D1 persisted across southeastern Louisiana, while D0 was slightly expanded.
Midwest
The Midwest has been completely free of drought early-November 2019 and has experienced no dryness (D0) since January 7, 2020. It was a wet week across the region, with rain changing to snow in Iowa and portions of neighboring states. In Sioux City, Iowa, March 19-20 featured precipitation totaling 1.60 inches and 3.8 inches of snow. Meanwhile, heavy rain fell from Missouri into the Ohio Valley.
High Plains
Dryness (D0) and moderate to severe drought (D1 to D2) remains mostly confined to the southwestern part of the region, although a spot of D0 was introduced in northwestern North Dakota. On March 19, a spring storm delivered wind-driven snow to parts of northeastern Colorado and western Nebraska. Denver, Colorado, reported 6.0 inches of snow on that date, along with a peak northerly wind gust to 49 mph. Some snow fell in the region’s mountainous areas, but there was little overall change in the drought depiction, except for some removal of moderate drought (D1) in northwestern Colorado.
West
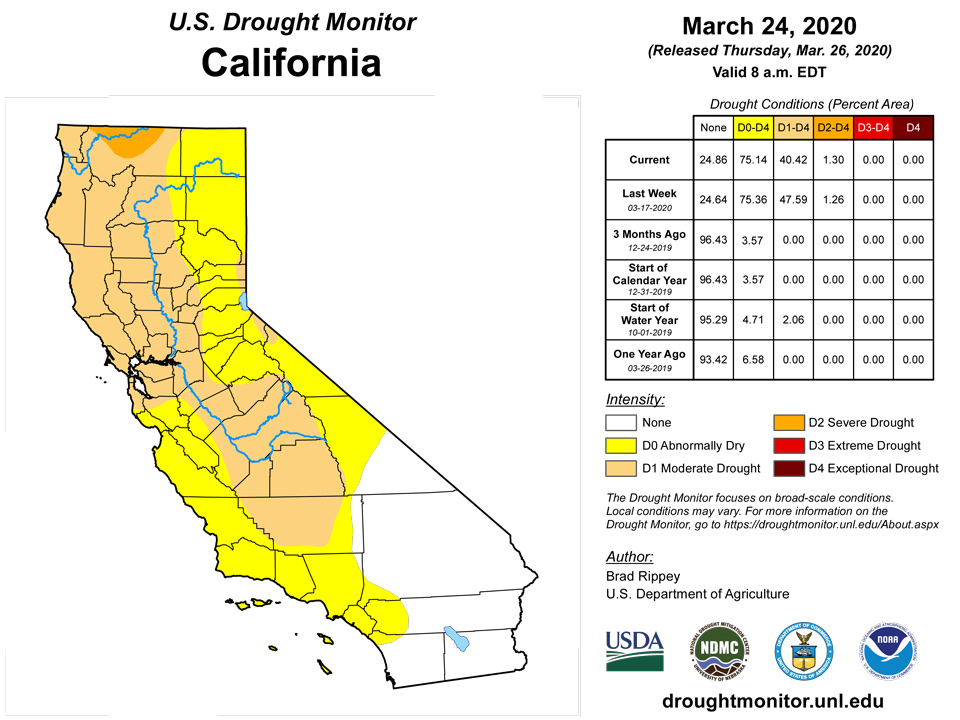
It was an active drought-monitoring period in the West, although northern sections of the region received little or no precipitation. During the 10-day period ending March 24, the average water equivalency of the Sierra Nevada snowpack rose from 10 to 14 inches, according to the California Department of Water Resources, representing an improvement from just over one-third of the mid-March normal to about one-half of the late-March normal. Meanwhile, several rounds of heavy precipitation also struck southern California and the Desert Southwest, resulting in modest reductions in drought severity. While the late-season precipitation has reduced irrigation demands and has provided a nice boost in soil moisture and snowpack, the moisture is generally too late for drought-stressed rangeland that has already lost forage yield potential due to winter drought. Farther north, drought slightly expanded in northwestern California and western Oregon, as below-normal seasonal precipitation was reflected by dry soils, sub-par snowpack, and unusually low streamflow. Patches of dryness and drought also stretched from the eastern slopes of the Cascades onto the northern High Plains.
Alaska, Hawaii, and Puerto Rico
Neither dryness nor drought exists in Alaska and Puerto Rico. Meanwhile in Hawaii, extremely heavy rain fell on Kauai from March 16-18. During that 3-day period, rainfall totaled 8.46 inches in Lihue, Kauai. Elsewhere on Kauai, 72-hour rainfall amounts (ending at daybreak on March 18) reached 29.05 inches on famously wet Mount Waialeale; 14.27 inches in Hanalei; and 11.77 inches in Wailua. Much of Mount Waialeale’s total—22.10 inches—fell in a 24-hour period on March 16-17. Elsewhere, March 16-18 rainfall totaled 3.03 inches in Honolulu, Oahu, and 4.91 inches in Hilo, on the Big Island. In Hawaiian areas affected by dryness (D0) and moderate to severe drought (D1 to D2)—encompassing just over one-tenth of the state but limited to parts of Maui and Hawaii Counties—assessments continue to determine how much of a positive impact the mid-March rainfall is having on streamflow and pasture conditions.
Pacific Islands
Synoptic Summary:
The weather conditions across the U.S.-Affiliated Pacific Islands (USAPI) during this USDM week (3/18/20-3/24/20) consisted of a dry trade-wind regime across northern portions of Micronesia and convection associated with the Inter-Tropical Convergence Zone (ITCZ) in southern portions. The dry trade-wind regime is associated with the North Pacific Subtropical High which normally shifts southward during this time of year, with the ITCZ normally also shifting more toward the equator. The ITCZ took the form of a near-equatorial surface trough across southern portions of central to western Micronesia and trade-wind convergence across southern portions of central to eastern Micronesia. A weak circulation enhanced precipitation within the near-equatorial trough as it slowly moved from southwest Chuuk State, across southern Yap State, to Palau. South of the equator, a high pressure ridge axis kept dry weather across the Samoan Islands for much of the week, while a surface trough to the southwest moved closer to American Samoa as the week progressed.
Satellite-based estimates of 7-day precipitation (QPE) showed a large band of 2+ inches of rain across southern Micronesia, with a band of 4+ inches stretching from Palau across the Federated States of Micronesia (FSM). Areas of 8+ inches were indicated over parts of Yap and Chuuk States. Little to no precipitation was detected by this product over the Marianas and northern Marshall Islands (RMI). The satellite QPE showed areas of 2+ inches of rain south of the Samoan Islands, with a tongue of 0.5-1.0 inch reaching over American Samoa.
Palau:
In the Republic of Palau, the last 3 weeks have been dry (less than the 2-inch weekly minimum needed to meet most water needs) at Koror, with 1.97 inches recorded this week (just barely below the weekly minimum) and 3.47 inches of rain so far this month. Based on data through March 24, this month ranks as the 9th driest March for Koror. D0-S continued for Palau.
Marianas:
Dry conditions continued in the Marianas, with rainfall totals well under the weekly minimum (1 inch). A tenth of an inch or less was recorded at Saipan (0.10 inch in the manual gauge), the Guam airport (0.09), the Rota airport (0.08), Tinian (0.04), and the automated stations at Saipan (0.04 at the NPS station and at the airport ASOS station). Tinian reported 0.17 inch. Based on data through March 24, with 0.55 inch of rainfall, this month ranks as the driest March in the 1957-2020 record at Guam, with March 1965 recording 0.59 inch. The KBDI (Keetch-Byram Drought Index) at Guam was well past 700, indicating an extreme fire risk. With 0.55 inch of rain so far (through March 23), this month ranked as the 3rd driest March on record at Saipan (manual gauge). D2-S continued on Saipan and D1-S continued on Guam and Rota.
Federated States of Micronesia:
In the FSM, Fananu has been missing for several months, so this station could not be analyzed. Some stations in Yap and Chuuk States, especially the southern areas, had a wet week (more than the 2-inch weekly minimum), while the rest of the stations were dry (less than 2 inches). Twelve (12.02) inches of rain fell at Nukuoro this week, filling catchments and prompting the USDM status to improve from D1-S to D0-S. The D0-S reflects lingering agricultural impacts from the recent severe dryness. Over 6 inches (6.16) was reported at Kapingamarangi, bringing the March total to 12.62 inches and continuing the D-Nothing status. Woleai was the other wet station this week, recording 2.24 inches, but with the monthly total (5.16 inches) still below monthly minimums, D1-S continued. Even with a wet week, this March ranked as the 13th driest March at Woleai (based on data through the 24th), and the last 3 months ranked as the 5th driest January-March.
A tenth to a quarter inch of precipitation was observed at stations in the Yap archipelago, including the Yap Weather Service Office (0.11 inch), Rumung (0.10), and North Fanif (0.16), so D2-S continued for Yap. Pingelap reported a tenth of an inch (0.10) for the week and 3.80 inches for the month, which ranks as the third driest March so far. Nearby Mwoakilloa recorded 0.63 inch for the week and only 2.35 inches for the month. Chuuk had 0.63 inch of rain this week. D0-S continued for Chuuk and Pingelap. Lukonor recorded 0.42 inch for the week and 5.27 inches for the month so far. But January-March (so far) ranked as the third driest, so D1-S continued at Lukonor. D1-S continued for Ulithi, where 0.62 inch was reported this week and March (so far) ranked as the third driest. This week was dry at Kosrae (1.85 inches) and Pohnpei (1.78 inches), but previous weeks and months were wet, so D-Nothing continued.
Marshall Islands:
In the RMI, Kwajalein had no missing data for the week, Ailinglapalap, Mili, and Wotje were missing one day, and Majuro, Jaluit, and Utirik were missing 2 days. Based on data received so far, it was a wet week at Mili with 2.26 inches of rain. But the rest of the stations recorded far less than the weekly minimum needed to meet most water needs (which is 2 inches). Weekly rainfall amounts ranged from zero at Utirik and Wotje to 0.91 inch at Jaluit. The USDM status at Mili was improved this week to D-Nothing from the D0-S of last week due to 2.26 inches of rain this week, 2.92 inches last week, 3.58 inches 2 weeks before that, and 6.86 inches so far in March. Otherwise, the status at the rest of the stations was the same as last week, with D0-S continuing at Ailinglapalap, Majuro, and Jaluit; D1-S continuing at Kwajalein; D2-S at Utirik; and D3-S at Wotje. There were reports of water shortages on Ebeye Island in the Kwajalein atoll, and the Majuro reservoir stood at 27.342 million gallons on March 23, which is 76% of maximum and below the level of concern for drought. Wotje has recorded no measurable rain this month; only two other Marches have had zero inches – 1990 and 1994.
American Samoa:
In American Samoa, Pago Pago (1.18 inches) and the automated station at Toa Ridge (2.04 inches) recorded more than the weekly minimum rainfall of 1 inch, while half an inch was measured at the automated station at Siufaga Ridge (0.54). With February very wet, March already meeting the 4-inch monthly minimum for most water needs, and February-March (through March 24) ranking as the 6th wettest February-March on record, D-Nothing continued at Tutuila.
Virgin Islands
Synoptic Summary:
The weather pattern across the USVI during this USDM week (3/18/20-3/24/20) consisted of moisture fed into the islands by a surface trough, and by a northeasterly trade-wind flow which was created by surface high pressure over the western Atlantic. During the last half of the week, mid- to upper-level troughs, and a TUTT (Tropical Upper Tropospheric Trough) to the northwest, created instability which enhanced showers over the region.
St. Croix:
Heavy rains fell across St. Croix this week, with the UVI station reporting 4.42 inches, the Rohlsen Airport station recording 2.62 inches, the CoCoRaHS stations at Christiansted 1.8 ESE and Christiansted 4.1 ESE receiving 3.00 and 2.45 inches, respectively, and the station at East Hill measuring 2.14 inches. With 3.64 inches for the month so far, Rohlsen is 311% of normal. The steady decline of the Adventure 28 well observations of the last several weeks has been arrested, with the groundwater measurements leveling off this week. The Standardized Precipitation Index (SPI) values for the Rohlsen/Hamilton Airport and East Hill stations have improved, but they are still at drought (D1) or abnormally dry (D0) levels at the 6- to 12-month time scales. The St. Croix USDM status was improved to D0-L this week, with the improvement reflecting the abundant recent rain, and the D0-L reflecting the lingering long-term dryness.
St. Thomas:
On St. Thomas, the Cyril E King AP station reported 1.30 inches of rain for this week, with a month-to-date total of 2.51 inches which is 237% of normal. The year-to-date total is 7.46 inches with a departure of +2.59 inches or 153% of normal. The Anna's Retreat 2.5 ESE CoCoRaHS station reported 0.92 inch of rain for the week and 1.92 inches for the month. The St. Thomas USGS Grade School 3 well has been going up and down during the last 4 months, but has been rising the past 2 weeks, and is higher than a year ago. The SPI values for King were near normal to wet at all time scales The USDM status for St. Thomas continued at D-Nothing this week.
St. John:
On St. John, the station at Windswept Beach reported 0.94 inch of rain for the week (through March 23) with 2.33 inches for the month so far and 10.26 inches for the year (which is 159% of the long-term average). The St. John USGS Susannaberg DPW 3 well level has been steadily dropping since the end of January 2020, but is still above where it was at the end of 2019. The SPI values for Windswept Beach were near normal to wet at all time scales. The USDM status for St. John continued at D-Nothing on this week’s map.
Looking Ahead
In the West, showers will gradually diminish as the week progresses. By late Friday, a significant spring storm system will begin to intensify across the central Plains. The storm will move northeastward, reaching the northern Atlantic Coast on Monday. As a result, storm-total precipitation could reach 1 to 3 inches across large sections of the Midwest and Northeast. Accumulating snow may occur from the central High Plains (e.g. northeastern Colorado) into parts of the upper Great Lakes region, as well as northern New England. In contrast, mostly dry weather should prevail during the next 5 days across the southern High Plains and the southern Atlantic region, including Florida.
The NWS 6- to 10-day outlook for March 31 – April 4 calls for the likelihood of near- or below-normal temperatures in much of the eastern one-half of the U.S. and across the nation’s northern tier, except Maine. Warmer-than-normal weather can be expected in Maine, along with Florida, the Gulf Coast region, and an area stretching from California to the High Plains. Meanwhile, near- or below-normal precipitation across large sections of the country should contrast with wetter-than-normal conditions along the Canadian border from the northernmost Rockies into the upper Great Lakes region, and across the South from Texas to the southern Atlantic Coast.
Author(s):
Brad Rippey, U.S. Department of Agriculture
Richard Heim, NOAA/NCEI
Dryness Categories
D0 Abnormally Dry—used for areas showing dryness but not yet in drought, or for areas recovering from drought.
Drought Intensity Categories
D1 Moderate Drought
D2 Severe Drought
D3 Extreme Drought
D4 Exceptional Drought
Drought or Dryness Types
S Short-Term, typically less than 6 months (e.g. agricultural, grasslands)
L Long-Term, typically greater than 6 months (e.g. hydrologic, ecologic)
Source: National Drought Mitigation Center

