


California and National Drought Summary for March 31, 2020
Summary
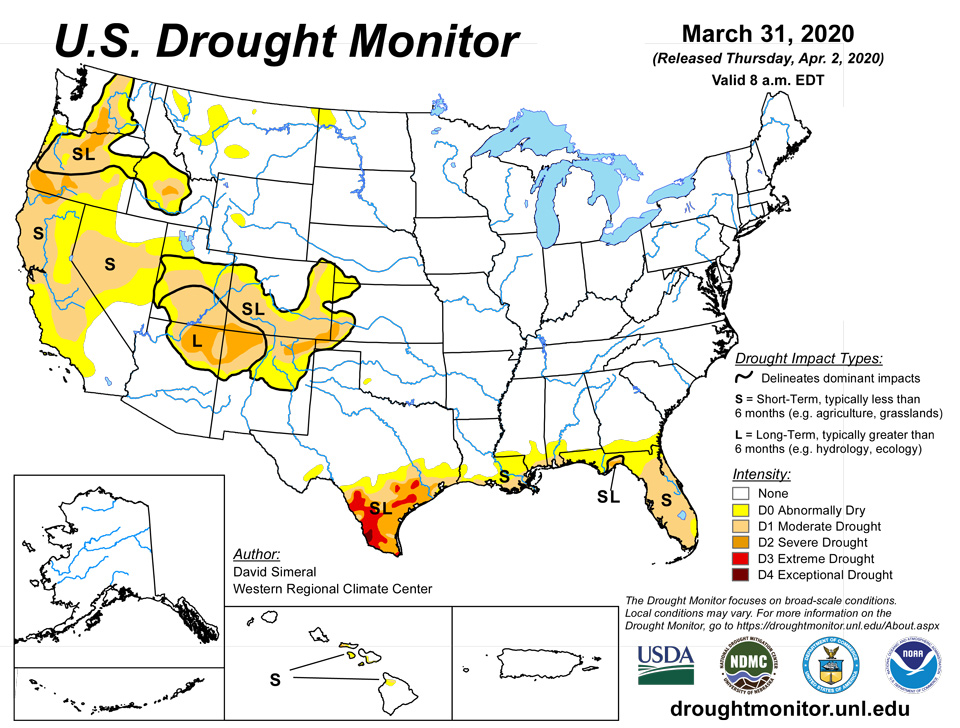
April 2, 2020 - This U.S. Drought Monitor week saw an active weather pattern impact various parts of the conterminous U.S.—including the western U.S. which continued to experience below-normal temperatures and snow showers in the mountain ranges of the Pacific Northwest (Olympics, Cascades), California (Northern Coast Ranges, Sierra Nevada), and parts of the Intermountain West (Wasatch, central and northern Rockies). In other parts of the Pacific Northwest, including central Oregon and Washington, drought intensified while improvement in drought-related conditions occurred in the Four Corners of northeastern Arizona. Elsewhere, an outbreak of severe weather, including showers and thunderstorms as well as tornadoes, affected parts of the Midwest and South. Along the Gulf Coast, temperatures were well-above normal with numerous single-day high temperature records broken. In Florida, drought conditions expanded across much of the state after another week of unseasonably warm temperatures and continued dryness with numerous cities across the state experiencing record dryness for the month.
Northeast
On this week’s map, the region remained drought-free and several small areas of Abnormally Dry (D0) in Connecticut, Massachusetts, New Jersey, New York, and Rhode Island were removed in response to precipitation events during the past several weeks, which provided a boost in soil moisture and streamflow levels. Average temperatures for the week were above normal across most of the region with largest positive anomalies (6-to-10+ degrees) observed across western portions of Pennsylvania as well as New York and West Virginia. Much of the region observed light precipitation during the past week with liquid accumulations of generally less than one inch with the exception of areas of central and western Pennsylvania that received 2-to-3 inches accumulation while snow showers were observed in the Adirondacks, Green Mountains, and White Mountains.
Southeast
During the past week, precipitation was observed across much of the northern portion of the region with the heaviest accumulations (3-to-5 inches) observed across northern portions of Alabama and Georgia while other parts of the region, including the Carolinas, received accumulations of generally less than two inches. In the southern portion of Alabama and Georgia as well as in Florida, the hot and dry pattern persisted leading to expansion of areas of Abnormally Dry (D0) and Moderate Drought (D1). In these areas, the 7-day average streamflows were mainly below normal levels. In Florida, a number of observing stations around the state recorded their driest March on record including Lakeland Linder Regional Airport (0.00”), St. Petersburg Albert Whitted Airport (0.00”), and Vero Beach International Airport (0.02”). According to the March 30 USDA Crop Progress and Condition Report, pasture conditions in Florida were steadily deteriorating around the state because of the abnormally warm temperatures and decreasing soil moisture levels.
South
On this week’s map, drought-affected areas of southern Texas and the Gulf Coast region of Louisiana and Mississippi saw continued deterioration resulting from the lack of rainfall and abnormally high temperatures. During the past week, a number of daily high-temperature records were either tied or broken across the region — including at the New Orleans International Airport that soared to 89 F on March 25. Along the Gulf Coast region of Louisiana and Mississippi, precipitation deficits (ranging from 3-to-6 inches) for the past 30-day period led to expansion of areas of Moderate Drought (D1). In the South Texas Plains and Gulf Coast Region, hot and dry weather this week led to continued expansion of areas of Moderate Drought (D1), Severe Drought (D2), and Extreme Drought (D3). In far southern portions of the state, temperatures reached the high 90s last week. According to the latest USDA Texas Crop Progress and Condition Report, some failed fields (small grains) in South Texas are being reported because of dry conditions while livestock across the state was rated in fair-to-good condition. In Oklahoma, above-normal precipitation during the past 30-day period led to removal of areas of Abnormally Dry (D0 and Moderate Drought (D1) in southwestern Oklahoma.
Midwest
On this week’s map, the region remained drought free. For the week, severe weather impacted much of the region including showers and thunderstorms as well as tornadic activity in Iowa, Illinois, Indiana, Kentucky, and Wisconsin. Precipitation accumulations for the week ranged from 1-to-3 inches with the greatest accumulations observed in northern Illinois, central Indiana, southern Michigan, and northern Ohio. Average temperatures were above normal across the region with the largest positive anomalies observed in the southern half of the region that saw average temperatures for the week ranging from 6-to-10+ degrees above normal.
High Plains
On this week’s map, only minor changes were made in Wyoming where an area of Abnormally Dry (D0) was introduced in response to below-normal snowpack conditions at several NRCS SNOTEL sites in the Wind River Range. Elsewhere, no changes were made on the map. Overall, precipitation for the week was light (generally <1.5” liquid accumulations) with areas of northwestern Kansas, eastern Nebraska, and southeastern South Dakota receiving the greatest accumulations. Average temperatures for the week were mostly above normal (2-to-8 degrees) with greatest positive anomalies observed in northern North Dakota and eastern Kansas while the plains of eastern Colorado and Wyoming were slightly cooler. For the past 30-day period, precipitation was below normal across the Dakotas, eastern Wyoming, southeastern Colorado, and portions of western Kansas, while above-normal precipitation was observed across much of Nebraska, eastern Kansas, and portions of northeastern Colorado.
West
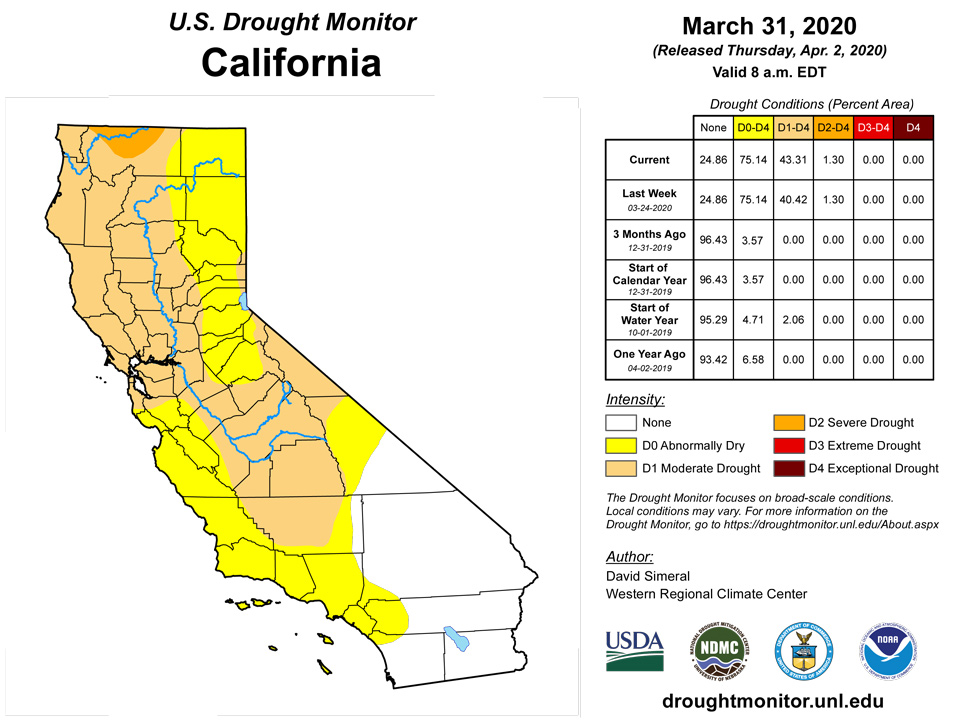
On this week’s map, areas of drought expanded in north-central Oregon, south-central Washington, central Nevada, and in the central Sierra Nevada of California. Elsewhere in the region, one-category improvements in areas of Abnormally Dry (D0), Moderate Drought (D1), and Severe Drought (D2) were made in northern Arizona where precipitation has been above normal during the past 30-day period. In California, the California Snow Surveys is reporting a statewide SWE percentage of normal of 54% with a regional breakdown as follows: North 57%, Central 58%, and South 45%. Elsewhere in the West, region-level (2-digit HUC) SWE at the end of the month was as follows: Great Basin 91%, Pacific Northwest 107%, Upper Colorado 108%, Lower Colorado 110%, Missouri 113%, Rio Grande 92%, and Arkansas-White-Red 105%. At a basin level (6-digit HUC), below-normal SWE was observed across several basins in Arizona and New Mexico (Salt 29%, Little Colorado 81%, Upper Gila 29%, Rio Grande-Elephant Butte 75%, Upper Pecos 82%) as well as in central Nevada (Central Nevada Desert Basins 78%, Walker 54%, Carson 76%, Truckee 71%) and Oregon (Southern Oregon Coastal 84%, Deschutes 84%).
Alaska, Hawaii, and Puerto Rico
No changes were made on this week’s map in the Hawaiian Islands, Alaska, or Puerto Rico. Across the island chain, average temperature were generally near normal with the exception of portions of the Big Island where average temperatures were 2-to-3 degrees below normal. Precipitation for the week was above normal on the windward and northern portions of the Big Island, Oahu, and Kauai while the southern portions of the Big Island, Maui, Lanai, and Molokai were well-below normal. For the month of March, Hilo Airport logged 27.56 inches (212% of normal) while Honolulu International Airport recorded 3.76 inches (191% of normal) and Lihue Airport 15.61 inches (348% of normal). In Alaska, average temperatures for the week were well above normal (ranging from 6-to-11 degrees) on the North Slope, Southwest, and portions of Southcentral while parts of the Interior and Southeast Alaska ranged from 2-to-6 degrees below normal. This week, precipitation was below normal across Southeast Alaska, portions of Prince William Sound, and Kodiak Island while some areas of the Interior, Far North, and Southwest were slightly above average. In Puerto Rico, moderate-to-heavy precipitation was observed this week with central and western portions of the Cordillera Central receiving accumulations ranging from 2-to-6 inches.
Pacific Islands
The weather conditions across the U.S.-Affiliated Pacific Islands (USAPI) during this USDM week (3/25/20-3/31/20) consisted of a continuation of a dry trade-wind regime across northern portions of Micronesia and convection associated with the Inter-Tropical Convergence Zone (ITCZ) in southern portions. The dry trade-wind regime is associated with the North Pacific Subtropical High which normally shifts southward during this time of year, with the ITCZ normally also shifting more toward the equator. Also, unusually warmer-than-normal sea surface temperatures near the Dateline the past several months have enhanced convection near the Dateline and suppressed convection farther west over much of Micronesia, especially far western Micronesia. The ITCZ took the form of a near-equatorial surface trough across southern portions of central to western Micronesia and trade-wind convergence across southern portions of central to eastern Micronesia. Weak circulations inhabited the ITCZ in the western sections early in the week while trade-wind disturbances developed in the eastern sections later in the week. A cold front/shear line early in the week, and trade-wind disturbance later in the week, brought isolated showers to the Marianas. South of the equator, a shear line early in the week created showers across the majority of the Samoan Islands, with the showers enhanced by orographic lift and daytime heating. Drier, more stable air moved over the islands later in the week.
Satellite-based estimates of 7-day precipitation (QPE) showed a rain band hugging the equator in the western Pacific, forming the ITCZ. The band split in two further east, with one arm stretching to the northeast north of the equator and another arm extending southeast south of the equator as the South Pacific Convergence Zone (SPCZ). In Micronesia, the satellite QPE depicted areas of 4 inches or more of rain across southern Micronesia, with amounts rapidly decreasing between 5 and 8 degrees north latitude. Little to no rain was depicted by the satellite analysis over northern portions of Micronesia. The satellite QPE depicted a broken band of 2 to 4 inches of rainfall extending northwest to southeast across the Samoan Islands, with little precipitation evident on either side of the band. SPCZ rain could be seen further to the west.
In the Republic of Palau, the last 4 weeks have been dry (less than the 2-inch weekly minimum needed to meet most water needs) at Koror, with 1.19 inches recorded this week and 4.66 inches of rain for the month. This ranks March 2020 as the 13th driest March in the 69-year record, which translates to the 19th percentile. February-March had 15.16 inches which is the 31st driest February-March. According to local reports, vegetation from Koror and Airai’s stand point is looking more lime green and yellow. D0-S continued for Palau this week, but D1-S may be considered in the future if the dryness continues or impacts worsen.
Dry (less than the one inch weekly minimum) conditions continued this week for most of the Marianas. Weekly rainfall totals for the airport stations included 0.78 inch at Guam, 0.84 inch at Rota, and 0.90 inch at Saipan. But a few automated rain gauges on Guam recorded around 0.75 inch from Tuesday’s showers, and Tinian reported 1.10 inches for the week. The NPS automated station on Saipan recorded only 0.35 inch for the week. With 1.33 inches for the month, Guam had the 8th driest March in the 64-year record, with December-March ranking fifth driest. The KBDI (Keetch-Byram Drought Index) at Guam was well past 700, indicating an extreme fire risk. D2-S continued on Saipan and D1-S continued on Guam and Rota.
It was feast or famine again in the Federated States of Micronesia. Fananu has been missing for several months, so this station could not be analyzed. Weekly rainfall totals for the reporting stations ranged from zero at Woleai, 0.04 inch at Rumung, and 0.06 inch at Chuuk, to 6.05 inches at Lukonor. D-Nothing continued at Kosrae, which reported 4.38 inches for the week and 11.33 inches for the month, and at Pohnpei where 3.35 inches was reported for the week, bringing the March total to 9.05 inches. This week had 1.90 inches of rain at Kapingamarangi, but the previous 2 weeks were wet and the month totaled 14.52 inches, so D-Nothing continued. Even though Nukuoro recorded 3.38 inches for the week and 17.40 inches for March, D0-S continued to reflect lingering agricultural impacts. D1-S continued at Woleai which had the fifth driest January-March. Chuuk recorded 0.06 inch for the week (with one day missing), but 5.26 inches for the month which ranks as the 15th driest March. February-March ranked as the 7th driest, so D0-S continued. Ulithi had 0.70 inch of rain for the week, marking the 8th consecutive dry week. With 1.74 inches for the month, March 2020 ranked as the 4th driest March in the 37-year record and February-March ranked as the 8th driest such 2-month period. The status at Ulithi was worsened to D2-S. With 6.05 inches of rain for the week and 12.04 inches for the month, the status at Lukonor was improved to D0-S. Yap reported 0.18 inch of rain for the week and 1.14 inches for the month. Yap had the third driest March and fourth driest January-March. D2-S continued at Yap this week, but the status could be worsened to D3-S if the dry conditions continue. Pingelap had 1.10 inches for the week and 4.90 inches for the month. This ranked March 2020 as the 9th driest March. February-March ranked 7th driest, January-March 6th driest, and December-March 5th driest. D0-S continued at Pingelap, but the status could be worsened to D1-S if dry conditions continue.
In the Marshall Islands, the week was wet in the south and dry in the north. Mili recorded 4.10 inches for the week, keeping the status at D-Nothing, and Jaluit 3.00 inches, which improved the USDM status to D-Nothing. But it was dry at the rest of the reporting stations, with weekly rainfall totals ranging from 0.26 inch at Kwajalein to 1.09 inches at Majuro. Wotje received 0.85 inch of rain on the 28th, but that was the only day with measureable rainfall this month, so D3-S continued. Utirik reported 0.96 inch for the week, bringing the monthly total to 2.27 inches. With each of the last 4 months dry, D2-S continued at Utirik. D1-S continued at Kwajalein, which reported 0.26 inch of rain this week and 1.54 inches for the month. With the Majuro reservoir at 26.65 million gallons on March 30, this is 74% of maximum, which is below the threshold for concern. Majuro reported 1.09 inches of rain for the week, and Ailinglapalap 0.60 inch. Both of these stations continued at D0-S, but their status could be worsened to D1-S if the dryness continues.
In American Samoa, Pago Pago (3.96 inches) and the automated station at Toa Ridge (1.12 inches) recorded more than the weekly minimum rainfall of 1 inch, while less than an inch was measured at the automated station at Siufaga Ridge (0.76). The March rainfall total at Pago Pago was 8.19 inches, twice the monthly minimum needed to meet most water needs. With a wet week and month, February-March and December-March ranking second wettest in Pago Pago’s 54-year record, and January-March wettest on record, D-Nothing continued at Tutuila.
Virgin Islands
During this USDM week (3/25/20-3/31/20), surface and mid- to upper-level troughs moved across the U.S. Virgin Islands (USVI), generating scattered showers, while a surface high moving across the western Atlantic created a fresh to locally strong northeasterly flow. The troughs were replaced by a dry and stable air mass associated with strong high pressure ridging both in the upper level and at the surface.
Radar-based estimates of rainfall for the 7 days ending at 12z on Tuesday depicted up to half an inch of precipitation across scattered parts of the USVI, with other parts receiving little to no precipitation.
This week was drier than normal at all reporting stations with weekly rainfall totals ranging from 0.03 inch at Windswept Beach on St. John and 0.08 inch at CoCoRaHS stations Anna’s Retreat and Christiansted 4.1 ESE, to 0.25 inch at East Hill and 0.32 inch at the UVI sheep farm, both on St. Croix. But last week was wet and month-to-date totals are still above normal. The USGS well on St. John (Susannaberg DPW 3) continued to decline this week; the well on St. Croix (Adventure 28) has started rising in the past week; and the one on St. Thomas (Grade School 3) was rising the last 2 weeks, leveled off this week, but the last two days has started decreasing again. There was no change in the USDM status from last week, with D-Nothing continuing for St. John and St. Thomas, and D0-L continuing for St. Croix.
Looking Ahead
The NWS WPC 7-Day Quantitative Precipitation Forecast (QPF) calls for moderate-to-heavy accumulations ranging from 1-to-5 inches across central and eastern portions of Texas and slightly lesser accumulations in southeastern Oklahoma, Arkansas, and northern Mississippi. Across much of the Southeast, the dry pattern is forecasted to continue with the exception of northern portions, which are forecasted for light accumulations (1-to-2 inches). In portions of the northern Plains and western portions of the Midwest, generally light accumulations (<1 inch liquid) are expected. Out West, moderate-to-heavy accumulations (ranging from 1-to-4 inches liquid) are forecasted for northern California while western portions of Oregon and Washington are forecasted to receive less accumulation. Across the Intermountain West, liquid accumulations of generally less than one inch are expected for parts of the central and northern Rockies, Uinta, and Wasatch ranges of Utah while the Southwest is expected to be dry. The CPC 6-10-day Outlook calls for a moderate-to-high probability of above-normal temperatures east of the Rockies while areas west of the Rockies are expected to be below normal. In terms of precipitation, there is a moderate-to-high probability of above-normal levels across California and Nevada while there is a low-to-moderate probability of above-normal precipitation across the remainder of the West with the exception of the areas of Colorado and New Mexico where below normal precipitation is expected. Elsewhere, above-normal precipitation is expected (33% to 50% probabilities) across the eastern half of the conterminous U.S. with the exception of Florida where dry conditions are expected to prevail. In Alaska, the northern two-thirds of the state have a high probability of above-average precipitation while the Aleutians, Southcentral, and Southeast should be below normal.
Author(s):
David Simeral, Western Regional Climate Center
Richard Heim, NOAA/NCEI
Dryness Categories
D0 Abnormally Dry—used for areas showing dryness but not yet in drought, or for areas recovering from drought.
Drought Intensity Categories
D1 Moderate Drought
D2 Severe Drought
D3 Extreme Drought
D4 Exceptional Drought
Drought or Dryness Types
S Short-Term, typically less than 6 months (e.g. agricultural, grasslands)
L Long-Term, typically greater than 6 months (e.g. hydrologic, ecologic)
Source: National Drought Mitigation Center

