


California and National Drought Summary for April 7, 2020
Summary
April 10, 2020 - This U.S. Drought Monitor week saw drought expansion across portions of the South (Louisiana, Mississippi) and Southeast (Florida) where warm and dry conditions prevailed during the past 90-day period causing declines in soil moisture and streamflow levels. In Texas, significant rainfall across parts of the state led to improvement in drought-related conditions in South Texas and the Hill Country while areas along the Texas Gulf Coast missed the heavier accumulations. In the northern Plains, record-breaking cold affected the region including eastern portions of Wyoming and Montana. Further West, another series of Pacific storms delivered beneficial rainfall to coastal areas and valley locations in California and Oregon while significant mountain snowfall was observed across the Sierra Nevada, Trinity Mountains of northern California, Cascades, and the northern Rockies. For the month of March, the contiguous U.S. experienced its 30th wettest on record as well as its 10th warmest including record-warmth observed in areas of Texas, Louisiana, Mississippi, Alabama, Georgia, and Florida.
Northeast
On this week’s map, the region remained drought free. During the 7-day period, a Nor’easter impacted parts of the region bringing damaging winds, rain and snow, and some minor coastal flooding with the heaviest precipitation accumulations for the week (1.0-to-2.5 inches liquid) observed in eastern Massachusetts, New Hampshire, and Maine. Average temperatures for the week were above normal (2-to-5º F) across most of the region with the exception of coastal areas of Massachusetts and Rhode Island that saw average temperatures that were 1-to-3 degrees below normal. According to the National Weather Service (NWS) National Operational Hydrologic Remote Sensing Center (NOHRSC), 29.6% of the region was covered by snow (compared to 71.3% last month) with an average depth of 4.4 inches and a maximum depth of 88.9 inches. According to the National Centers for Environmental Information (NCEI), the Northeast Climate Region experienced its 10th warmest and 67th wettest March on record.
Southeast
During the past week, most of the region was dry with some light precipitation observed (generally <1 inch) in isolated areas of southern portions of Alabama and Georgia as well as in parts of Florida. A combination of indicators—including above normal temperatures, lack of rainfall, declining soil moisture, and low streamflow levels—led to continued expansion of areas of Moderate Drought (D1) and Severe Drought (D2) in northern Florida as well as expansion of areas of Abnormally Dry (D0) in central and southern Alabama plus southern Georgia. Elsewhere in the region, some lesser rainfall accumulations (generally <1 inch) were observed along coastal areas of North Carolina as well as in southern Virginia. According to NCEI, the Southeast Climate Region experienced its 4th warmest March on record with Florida seeing its warmest and 2nd driest March on record while Alabama, Georgia, and South Carolina had their 5th warmest March on record. According to the USDA (April 5), the percentage of topsoil moisture rated short to very short was as follows: Alabama 16%, Florida 64%, Georgia 26%, South Carolina 2%, North Carolina 5%, and Virginia 9%.
South
On this week’s map, drought-affected areas of Texas saw widespread improvements in areas of Moderate (D1), Severe Drought (D2), Extreme Drought (D3), and Exceptional Drought (D4) in response to moderate-to-heavy to rainfall accumulations (ranging from 2-to-5 inches) in South Texas as well as in the Hill Country during the past 7-day period. Drought-stricken areas along much of the Gulf Coast of Texas, however, received accumulations of generally less than one inch. According to the USDA, topsoil moisture in Texas was rated 27% short to very short while Louisiana rated 18% short to very short. In Louisiana and Mississippi, areas of Abnormally Dry (D0) and Moderate Drought (D1) expanded along southern portions in response to another week of warm and dry conditions with numerous streamflow gaging stations reporting 7-day average streamflow levels below the 25th percentile. In the Oklahoma Panhandle, dry conditions persisted this week leading to minor expansion of areas with Abnormally Dry (D0), Moderate Drought (D1), and Severe Drought (D2) ratings. As a region, the South Climate Region experienced its 13th wettest March and 5th warmest.
Midwest
On this week’s map, the region remained drought free. For the week, some wintery weather impacted part of Minnesota with snowfall accumulations ranging from 6-to-16 inches in areas of northwestern Minnesota, increasing the likelihood of major springtime flooding in the Red River Valley. According to the NWS NOHRSC, 20.6% (as compared to 58.9% last month) of the Northern Great Lakes Region is covered by snow while the Upper Midwest region is 3.2% covered by snow (compared to 33.7%) last month. According to NCEI, the Ohio Valley Climate Region had it 15th wettest (13th warmest) March on record while the Upper Midwest Climate Region experienced its 23rd wettest (15th warmest).
High Plains
On this week’s map, areas of the region—including northeastern Colorado, west-central Kansas, and southwestern Nebraska—saw minor improvements in areas of Abnormally Dry (D0) in response to above-normal precipitation during the past 30-day period. Elsewhere, drought-related conditions deteriorated in southwestern Kansas and south-central Colorado in the San Luis Valley where an area of Severe Drought (D2) was added to the map. In northern portions of the Sangre de Cristo Range, situated on the east side of the San Luis Valley, numerous NRCS SNOTEL observing stations were reporting below-normal, snow-water- equivalent levels (SWE) levels. Elsewhere in the region, average temperatures were well-below normal for the week with numerous locations reporting daily record-low temperatures including Worland, Wyoming which dipped to 2° F on April 3. Interestingly, Worland broke the daily high-temperature record on April 6 soaring to 70° F. For the week, moderate-to-heavy snowfall accumulations were observed across portions of South Dakota, North Dakota, and Wyoming as well as the central Rockies of Colorado. For the month of March, North Dakota experienced its 12th driest on record. According to the NRCS SNOTEL network, basins (6-digit HUC) across Wyoming and Colorado were reporting near-normal to above-normal SWE levels.
West
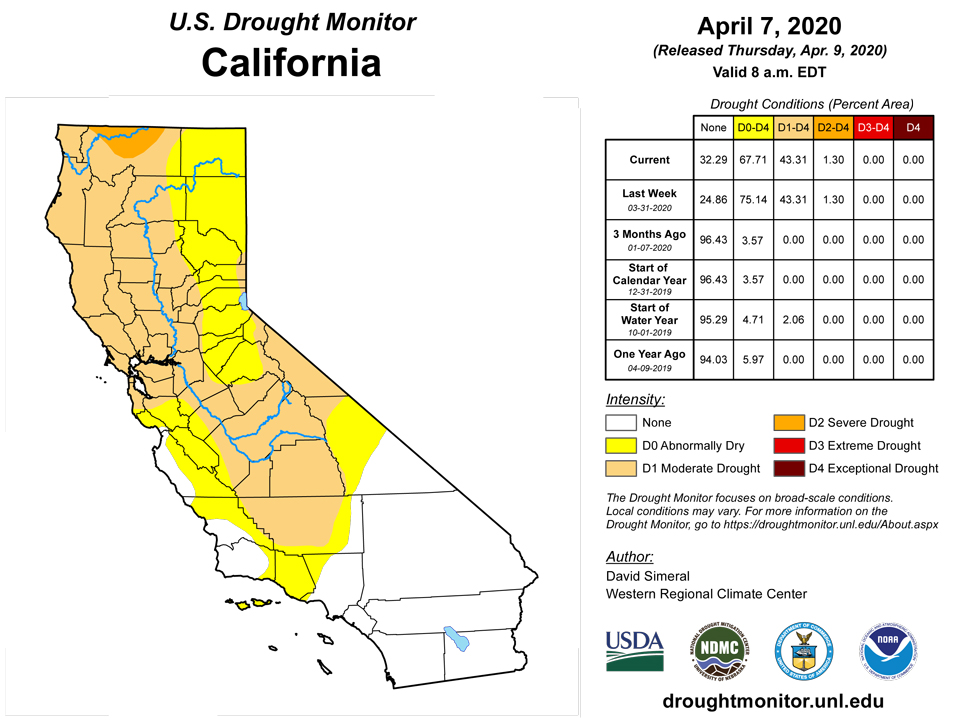
On this week’s map, recent precipitation events and improving SWE levels led to minor improvements in drought-affected areas of west-central Oregon (areas of D1 and D2) and in south-central Idaho (areas of D2) where snowpack conditions received a needed boost in the Big Lost, Big Wood, and Little Wood basins. In west-central Utah and east-central Nevada, a small area of Moderate Drought (D1) was added in response to short-term dryness during the past 30–90 days. In California, another round of late-spring storms impacted the state delivering beneficial precipitation to the higher elevations of the Sierra Nevada and Trinity Mountains of northern California. In addition, the central California coastal ranges as well as the Transverse Ranges of southern California received rainfall accumulation ranging from 2 to 6 inches leading to removal of areas of Abnormally Dry (D0) from Monterey County southward to San Diego County. As of April 7, the California Cooperative Snow Surveys were reporting the statewide snowpack at 63% of normal with the regional breakdown as follows: North 67%, Central 67%, and South 53%. Elsewhere in the West, the NRCS SNOTEL network is reporting the following region-level (2-digit HUC) SWE levels: Pacific Northwest 110%, Missouri 111%, Upper Colorado 103%, Great Basin 94%, Lower Colorado 105%, Rio Grande 79%, and Arkansas-White-Red 90%. According the NCEI’s climatological rankings, both Arizona and New Mexico experienced their 10th wettest March on record.
Alaska, Hawaii, and Puerto Rico
On this week’s map, no changes were made in Alaska or Puerto Rico. In the Hawaiian Islands, some minor improvements were made on northern portions of the Big Island, Maui, and Lanai in response to recent rainfall events and on-the-ground reports. Across the island chain, average temperatures were within a few degrees of normal with the exception of the Big Island where average temperatures were 2 to 6 degrees below normal. All the islands, with the exception of the windward side of the Big Island, were dry this week. On the Big Island, rainfall totals for the week ranged from 2 to 4 inches. For the month of March, precipitation was well above normal across most of the island chain with the exception of Molokai and northern portions of Maui. On Kauai, the Lihue Airport observed its 3rd wettest (15.62 inches) March on record while the observing station at Wheeler Army Airfield in Central Oahu had its 2nd wettest (11.4 inches) March on record dating back to 1950. In Alaska, average temperatures for the week were well above normal (12 to 25º F) on the North Slope and Northwest Arctic regions while temperatures were 5-to-13 degrees below normal across Southeast Alaska. On April 4 in the Northwest Arctic village of Kotzebue, the high temperature reached a daily record high of 33° F (+25.3° F departure from normal). In terms of snowpack, NRCS SNOTEL stations across the Interior were reporting above-normal SWE levels while numerous stations further south on the Kenai Peninsula were well-below normal. In Puerto Rico, light-to-moderate precipitation was observed this week with central and eastern portions of the Cordillera Central receiving accumulations ranging from 1 to 4 inches.
Pacific Islands
The weather conditions across the U.S.-Affiliated Pacific Islands (USAPI) during this USDM week (4/1/20-4/7/20) continued a pattern of dry trade winds across northern and western portions of Micronesia and convection associated with the Inter-Tropical Convergence Zone (ITCZ) in southern and eastern portions. The dry trade-wind regime is associated with the North Pacific Subtropical High which normally shifts southward during this time of year, with the ITCZ normally also shifting more toward the equator. Also, unusually warmer-than-normal sea surface temperatures near the Dateline the past several months have enhanced convection near the Dateline and suppressed convection farther west over much of Micronesia, especially far western Micronesia. The ITCZ took the form of troughs which hugged the equator in the west and which stretched northeastward across Kosrae State and the Marshall Islands (RMI) in the east. Within this dry west/wet southeast scenario, a couple trade-wind disturbances moved across the west, bringing isolated showers to the Marianas, while weak circulations, trade-wind disturbances, and trade-wind convergence inhabited the ITCZ in the east. South of the equator, a monsoonal trough (the South Pacific Convergence Zone, or SPCZ) was located southwest of the Samoan Islands with weak ridges taking up residence over American Samoa. Tropical Cyclone Harold (25P) formed within the SPCZ early in the week. While Harold stayed far away from the Samoan Islands, its influence was felt as it nudged SPCZ showers over the territory.
Satellite-based estimates of 7-day precipitation (QPE) showed a band of rainfall across Indonesia just south of the equator, which bifurcated to the east with one branch extending southeast as the SPCZ and the other branch going northeast over eastern Micronesia. The satellite QPE showed areas of 4+ inches of rain over parts of eastern Federated States of Micronesia (FSM) and the RMI, with areas of 2+ inches across southeast Yap State to southern Chuuk State. There were hints of precipitation north of Yap and near Guam, but these localized showers were too small and transient to be detected well by the satellite QPE. Otherwise, little to no precipitation was indicated across western Micronesia. South of the equator, the QPE showed an extensive area of 2+ inches of rain to the south and west of American Samoa, with fingers of 0.5 to 2.0 inches reaching across the Samoan Islands.
In the Republic of the Marshall Islands (RMI), Ailinglapalap recieved only a half-inch of rain this week (with 1 day missing). Should dryness prevail this week, it would mark the third consecutive dry week. Sub-minimum rainfall (less than 8 inches) was reported during the months of February and March 2020, with amounts of 3.06 and 3.83 inches, respectively. The drought category for Ailinglapalap worsened from D0(S) last week to D1(S) this week, with last week's OCONUS drought author alluding to potential deterioration. Jaluit continued to have drought-free conditions. The atoll received 5.86 inches of rain this week. This marks the 4th wet week in a row. The March 2020 rainfall total in Jaluit was 11.23 inches. This week, the atoll of Kwajalein received 0.73 inch of rain. During the month of March, Kwajalein received 1.54 inches of rain, which is well below the 8-inch amount considered adequate to meet most monthly water needs. Using data through the end of March, SPI values for 1,2,3,6,12,18, and 24 months are (respectively): -0.71, -0.20, -0.24, -0.36, -1.13, -1.37, and +0.05. Based on these SPI values and inadequate rainfall, Kwajalein's designation was therefore downgraded to D2(S) this week. In March, Majuro received 5.32 inches of rain, which is below the minimum threshold for meeting most water needs. However, dryness was offset by a relatively wet week, with 3.56 inches of rain being reported. As of April 3rd, the Majuro reservoir stored 27.9 million gallons of freshwater. Compared with a maximum storage capacity of 36 million gallons, the reservoir currently stands at 77.4 percent of capacity. Accordingly, the drought category D0(S) was maintained. The coral atoll of Mili remains drought-free this week. The past 4 weeks (including the current week with 4.04 inches (1 day missing)) were wet, and the March rainfall total was 12.58 inches. For the past 11 consecutive weeks (not including the current week), and for the past 3 months, Utirik has received inadequate rainfall to meet most water needs. Only 0.43-inch of precipitation fell this week. The March rainfall accumulation at Utirik was a scant 2.69 inches. Considering these factors, the drought designation was downgraded this week from D2(S) to D3(S). Wotje received 2.34 inches of precipitation this week (1 day missing), which was enough to offset further deterioration. Like Utirik, the past 11 weeks were dry (that is, having received inadequate rainfall to meet most water needs). The past 4 months were also relatively dry, with March seeing only 0.85-inch of rain. The current designation of D3(S) is being maintained this week.
In the Federated States of Micronesia (FSM), Chuuk Lagoon received 1.86 inches of rain this week (1 day missing). For the month of March, 5.29 inches of rain was reported. Chuuk Lagoon experienced its 7th driest February-March period in 69 years, which translates to the 10th percentile. Using data through the end of March, the SPI values for 1,2,3,6,12,18, and 24 months are (respectively): -0.75, -1.17, -0.88, -0.57, -1.02, -0.21, and -0.14. Based on these SPI values, recent precipitation, and significant impacts being reported on the islands to the south (Mortlocks) and north (Namanuitos/Hall Islands), it was decided that a one-class degradation in Chuuk Lagoon's drought designation from D0(S) to D1(S) was warranted. No data was reported for Fananu this week, as has been the case for some time now. The last available monthly rainfall total (10.33 inches) was reported back in September 2019. Kapingamarangi, Kosrae, and Pohnpei remain drought-free at this time. The rainfall totals so far this week are 3.97 inches, 5.22 inches (1 day missing), and 2.17 inches (1 day missing), respectively. During March, the respective accumulations were 14.52, 11.33, and 9.05 inches. Only 0.13-inch of rain was reported in Lukunor this week (2 days missing). Lukunor experienced a wet March, having observed 12.06 inches of rain. There is no reason at this time to modify the D0(s) drought category. Nukuoro received 0.91-inch of rain this week (1 day missing), and 17.40 inches during the month of March. Despite the very heavy rain that fell last month, the D0(S) classification is being maintained to account for lingering agricultural impacts. At Pingelap, 4.60 inches of rain was measured this week (1 day missing), which is more than double the weekly rainfall minimum needed to meet most water needs. Pingelap's monthly rainfall total of 4.90 inches in March fell well short of the 8-inch monthly minimum. Until this week, there were reports of low catchment levels on nearby islands. However, the heavy rain experienced this week has offset further deterioration. Pingelap remains at D0(S). Ulithi has received sub-minimum weekly rainfall for the past 8 weeks (9 if this week is included). With one day of observations still missing, the rainfall total for this week is 0.55-inch, well short of the 2-inch weekly minimum. Ulithi received a meager 1.74 inches of rain during March, which makes this the 4th driest March in 37 years, translating to the 11th percentile. This location was just downgraded last week from D1(S) to D2(S), so there is no need for additional deterioration yet. Nearly two consecutive weeks have passed without any rainfall in Woleai. In March, Woleai received 5.16 inches of rain, which falls well short of the 8-inch minimum required to meet most water needs. The January-March period was the 5th driest in 34 years, translating to the 15th percentile. Based on the lack of rainfall, and reported impacts of salty wells, dry catchments, yellowing taro, and poor quality coconuts, Woleai's drought designation was downgraded from D1(S) to D2(S). Yap received 0.33-inch of rain so far this week (2 days missing). If this week remains dry, it will be the ninth consecutive week of dryness. The past three months have also been dry; March had only 1.14 inches of precipitation. This is the third driest March in 69 years in Yap, which translates to the 4th percentile. Other rankings include a January-March period equating to the 6th percentile, and a July 2019 - March 2020 period translating to the 4th percentile. SPI values at Yap for 1,2,3,6,12,18, and 24 months are (respectively): -1.79, -1.22, -1.88, -1.15, -1.88, -1.34, and -1.38. Given these SPI values, statistics, lack of rainfall, and a reservoir with low water levels, the drought designation at Yap was downgraded this week from D2(S) to D3(S). Incidentally, Rumung received 1.97 inches of rain during the month of March.
The Palau International Airport received a scant 0.05-inch of rain this week. Koror reported 4.66 inches of rain in March, which is well below the minimum 8-inch requirement to meet most water needs. Residents are highly encouraged to limit water usage and to continue with water conservation efforts. Fires were reported on Babeldaob/Big Island, specifically in Airai, Aimeliik, and Ngatpang states. During the period January-March, 62 fire incidents were recorded. The largest incident was a recent fire that crossed the borders of Aimeliik and Ngatpang, consuming 180 acres. SPI values for 1,2,3,6,12,18, and 24 months (respectively) are: -0.82, -0.13, -0.92, -0.67, -1.08, -1.42, and -2.02. Based on the dry conditions, SPI values, water conservation measures, and fire activity, the drought designation for Palau was downgraded from D0(S) to D1(S).
In the Commonwealth of the Northern Mariana Islands (CNMI), rainfall amounts in Saipan this week included 0.08-inch measured from a manual gauge, 0.04-inch from ASOS, and 0.11-inch at an NPS site. For the past 8 weeks (not including this week), and the past 5 months, Saipan has not received adequate amounts of rainwater to meet most water needs. In March, Saipan recorded only 1.47 inches of rain. SPI values for Saipan for 1,2,3,6,12,18, and 24 months are (respectively): -0.57, -0.39, -0.93, +0.59, +1.06, +0.49, and +1.33. Based on these SPI values, and the lack of precipitation, the D2(S) drought classification for Saipan was worsened to D3(S). Nearby Tinian reported 2.51 inches of rain for the month of March. This week, Rota received 0.32-inch of rain. As with Saipan, the past 8 consecutive weeks were dry. However, unlike Saipan, only 2 of the past 5 months reported insufficient rainfall. One of those dry months was March, where the airport in Rota received 1.31 inches of rain, which is well short of the 8-inch minimum. The current drought category, D1(S) is being retained this week, but a downgrade may be required soon. Guam received 0.77-inch of rain this week. Local showers occurred in Guam during the past few days, but they did not reach the CNMI. On April 5th, Guam International Airport received 0.66-inch of rain, which is a daily record. For the month of March, Guam received 1.33 inches of rain, which falls well shy of the 4-inch monthly minimum for this location. This ranks as the 8th driest March in 64 years, translating to the 12th percentile. Additionally, December-March precipitation equated to the 8th percentile. Using data through the end of March, the SPI values for Guam at 1,2,3,6,12,18, and 24 months are (respectively): -0.86, -0.19, -0.43, +0.05, -0.16, -0.31, and +0.58. Guam's current status of D1(S) is therefore retained this week.
In American Samoa, Pago Pago received 3.57 inches of rain this week. In March, Pago Pago reported 8.19 inches of rain, which is more than double the minimum monthly requirement of 4 inches to meet most water needs. Siufaga Ridge (NPS) reported 3.27 inches of rain this week, and Toa Ridge (NPS) reported 2.38 inches of rain this week. Given the adequate rainfall across American Samoa, Tutuila remains drought-free.
Virgin Islands
At St. Thomas, CoCoRaHS station VI-ST-1 (Anna's Retreat) reported a trace of rain during the drought week. The Cyril E. King Airport reported a trace of precipitation so far in April. Since March 1st, 2.60 inches of rain fell (normal is 1.90 inches), and Year-To-Date (YTD) precipitation totaled 7.55 inches (normal is 5.71 inches). According to the USGS, the Grade School 3 Well in Charlotte Amalie indicated declining water levels. Currently, the water level is about 9 feet below the land surface. SPI values at 1,3,6,9, and 12 months for Charlotte Amalie are (respectively): +0.73, +0.65, -0.08, +0.56, and -0.03. St. Thomas continues to be drought-free. At St. John, a voluntary observer reported 2.37 inches of rain had fallen on Windswept Beach during the month of March, and no rain has fallen during the first week of April (thus far). Provisional USGS well data for the Susannaberg DPW 3 Well shows a steady decline in the water level since late January 2020. Current water levels are about 12.5 feet below the land surface. SPI values at 1,3,6,9, and 12 months for Windswept Beach are (respectively): -0.2, +0.99, 0, +0.26, and +0.25. As with St. Thomas, St. John remains drought-free this week. At St. Croix, CoCoRaHS station VI-SC-8 (Christiansted 1.8 ESE) reported 0.0 inches of rain this week; as did VI-SC-9 (Christiansted 4.1 ESE). At the Henry E. Rohlsen Airport, 0.09-inch of precipitation was reported so far this April. Since March 1st, 3.85 inches of rain has fallen which is almost twice the normal amount (1.96 inches) for the same period. YTD rainfall is 7.60 inches (normal is 5.75 inches). The UVI sheep research facility on St. Croix also reported a quiet start to April, with only 0.04-inch of rain observed this week. The Adventure 28 well on the island of St. Croix reports a water level nearly 20 feet below the land surface. Since August 2019, the water level has varied between 19-21 feet of the land surface. SPI values at 1,3,6,9, and 12 months for Christiansted (respectively) are: +1.56, +1.00, -1.14, -0.68, and -0.52. St. Croix's drought designation remains as D0(L) this week.
Looking Ahead
The NWS WPC 7-Day Quantitative Precipitation Forecast (QPF) calls for light-to-moderate accumulations ranging from 1 to 3 inches across portions of the South including Louisiana and Mississippi as well as parts of the Southeast including Alabama, the Florida Panhandle, and Georgia. Along most of the Atlantic Seaboard, accumulations of <2 inches are expected. Elsewhere, the southern half of California is forecasted to continue to receive precipitation (ranging from 1-to-3 inches liquid) while further eastward the central and northern Rockies are expected to receive liquid accumulations of <2 inches. The CPC 6-10-day Outlook calls for a moderate probability of above-normal temperatures in California and western portions of Nevada, Oregon, and Washington as well as Alaska. Likewise, above-normal temperatures are expected in Florida and coastal areas of Georgia and South Carolina with the highest probabilities in southern Florida. For the rest of the continuous U.S., below-normal temperatures are expected. In terms of precipitation, there is a moderate-to-high probability of above-normal precipitation across the eastern third of the U.S. as well as across much of the Southwest extending northward into Colorado, Utah, and Wyoming. In Alaska, above-normal precipitation is expected with probabilities ranging from 33% to 50%. Elsewhere, there is a moderate-to-high probability of below-normal precipitation in northern California, the Pacific Northwest, and the northern Great Basin. In the northern Plains as well as central and western portions of Texas, there is a low-to-moderate probability of below-normal precipitation.
Author(s):
David Simeral, Western Regional Climate Center
Anthony Artusa, NOAA/NWS/NCEP/CPC
Dryness Categories
D0 Abnormally Dry—used for areas showing dryness but not yet in drought, or for areas recovering from drought.
Drought Intensity Categories
D1 Moderate Drought
D2 Severe Drought
D3 Extreme Drought
D4 Exceptional Drought
Drought or Dryness Types
S Short-Term, typically less than 6 months (e.g. agricultural, grasslands)
L Long-Term, typically greater than 6 months (e.g. hydrologic, ecologic)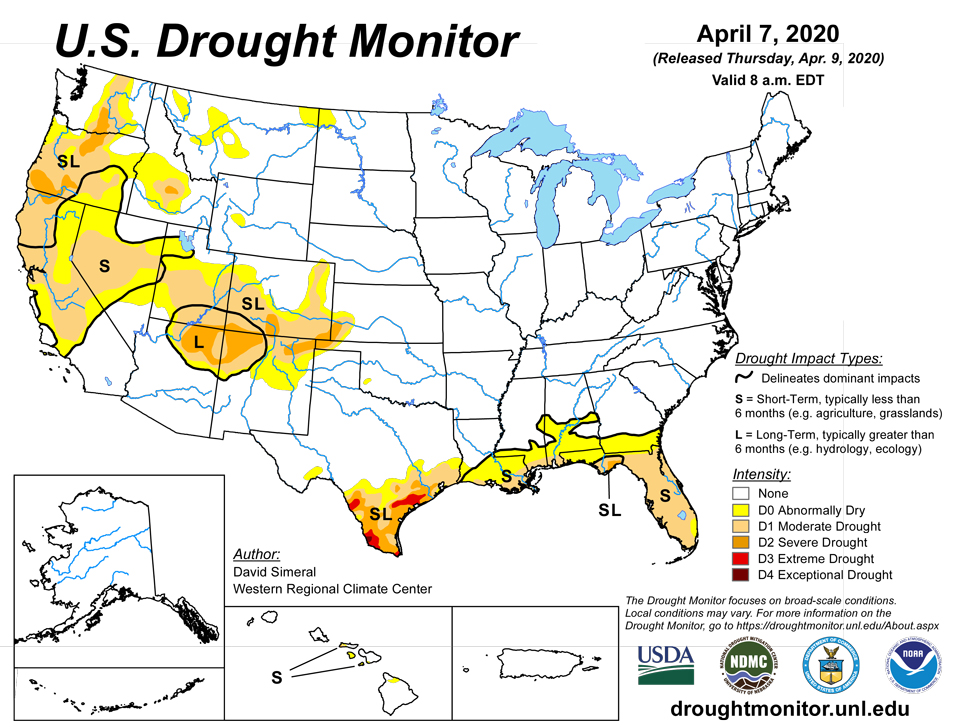
Source: National Drought Mitigation Center

