


IMPORTANT NOTE: This news release reflects employment data for the month of March 2020, taken from the survey week including March 12th, and partially predates the current economic impact created by COVID-19. Data for the survey week including April 12th is scheduled for release on May 22nd.
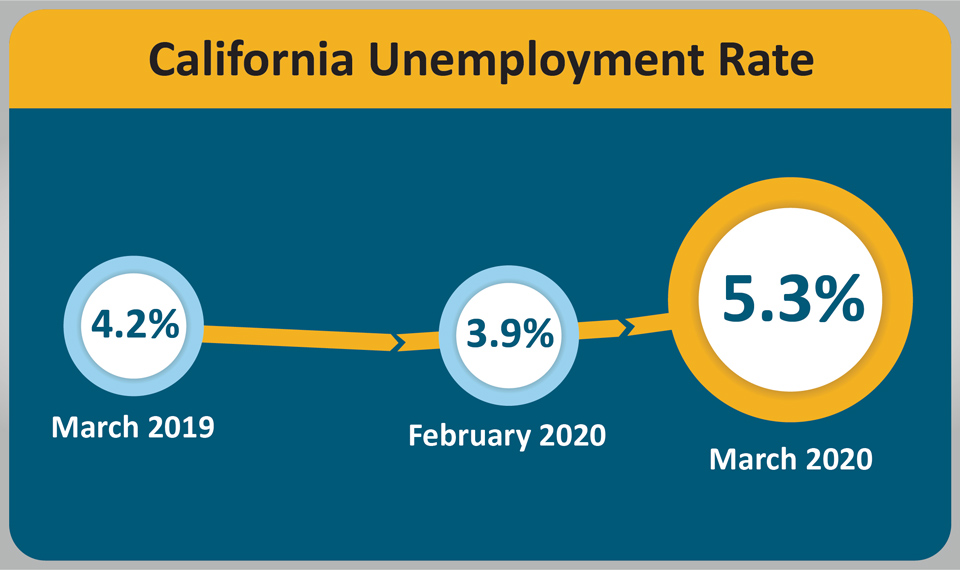
April 21, 2020 - SACRAMENTO – California’s unemployment rate jumped to 5.3 percent in March as the state’s employers lost 99,500 nonfarm payroll jobs, according to data released last week by the California Employment Development Department (EDD) from two surveys. The job losses in March ended a record job expansion in California of 120 months, which surpassed the long expansion of the 1960s. In the recent expansion, California had gained 3,417,700 jobs, which accounted for 15.0 percent of the nation’s 22,789,000 job gain over the same timeframe.

California’s Labor Market, by the Numbers...
- California’s unemployment rate rose by 1.4 percentage points in March to 5.3 percent1 which was the state’s largest unemployment rate increase on record in a data series going back to 1976.
- Despite the large month-over job loss, California employers still show a year-over job gain of 150,400 non-farm payroll jobs for March.
- March’s record 99,500 nonfarm payroll jobs2 loss was the fourth-largest on record, and driven by declines in six of California’s 11 industry sectors. Leisure & Hospitality (-67,200) posted the biggest jobs loss due in large part to drops in Full Service Restaurants as well as Food Services and Drinking Places. Other Services (-15,500) and Construction (-11,600) also experienced significant losses.
- Government’s large job gain (5,200) was mostly due to a rise in local government employment. Federal government employment also helped with larger-than-normal increases, boosted by growth in employment for the U.S. Census.
1. The unemployment rate comes from a federal survey of 5,100 California households.
2. The nonfarm payroll job numbers come from a separate federal survey of 80,000 California businesses.
Data trends about Jobs in the Economy
Total Nonfarm Payroll Jobs (Comes from a monthly survey of approximately 80,000 California businesses that estimates jobs in the economy – seasonally adjusted)
- Month-over – Total nonfarm jobs in California’s 11 major industries totaled 17,505,000 in March – a net loss of 99,500 jobs from February. This followed a revised gain of 21,000 jobs in February.
- Year-over – Total nonfarm jobs increased by 150,400 jobs (a 0.9 percent increase) from March 2019 to March 2020 compared to the U.S. annual gain of 1,504,000 jobs (a 1.0 percent increase).
 EEOmail@edd.ca.gov or call toll free 1-866-490-8879." style="box-sizing: border-box; vertical-align: middle; border-style: none; width: 1099.99px; max-width: 1100px;">
Total Farm jobs – The number of jobs in the agriculture industry increased by 1,100 jobs from February to 432,200. The agricultural industry has added 11,100 farm jobs since March 2019.
Data trends about Workers in the Economy
Employment and Unemployment in California (Based on monthly federal survey of 5,100 California households which focuses on workers in the economy)
- Employed – The number of Californians holding jobs in March was 18,244,100, a decrease of 512,600 from February and down 293,700 from the employment total in March of last year.
- Unemployed – The number of unemployed Californians was 1,020,100 in March, an increase of 260,800 over the month and up by 201,200 compared with March of last year.

Unemployment Insurance Claims (not seasonally adjusted)
The following data is from a sample week that includes the 19th of each month: In related data that figures into the state’s unemployment rate, there were 424,645 people certifying for Unemployment Insurance benefits during the March 2020 sample week. This is a sample week that includes the 19th of each month. That compares to 372,379 people in February 2020 and 387,767 people in March 2019. Concurrently, 186,479 initial claims were processed in the March 2020 sample week which was a month-over increase of 144,652 claims from the February 2020 data and 146,514 claims from the March 2019 data.

| COUNTY | LABOR FORCE | EMPLOYMENT | UNEMPLOYMENT | RATE |
|---|---|---|---|---|
| ALAMEDA | 833,500 | 801,500 | 31,900 | 3.8% |
| ALPINE | 530 | 490 | 40 | 7.1% |
| AMADOR | 14,850 | 14,050 | 800 | 5.4% |
| BUTTE | 98,800 | 92,200 | 6,700 | 6.7% |
| CALAVERAS | 21,530 | 20,380 | 1,160 | 5.4% |
| COLUSA | 11,500 | 8,930 | 2,570 | 22.4% |
| CONTRA COSTA | 554,200 | 532,000 | 22,200 | 4.0% |
| DEL NORTE | 9,730 | 8,990 | 740 | 7.6% |
| EL DORADO | 91,600 | 87,300 | 4,300 | 4.7% |
| FRESNO | 457,400 | 407,900 | 49,600 | 10.8% |
| GLENN | 13,290 | 12,140 | 1,150 | 8.7% |
| HUMBOLDT | 61,900 | 58,900 | 3,000 | 4.9% |
| IMPERIAL | 73,200 | 58,200 | 15,000 | 20.5% |
| INYO | 8,630 | 8,210 | 410 | 4.8% |
| KERN | 392,400 | 345,500 | 46,900 | 12.0% |
| KINGS | 58,900 | 51,700 | 7,200 | 12.3% |
| LAKE | 29,260 | 27,210 | 2,060 | 7.0% |
| LASSEN | 9,760 | 9,060 | 700 | 7.2% |
| LOS ANGELES | 5,004,400 | 4,683,900 | 320,500 | 6.4% |
| MADERA | 63,200 | 56,500 | 6,700 | 10.5% |
| MARIN | 137,700 | 133,500 | 4,200 | 3.0% |
| MARIPOSA | 7,310 | 6,750 | 560 | 7.6% |
| MENDOCINO | 38,560 | 36,310 | 2,260 | 5.9% |
| MERCED | 117,600 | 102,500 | 15,100 | 12.9% |
| MODOC | 3,130 | 2,770 | 360 | 11.5% |
| MONO | 8,730 | 8,300 | 430 | 4.9% |
| MONTEREY | 220,800 | 194,700 | 26,200 | 11.8% |
| NAPA | 73,200 | 70,300 | 2,900 | 4.0% |
| NEVADA | 48,120 | 45,890 | 2,230 | 4.6% |
| ORANGE | 1,602,900 | 1,545,200 | 57,800 | 3.6% |
| PLACER | 186,900 | 179,300 | 7,500 | 4.0% |
| PLUMAS | 7,660 | 6,650 | 1,010 | 13.2% |
| RIVERSIDE | 1,098,900 | 1,041,000 | 57,900 | 5.3% |
| SACRAMENTO | 709,800 | 676,100 | 33,600 | 4.7% |
| SAN BENITO | 31,700 | 29,200 | 2,500 | 7.9% |
| SAN BERNARDINO | 963,600 | 916,400 | 47,200 | 4.9% |
| SAN DIEGO | 1,577,600 | 1,513,000 | 64,600 | 4.1% |
| SAN FRANCISCO | 578,300 | 560,800 | 17,500 | 3.0% |
| SAN JOAQUIN | 328,400 | 301,300 | 27,100 | 8.3% |
| SAN LUIS OBISPO | 141,400 | 136,000 | 5,400 | 3.8% |
| SAN MATEO | 455,400 | 442,800 | 12,500 | 2.8% |
| SANTA BARBARA | 215,000 | 203,000 | 12,000 | 5.6% |
| SANTA CLARA | 1,042,500 | 1,008,200 | 34,300 | 3.3% |
| SANTA CRUZ | 141,700 | 130,400 | 11,300 | 7.9% |
| SHASTA | 73,400 | 68,400 | 5,000 | 6.8% |
| SIERRA | 1,310 | 1,200 | 110 | 8.5% |
| SISKIYOU | 17,220 | 15,510 | 1,710 | 10.0% |
| SOLANO | 208,200 | 197,800 | 10,400 | 5.0% |
| SONOMA | 256,600 | 247,300 | 9,300 | 3.6% |
| STANISLAUS | 245,600 | 225,300 | 20,300 | 8.3% |
| SUTTER | 47,400 | 42,100 | 5,200 | 11.1% |
| TEHAMA | 25,720 | 23,760 | 1,960 | 7.6% |
| trINITY | 4,490 | 4,070 | 420 | 9.2% |
| TULARE | 207,900 | 177,800 | 30,000 | 14.5% |
| TUOLUMNE | 21,680 | 20,340 | 1,340 | 6.2% |
| VENTURA | 422,900 | 403,400 | 19,500 | 4.6% |
| YOLO | 108,700 | 102,300 | 6,400 | 5.9% |
| YUBA | 31,100 | 28,400 | 2,600 | 8.5% |
Source: EDD
