


California and National Drought Summary for April 28, 2020
Summary
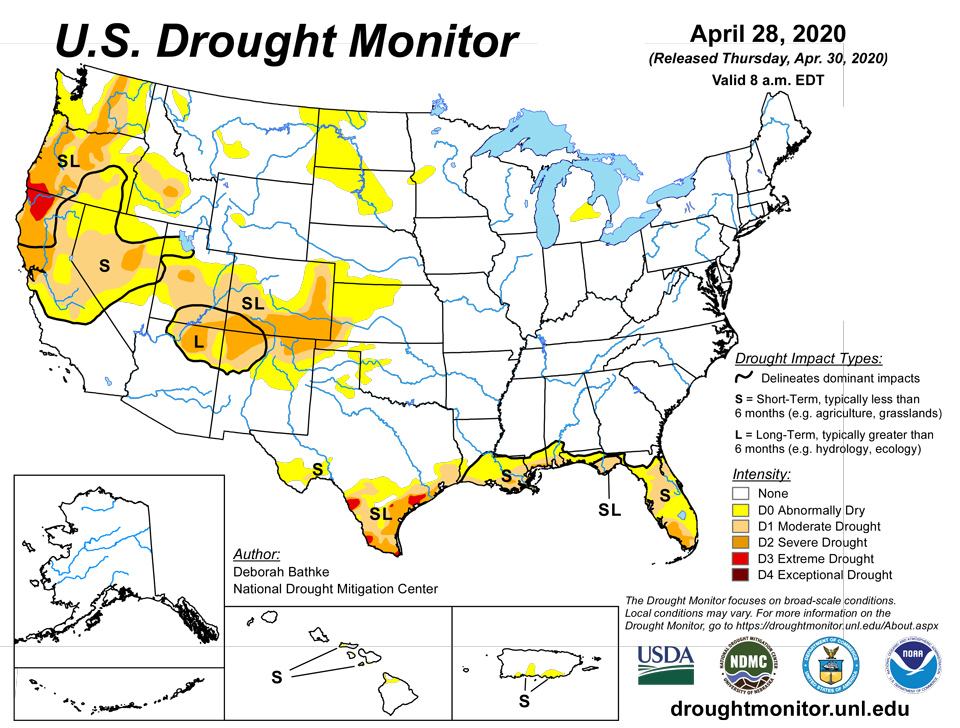
April 30, 2020 - An active pattern of storms brought cold, wet weather to the Northeast, rain and locally severe thunderstorms to parts of the South, lower Midwest, and Southeast. Drought areas along the western Gulf Coast missed the heaviest rains, while those in the eastern half fared better. A ridge of high pressure over the West kept conditions warm and dry.
Northeast
A series of weather systems brought cold, wet weather to the Northeast, keeping the region free of abnormal dryness and drought. A dip in the jet stream allowed an influx of cold air into New England and the Mid-Atlantic, setting record daily low temperatures and bringing snowfall to the northern tier and high elevations in the region. The week ended with mean temperatures ranging from 3 to 10 degrees below normal and precipitation totals ranging from less than 0.3 inches (less than 50% of normal) across the northern part of the region to more than 2 inches (greater than 200% of normal) across the southern part.
Southeast
The Southeast saw locally heavy rainfall and thunderstorms with parts of Georgia, Alabama, and Florida receiving upwards of 5 inches of rain. Average temperatures generally ranged 1 to 3 degrees below normal, with the exception of Florida, which saw temperatures of 2 to 5 degrees above normal. The rain helped improve the abnormally dry (D0) areas near the border of Alabama, Georgia, and Florida. In the Florida Panhandle, the rain finally was enough to help reduce moisture deficits and improve streamflow, resulting in the removal of the area of severe drought (D2) that had been in place since mid-February. Other improvements in Florida include a broad 1-category improvement across the northern and central part of the state as excess rain over the last two weeks erased deficits, replenished soil moisture and streamflow, and improved vegetation health. Southeast Florida saw small reductions in moderate and severe drought (D1 and D2) where more than 1.5 inches of rain fell and where precipitation, streamflow, and vegetation health indicators no longer supported the depiction.
Midwest
The western half of the region saw warmer than normal average temperatures, with departures ranging from 1 degree above normal in eastern Iowa to 8 degrees above normal in western Iowa. In the eastern half, temperatures were 1 to 7 degrees below normal, with the greatest departures generally occurring in the Upper Great Lakes area. Precipitation occurred across much of the region with weekly totals generally between 0.5 and 1.75 inches. A band of 3 to 4 inches of rainfall stretched from southwest Missouri to central Illinois. The only change in the region to this week’s map was a small reduction in abnormal dryness (D0) in Minnesota.
High Plains
Temperatures across the High Plains were generally warmer than normal last week with departures of 2 to 6 inches above normal. Much of the region received less than 0.5 inches of precipitation. Exceptions included parts of eastern North Dakota, South Dakota, and Nebraska, with totals of more than 1 inch, and eastern Kansas, with amounts of more than 2 inches – nearly 200% of normal. The warm, dry conditions led to an expansion of abnormal dryness (D0) in the Dakotas, southwest Nebraska, northwest Kansas, and eastern Colorado. Additionally, moderate and severe drought (D1 and D2) expanded over Colorado’s eastern plains. This area has failed to receive the timely spring rains needed, resulting in reductions in soil moisture, streamflow, and vegetation health. Across the entire High Plains region, local drought experts are discussing the emerging dryness and closely monitoring the situation as planting begins and the need for moisture increases.
South
Locally heavy rain and thunderstorms fell across the eastern half of the southern region. The largest totals (4 inches or more) were recorded in Louisiana and Mississippi. Temperatures were near to below normal, with the largest departures (5 degrees below normal) recorded in Tennessee. For the most part, the rain either missed the drought areas near the coast or wasn’t enough to warrant improvements in conditions, instead preventing degradations. The western half of the region generally saw little or no rain again this week. Weekly average temperatures ranged from 2 to 8 degrees above normal, with locations in south Texas setting daily record highs with temperatures reaching triple digits. The warm, dry weather continued to deplete moisture supplies, stress vegetation, and deteriorate drought conditions across parts of the Texas Gulf Coast, with expansions to moderate (D1), severe (D2) and extreme (D3) drought. Texas also saw improvements as localized rain improved soil moisture, vegetation health, and streamflow.
West
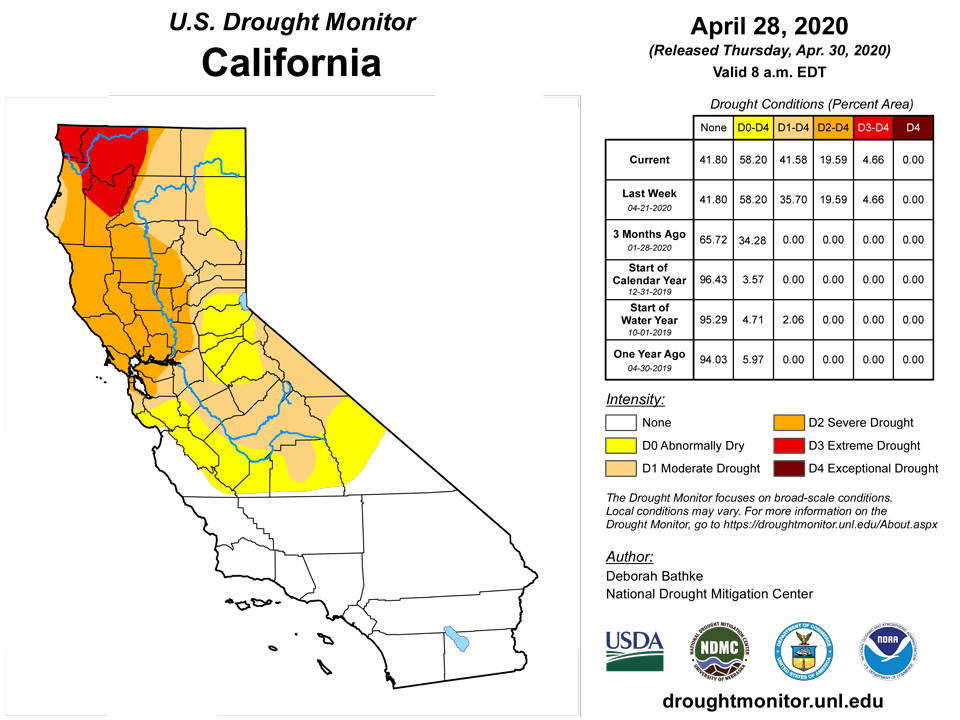
Most of the western U.S. received little to no rain, except for small pockets of the Pacific Northwest and the Southwest. Temperatures were generally above normal, with record-setting heat across parts of the Southwest and daily highs of 10 to 20 degrees above normal. The heat and dry weather led to deteriorating conditions across several states. In Oregon, severe drought (D2) expanded near Portland and in the north-central part of the state in response to drying soils, vegetation stress, and streamflow and groundwater declines. Precipitation for the water year ranks as the third driest in the Portland station’s 89-year period of record. In northern California, moderate drought (D1) expanded. While the state coordination committee noted that reservoir levels are acceptable, precipitation deficits are less 50% of normal for the water year, streamflow values are low, and rangeland grasses have been affected by the lack of moisture and heat. Likewise, parts of central Nevada also saw expansions to D1 and the introduction of D2 in response to increasing moisture deficits, declining streamflow and groundwater levels, and vegetation stress. The only improvements on this week’s map included minor reductions in D1 in Oregon and D0 in Washington in response to locally heavy rainfall.
Alaska, Hawaii, and Puerto Rico
In Alaska, no changes were made this week and the state continues to be free of abnormal dryness/drought. In Puerto Rico, an area of abnormal dryness (D0) was added to the southern part of the island where precipitation deficits occur out to 60 days and are accompanied by low streamflow, groundwater declines, and soil moisture deficits. In Hawaii, D0 expanded on the Big Island and moderate drought (D1) was introduced based on rainfall deficits and vegetation stress.
Pacific Islands
The weather conditions across the U.S.-Affiliated Pacific Islands (USAPI) during this USDM week (4/22/20-4/28/20) consisted of convergence associated with a near-equatorial trough across Palau and southwestern Yap State, and trade-wind surface troughs and differential trade-wind speeds over the central Federated States of Micronesia (FSM) to the southern and central Marshall Islands (RMI). These were all manifestations of the climatological Inter-Tropical Convergence Zone (ITCZ), although the ITCZ was most strongly manifested meteorologically from central to eastern Micronesia. Differential trade-wind speeds refers to trade winds with a higher wind speed overtaking, or converging upon, trade winds with lower wind speeds and is also referred to as a trade-wind surge. The convection associated with trade-wind convergence across central to eastern Micronesia was enhanced by upper-level divergence associated with an upper-level trough which lingered for several days from Yap State northeastward. In addition, trade-wind disturbances moved through the ITCZ and a circulation moved across southwest Yap State to southern Palau. The circulation intensified late in the week over southern Palau to the point of being designated Invest 94W. A dry trade-wind pattern dominated the Marianas and northern portions of Yap State and the RMI, although weak disturbances moving in the trade-wind flow brought showers to Guam late in the period. South of the equator, the Samoan Islands were bracketed by surface troughs to the northeast and southwest with drier and more stable air dominating the islands. A moist and unstable air mass moved over the territory late in the period.
Satellite-based estimates of 7-day precipitation (QPE) showed bands of precipitation stretching from Indonesia eastward across the Pacific between the equator and 10 degrees N latitude (the ITCZ), and from Indonesia southeastward past (south) of the Samoan Islands (the South Pacific Convergence Zone, or SPCZ). A continuous band of 1+ inches of rainfall was indicated from Palau, across the FSM, to the RMI and eastward, with embedded areas of 4+ inches. Little to no precipitation registered on the satellite QPE across the Yap archipelago, the Marianas, and the northern RMI. A large mass of 2+ inches of precipitation was detected by the QPE southwest of, and just to the northeast of, the Samoan Islands, with a band stretching across American Samoa.
For a second consecutive week, Palau had 5.48 inches of rain this week. Monthly precipitation totals are at 9.59 inches, which is above the 8 inches of rain to meet most water needs. Beneficial rains and local information stating that vegetation is green resulted in one category drought improvement (abnormally dry conditions).
Guam was the only location to have a little over the weekly threshold of 1 inch, while Saipan and Rota had less than an inch of rain at 0.21 inch and 0.62 inch, respectively. Precipitation totals for the month for all three locations were below the 4-inches threshold to meet most water needs at 2.44 inches (Guam), 1.20 inches (Rota) and 0.50 inch (Saipan). Sapian’s April rainfall total of 0.50 inch is the driest in the station’s 40-year record and Rota ranked as the second driest April in the location’s 25-year record. For this week, severe drought was unchanged for Guam, Saipan continued in extreme drought, while Rota's drought classification deteriorated to extreme drought.
The locations in western Federated States of Micronesia continued to be dry, receiving less than 1 inch of rain. Yap had the least amount of rain at 0.17 inch for the week, resulting in a monthly rainfall total of 2.80 inches. April 2020 marked Yap's fourth consecutive month with precipitation totals below 4 inches of rain, securing another week of extreme drought. Ulithi and Woleai had only 0.50 inch and 0.72 inch of rain this week, leaving them in severe drought.
Chuuk Lagoon had 1.31 inch of rain. Although the monthly rainfall total is at 7.71 inches, which is close to the 8 inches threshold to meet most water needs, moderate drought was unchanged this week.
Lukunor had 5.04 inches of rain this week, resulting in a monthly total of 9.28 inches. Since the last three weeks have been wet, drought classification was changed to drought free conditions.
Pohnpei, Kosrae, Kapingamarangi, Nukuoro, and Pingelap had over 2 inches of rain, with some of those stations having close to or over 8 inches of rain. These stations all remain drought free.
Most of the Marshall Islands had a wet week, receiving over 2 inches of rain. Jaluit and Mili had 2.25 inches and 3.75 inches, respectively, and continue to be drought free.
Majuro had over 4 inches of rain this week, resulting in 12.01 inches for the monthly total. Reservoir levels have improved, however, were at 74% as of April 27, which is below the critical level of 80%. For that reason, abnormally dry conditions persist this week.
This week marks the second consecutive wet week for Ailinglapalap, with precipitation totals over 3 inches during both weeks. The monthly total for April is slightly below 8 inches and the previous two months had less than 4 inches of rain, so for this week moderate drought remains.
Similarly, Kwajalein had over 3 inches of rain this week, resulting in a monthly total of 7.53. However, the previous month rainfall total was only 1.54 inch and local reports have stated that water supply in the island is still low. For this reason, severe drought remains unchanged.
Utirik had only 0.18 inch of rain this week, while Wotje had over 2 inches of rain. Since monthly precipitations were below 4 inches, extreme drought persists in these locations.
This week Siufaga Ridge had over 1 inch of rain, while Pago Pago and Toa Ridge had 0.53 inch and 0.81 inch of rain this week, respectively. Tutuila remains in drought free status since the monthly rainfall for Pago Pago, Siufaga Ridge, and Toa Ridge is close to or over three times the monthly threshold of 4 inches to meet most water needs.
Virgin Islands
Dry conditions continued to affect the USVI this week. Precipitation totals were less than 0.1 inch at St. Thomas and St. Croix, while St. John had the most rainfall at 0.51 inch. St. Thomas Cyril E. King airport's month-to-date rainfall total of 0.37 inch is 15.6% of normal precipitation, while the year-to-date is close to normal (104.2% of normal). Similarly, St. Croix Henry E. Rohlsen airport's month-to-date rainfall was only 0.45 inch or 24.4% of normal precipitation; however, the year-to-date rainfall total is close to normal at 111.0%. For this week, both stations remain in abnormally dry conditions.
St. John's monthly rainfall total is 0.56 inch or 19.9% of normal precipitation and the SPI value for one month is -1.08. The 3, 6, 9, and 12 month SPI indicate drought free conditions. For this reason, abnormally dry conditions also remain unchanged for St. John.
Looking Ahead
The National Weather Service Weather Prediction Center forecast for the remainder of the week calls for continued wet conditions across much of the eastern U.S., with the highest values (more than 2 inches) expected over the Mid-Atlantic. Temperatures in the eastern half of the country are expected to be near to above normal, with departures of 1 to 8 degrees, over the weekend. For the western half of the country, areas expected to receive an inch or more of precipitation include parts of the Pacific Northwest, northern Rockies, and Central Plains. In the Southwest, dry weather with temperatures 10 to 15 degrees above normal is expected to continue. Moving into next week, the Climate Prediction Center 6-10 day outlook (valid May 5-9) favors below-normal temperatures for the much of eastern half of the country. Above-normal temperatures are expected throughout the West, the southern Plains, along the Gulf Coast, and throughout Florida. The greatest probabilities for above-normal precipitation are expected from northern Texas to the Middle Mississippi Valley and along the Mid-Atlantic and New England coasts.
Author(s):
Deborah Bathke, National Drought Mitigation Center
Ahira Sanchez-Lugo, NOAA/NCEI
Dryness Categories
D0 Abnormally Dry—used for areas showing dryness but not yet in drought, or for areas recovering from drought.
Drought Intensity Categories
D1 Moderate Drought
D2 Severe Drought
D3 Extreme Drought
D4 Exceptional Drought
Drought or Dryness Types
S Short-Term, typically less than 6 months (e.g. agricultural, grasslands)
L Long-Term, typically greater than 6 months (e.g. hydrologic, ecologic)
Source: National Drought Mitigation Center

