


California and National Drought Summary for May 5, 2020
Summary
May 7, 2020 - A strong cold front progressed southeast across the Great Plains, Mississippi Valley, and Southeast on April 28 and 29. This cold front was a focus for a severe weather outbreak from Oklahoma and eastern Texas east to the middle and lower Mississippi Valley. As this front shifted south, heavy rain (more than 2 inches) fell from the western Gulf Coast east to the Florida Big Bend and Florida Gulf Coast. A summer-like ridge of high pressure aloft led to an early and persistent heat wave across southern California and the Desert Southwest during late April into early May. Much above normal temperatures also affected the southern Rockies and southern Great Plains. To the north of this upper-level ridge, multiple low pressure systems along a nearly stationary front resulted in occasional thunderstorms with locally heavy rain (1 inch or more) to the central Great Plains, middle Mississippi Valley, and Ohio Valley. Onshore flow led to a wet start to May across the coastal Pacific Northwest, but little to no precipitation was observed across the Great Basin. Surface low pressure, centered across the Gulf of Alaska, resulted in light to moderate precipitation amounts to the Kenai Peninsula, southeast mainland Alaska, and the Alaska Panhandle. Rainfall was generally suppressed across the tropical central and eastern Pacific, including Hawaii, during late April into the beginning of May. This dry pattern over the tropics extended east to Puerto Rico.
Northeast
Heavy rainfall (1 to 3 inches) soaked areas from the mid-Atlantic north to southern New England on April 30 and May 1. This heavy rainfall triggered flash flooding and small stream flooding. According to AHPS, 30-day precipitation amounts totaled 5 to 8 inches from Maryland northeast to eastern Maine. 90-day precipitation has averaged 125 to 200 percent of normal across the mid-Atlantic and the central to northern Appalachians. This region remains drought-free due to these wet conditions at the 30 to 90-day time scale.
Southeast
Locally heavy rain (2 inches or more) resulted in a decrease in moderate drought (D1) across the Big Bend of Florida. D1 was maintained in areas that received less than one inch of rain, roughly from Apalachicola to Tallahassee FL. 28-day streamflows remain low along the Sopchoppy and St. Marks Rivers in eastern Wakulla County. Widespread rainfall (0.5 to 3 inches) was observed across the central Florida Peninsula during the past week. Moderate short-term drought was reduced in areas that received more than 1 inch of rainfall. However, many 28-day streamflows remain below the 20th percentile across central and southern Florida. Meanwhile, severe drought continues to plague southwest and south Florida where the Keetch Byram Drought Index is high (above 550) in Collier, Broward, Miami-Dade, and Monroe Counties.
South
Heavy rain (widespread amounts of more than 2 inches) at the end of April prompted a 1-category improvement to parts of the western and northern Gulf Coast, including southern Louisiana and southeast Texas. This recent heavy rain resulted in precipitation surpluses during the past 30 days and normal (25th to 75th percentile) 28-day streamflows. However, dating back 6-months, large precipitation deficits (more than 8 inches) remain across southeast Louisiana and the along the Mississippi Gulf Coast. In contrast to the improving conditions across southeast Texas, drought coverage/intensity remained nearly steady or worsened slightly across south Texas. Abnormal dryness (D0) was expanded across the Texas Panhandle and northwest Oklahoma due to increasing 30 to 60-day precipitation deficits, above normal temperatures (highs well into the 90s and low 100s), and periods of strong winds during late April into the beginning of May. These indicators along with impact reports (poor pastures, low ponds, and poor winter wheat quality) support the introduction of a small D1 area in northwest Oklahoma.
Midwest
The Corn Belt remains drought-free due to long-term precipitation surpluses, favorable soil moisture, and a cool start to spring (30-day temperatures averaging 2 to 4 degrees F below normal). A small area of abnormal dryness (D0) was decreased this week due to recent rainfall. The largest 30-day precipitation deficits (around 3 inches) exist across northern Iowa.
High Plains
Increasing short-term precipitation deficits, exacerbated by above-normal temperatures recently and high evapotranspiration rates, support an expansion of abnormal dryness (D0), moderate drought (D1), and severe drought (D2) across Kansas. 60-day precipitation deficits range from 2 to 4 inches extending from southwest Kansas northeast to north-central Kansas. Russell, KS received only 0.40 inches of precipitation during April which was the 2nd driest on record (dating back to 1950) for the month. Russell’s normal April precipitation is 2.62 inches. Abnormal dryness was reduced in coverage across parts of South Dakota that received more than 1 inch of rainfall at the beginning of May. Recent heavy rainfall (more than 1 inch) also brought a 1-category improvement to the high Plains of northeast Colorado. Conversely, a 1-category intensification of drought conditions were necessary across parts of western, southern, and southeast Colorado. Southern parts of the San Luis Valley and southeast Colorado have experienced abnormal heat and high evaporative demand. SPI values on multiple time scales support the introduction of extreme drought (D3) to parts of the San Luis Valley and southeast Colorado. Farther to the north, abnormal dryness (D0) was expanded northeast Wyoming that missed the recent rainfall and where 60-day SPI values support it.
West
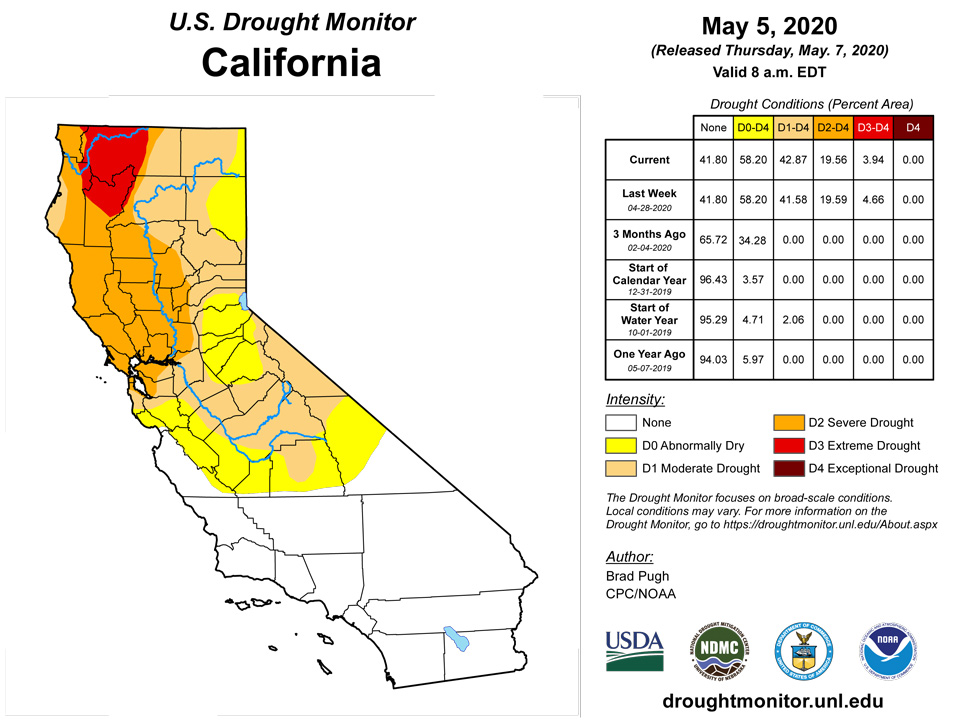
Precipitation for the water year to date (WYTD) , since Oct 1, 2019, has averaged less than 50 percent of normal across parts of Oregon, northern California, and the Great Basin. Based on 6 to 9-month SPI values, moderate (D1) to severe (D2) drought was expanded across parts of northern Nevada. Salt Lake City is coming off its driest April on record as it only measured 0.26 inches of precipitation (1.73 inches below normal). This dry April prompted an expansion of abnormal dryness (D0) north to include more of northern Utah. In contrast to the worsening conditions across the Great Basin, a wet start to May (1 to 3 inches, locally more) brought slight amelioration to extreme drought across coastal southwest Oregon and extreme northwest California. Intensifying drought conditions have occurred east of Cascades in Oregon and Washington. Based on poor WYTD precipitation (50 percent or less), severe drought was expanded across southeast Washington. Also, the lack of precipitation during April has adversely affected dryland farming in this part of the state. For similar reasons and support from SPI values on multiple time scales, moderate to severe drought expanded across eastern Oregon. Extreme drought (D3) was introduced to north-central Oregon and extends slightly north into south-central Washington.
Alaska, Hawaii, and Puerto Rico
No changes were necessary this week for either Alaska or Hawaii. The latest NDVI data supports the current depiction of D0 and D1 across the Hawaiian Islands. A slight increase in D0 across Puerto Rico was consistent with 60-day precipitation deficits.
Pacific Islands
A near-equatorial trough, trade-wind convergence, weak circulations, and general Inter-Tropical Convergence Zone (ITCZ) convection dominated the weather conditions across the U.S.-Affiliated Pacific Islands (USAPI) during this USDM week (4/29/20-5/5/20). The near-equatorial trough persisted across Palau and Yap State, while trade-wind convergence and the ITCZ brought heavy rains to central and eastern Federated States of Micronesia (FSM) and the southern Marshall Islands (RMI). A couple of slow-moving, weak, and broad circulations, the first across Palau and western Yap State and the second later across Chuuk and Yap States, helped intensify the rainfall. Precipitation was also enhanced by trade-wind disturbances and smaller surface troughs that moved across Micronesia. A drier trade-wind regime dominated much of northern Micronesia, although a weak trade-wind disturbance brought localized rain to parts of the Marianas. South of the equator, a weak South Pacific Convergence Zone (SPCZ) moved over the Samoan Islands early in the week, followed by dry and stable air associated with a high pressure system.
Satellite-based estimates of 7-day precipitation (QPE) showed an extensive band of precipitation stretching eastward just north of the equator from Indonesia to the central Pacific, associated with the ITCZ, with another band extending southeastward past the Samoan Islands, associated with the SPCZ. Widespread 2+ inches of rain was analyzed from the equator to about 9 degrees N latitude across Palau and the FSM, and from about 2 to 7 degrees N across the RMI, with embedded areas of 4+ inches and (in the east) locally over ten inches. Patches of up to half an inch were notable over the southern Marianas. A northwest to southeast band of 2+ to locally 4 inches of rain stretched just west and south of the Samoan Islands, tapering to an inch or less to the northeast of the islands.
In the Republic of Palau, April rainfall was above average at most of the reporting stations, due to a slow-moving broad circulation over the region. The Palau International Airport (IAP) measured 10.85 inches of rain in April (median is 7.32 inches for this period). A few other locales included Melekeok (8.96 inches), Aimeliik (Nekken Forestry, 11.67 inches), and Peleliu (which recorded only 2.93 inches). Mandatory water conservation measures had been in effect prior to this event, as dry trade winds dominated the first 23 days of April. Thereafter, however, trade-wind convergence north of the equatorial troughs and embedded circulations located south of the main islands of Palau, increased rainfall across the Republic, with 4 out of 5 stations recording more than the 8-inch monthly minimum needed to meet most water needs. On April 24th, water levels in Peleliu were at 3.8 feet with maximum capacity at 5.4 feet. During the last three weeks (including this current one), Koror received well above the 2-inch weekly minimum with 3.05, 3.16, and 7.12 (4 days missing) inches, respectively. At the Palau IAP, 11.88 inches of rain has fallen this week, with the Koror COOP station reporting slightly more precipitation (12.37 inches). As a result of the recent heavy rain, the drought designation was improved D0 to "No Drought".
During the past 3 weeks (including this week), Guam received 0.53, 1.06, and 1.95 inches of rain, respectively. WFO Guam and Dededo both received beneficial rains (2.47 and 2.25 inches of rain in April, respectively) from a trade-wind disturbance, though the Commonwealth of the Northern Mariana Islands (CNMI) did not. During this drought week, a manual gauge on Saipan measured 0.21-inch, ASOS reported 0.13-inch, and the National Park Service (NPS) measured a meager 0.02-inch of rain. The last month in which Saipan reached or exceeded the 4-inch monthly minimum threshold was October 2019, when 12.93 inches of rain fell. In Tinian, 11 of the past 12 weeks were "dry", meaning the weekly minimum rainfall threshold (1-inch) was not being met. The one exception was the week ending March 31 when 1.36 inches of rain fell. The last "wet" month (where minimum water requirements were met, in this case, 4-inches) was November 2019, when 6.21 inches of rain fell. In Rota, the months of March and April 2020 were both dry, with neither month getting enough rainfall to meet most water requirements. No changes were made this week to the CNMI, although Guam's designation improved from D2 to D1 based on the recent rainfall.
In the Federated States of Micronesia (FSM), Nukuoro had a wet April with 16.57 inches of rain reported, which is more than double the 8-inch monthly minimum considered adequate to meet most water needs. In March, 17.40 inches of rain fell, again more than double the 8-inch minimum. From June 2019-April 2020, there were 8 wet months and only 3 dry months at Nukuoro. This week, 5.15 inches of rain have fallen. For North Fanif, this has been the first wet week (3.40 inches, 1 day missing) in the past 12 weeks. In April, 2.67 inches of rain fell, which is well below the 8-inch monthly minimum. The last wet month in North Fanif was December 2019, when 8.41 inches of rain fell. For the station of Fananu, no rainfall data was available to include in this week's analysis. In Rumung, 10 of the past 12 weeks were dry. Both March and April were very dry, with 1.83 and 2.05 inches of rain reported, respectively. At Ulithi, the last 12 weeks (including the current one), recorded insufficient precipitation to meet most water needs; however, this week's total is nearing the 2-inch weekly minimum at 1.80 inches (2 days missing). February, March, and April rainfall totals were all dry with 3.02, 1.74, and 1.96 inches reported, respectively. Woleai has already surpassed the 2-inch threshold this week to meet most water needs (3.98 inches). Woleai's precipitation totals for the last 3 months were: February, 4.74 inches, March 2.94 inches, and April, 5.81 inches, all of which fell short of the 8-inch monthly requirement. In Kapingamarangi, March and April were both wet with 14.52 and 17.06 inches of rain, respectively. This week has also been wet, with 2.90 inches measured.
The last 10 of 12 weeks have been wet in Kosrae, with 6.74 inches (1 day missing) this week. Each month, from June 2019 through April 2020 was wet, with April by far the wettest, with 29.87 inches reported. This is 3.5 times the minimum required for the month, and approaches 2.5 feet of rain! Lukunor, Pingelap, and Pohnpei have also been wet recently. The respective rainfall totals for this week were 3.42 inches (1 day missing), 6.20 inches, and 12.96 inches. The respective rainfall totals for March and April were: Lukunor (12.06 and 11.63 inches), Pingelap (14.90 and 22.38 inches), and Pohnpei (9.06 and 23.03 inches). Incidentally, with only one exception, each month from June 2019 through April 2020 was wet in Pohnpei; the exception being January 2020, with a not-so-dry 7.54 inches. Chuuk was wet this week (5.64 inches, 1 day missing), but received 5.29 and 8.13 inches of rainfall in March and April 2020, respectively, one of which fell short of the 8-inch monthly requirement to meet most water needs. Considering that April's monthly rainfall met the minimum requirement, and this week's total is more than double the weekly minimum, Chuuk's designation was improved from D1 to D0, though lingering impacts are anticipated. In Yap, 2.22 inches of rain fell (2 days missing) this week. The months of January, February, March, and April 2020 were all dry, though the preceding months of June through December 2019 were wet in Yap. Apart from Chuuk, no other changes were made to the regional depiction in the FSM.
In the Republic of the Marshall Islands (RMI), Ailinglapalap reported 2.74 inches of rain this week. The period January through March 2020 was dry, with monthly totals of 5.14, 3.06, and 3.83 inches, respectively. In contrast, April was wet, with 8.98 inches. Jaluit had 0.79-inch of rain this week. Similar to Ailinglapalap, Jaluit experienced dry conditions during the January through March time frame, with 5.61, 4.22, and 7.58 inches, respectively, and April was wet with a total of 12.19 inches. In Wotje, the rainfall total this week was 0.66-inch. April's accumulation was 5.30 inches. The last month in which rainfall reached or exceeded the 8-inch threshold was November 2019, when 9.62 inches was recorded. Kwajalein received 0.69-inch of rain this week, which is well shy of the 2-inch weekly minimum. The April accumulation was 7.64 inches. Like Wotje, the last month that had sufficient rainfall to address most water needs (8-inches or greater) was November 2019, when 12.53 inches of rain fell. In Utirik, 10 of the past 11 weeks registered dry. The one exception was the week ending April 14th, when 2.38 inches of rain fell. The last month that Utirik's precipitation total reached or exceeded 8-inches was November 2019, when 12.30 inches of rain was measured. Mili received 7.78 inches of rain this week. Nine of the past 12 weeks were also wet. Eight of the past 11 months were wet in Mili (where all totals not only exceeded 8-inches, but in this case, exceeded 12 inches). Majuro received 2.27 inches of rain this week. For the 11-month inclusive period (June 2019 through April 2020), 8 of those months were wet. As of May 6, 2020, the Majuro reservoir storage of nearly 28.0 million gallons is near 77.8 percent of capacity. At its lowest in April (on the 17th), storage was near 25.7 million gallons. No changes were made to the drought depiction across the RMI this week.
In American Samoa, Pago Pago received 4.10 inches of rain this week, which was over four times the 1-inch weekly minimum water requirement. The last 5 months at Pago Pago have been exceedingly wet, with totals of 17.93 inches in December 2019, 21.98 inches in January 2020, 32.73 inches in February, 8.18 inches in March, and 15.56 inches of rain in April 2020. Other reports from American Samoa include Siufaga Ridge and Toa Ridge (both are National Park Service sites) with 1.82 and 1.31 inches of rain, respectively. Drought free conditions therefore continue at Tutuila.
Virgin Islands
During this past drought week (April 29-May 5, 2020), St. Thomas received 0.29-inch of rain at Anna's Retreat (CoCoRaHS VI-ST-1). At the Cyril E. King Airport, there has been no rainfall measured for the month of May so far. From April 2-May 1 (which approximates the month of April), 0.63-inch of rain was reported at the King Airport. Other rainfall statistics for this location include 3.52 inches since March 1, 2020, which is 1.20 inches below average for the period. The Year-To-Date (YTD) precipitation total stands at 8.47 inches, which is just 0.06-inch below average. The (provisional) USGS Grade School 3 Well level is now about 11 feet below the land surface; a considerable drop since the end of March when it was near 7 feet below the land surface. The SPI values at 1,3,6,9, and 12 months at Charlotte Amalie are: -0.87, -0.03, -0.25, -0.43, and -0.00. Drought status for St. Thomas remains unchanged at D0(S).
A volunteer observer on St. John's Windswept Beach reported 0.48-inch of rain this week, and 0.77-inch in the month of April. During the 37-year (1984-2020) period of record, there were eight Aprils which had less than an inch of rainfall. These are: 1) 0.09-inch in 1995, 2) 0.48-inch in 1997, 3) 0.52-inch in 2004, 4) 0.55-inch in 2015, 5) 0.73-inch in 1988, 6) 0.77-inch in 2020 and in 2000 (tie), and 7) 0.79-inch in 2019. The Susannaberg DPW3 Well on St. John was just over 10 feet below the land surface at the beginning of March; since then there has been a steady decline to its present value of 14 feet below the land surface. Drought status for St. John remains unchanged at D0(S).
On the island of St. Croix, 0.13-inch of rain was reported at Christiansted (CoCoRaHS VI-SC-8, 1.8 ESE) this week. From April 2-May 1, 0.50-inch of rain was recorded. Another location in Christiansted (CoCoRaHS VI-SC-9, 4.1 ESE) received even less precipitation, with 0.07-inch this week, and 0.27-inch for the April 2-May 1 period. At the Henry Rohlsen Airport, 0.20-inch of rain fell so far in May. Since March 1, rainfall totaled 4.57 inches, which is 0.26-inch above average for the same period. The YTD total is 8.32 inches, which is 0.22-inch above average. Another location that reported April 2020 rainfall is East Hill, with 1.07 inches (normal is 2.19 inches for the period). Mostly dry weather continues at the UVI sheep research facility on St. Croix (17.7160N, 64.7958W). In April, the facility measured 0.89-inch of rain. For this drought week, the total was 0.19-inch of rain. The Adventure 28 Well has had a water level that varied between 19.7-20.2 feet below the land surface since March 1. The SPI values (1,3,6,9,12-months) at Christiansted are: -0.83, +0.30, -0.84, -1.34, -1.02. Drought status for St. Croix remains unchanged at D0(S,L),which reflects short-term dryness and longer-term impacts on wells and other hydrologic considerations.
Looking Ahead
On May 7 and 8, a low pressure system is forecast to track rapidly east across the central and eastern U.S. with a swath of moderate rainfall (0.5 to 1 inch) across the central Great Plains, middle to lower Mississippi Valley, Ohio Valley, and mid-Atlantic. Behind this low pressure system, much below normal temperatures are forecast to overspread the east-central U.S. with at least a light freeze likely across the Great Lakes and eastern Corn Belt. Frost may extend south to the Shenandoah Valley and southern Appalachians. This late frost and/or freeze could damage vegetation in areas where the growing season has started. Meanwhile, a wave of low pressure is expected to develop along the tail end of a stationary front which could bring beneficial rainfall to southern Florida. The early and prolonged heat wave is forecast to ease across the Desert Southwest during the second week of May.
The CPC 6-10 day outlook (May 12-16) indicates that unseasonably cool temperatures are likely to persist into mid-May across the Corn Belt and much of the eastern U.S. A cooling trend is forecast across the western U.S., although above normal temperatures remain favored across the southern Rockies and southern Great Plains. The largest probabilities of above normal temperatures are forecast across Alaska. The evolving upper-level pattern favors above normal precipitation across much of the Great Plains and Mississippi Valley. These increased chances of above normal precipitation also cover much of the West.
Author(s):
Brad Pugh, NOAA/CPC
Anthony Artusa, NOAA/NWS/NCEP/CPC
Dryness Categories
D0 Abnormally Dry—used for areas showing dryness but not yet in drought, or for areas recovering from drought.
Drought Intensity Categories
D1 Moderate Drought
D2 Severe Drought
D3 Extreme Drought
D4 Exceptional Drought
Drought or Dryness Types
S Short-Term, typically less than 6 months (e.g. agricultural, grasslands)
L Long-Term, typically greater than 6 months (e.g. hydrologic, ecologic)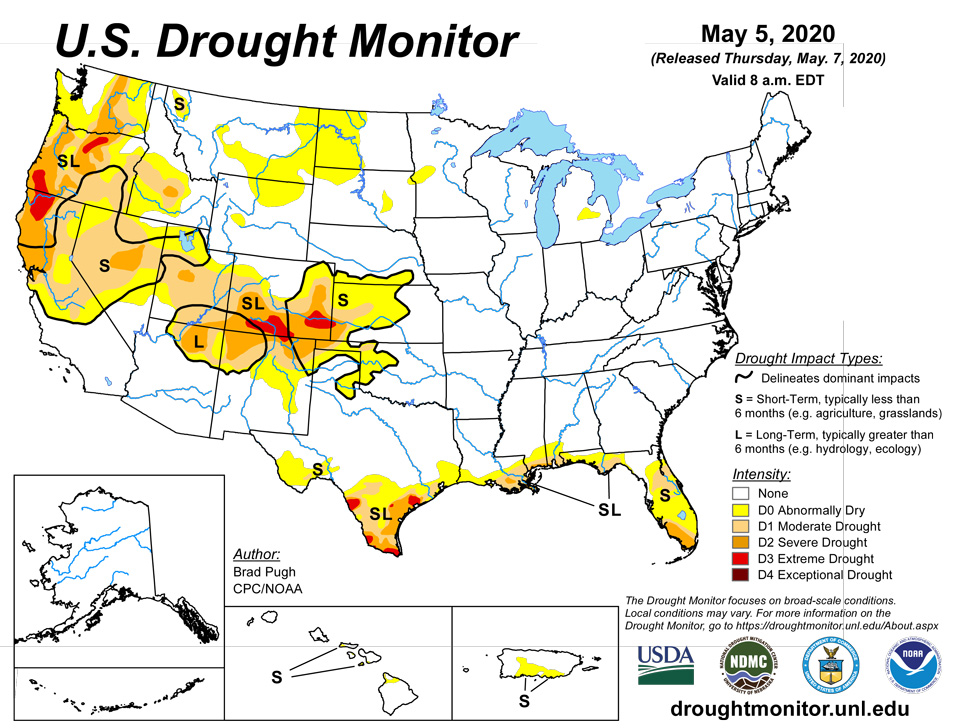
Source: National Drought Mitigation Center

