


California and National Drought Summary for May 19, 2020
Summary
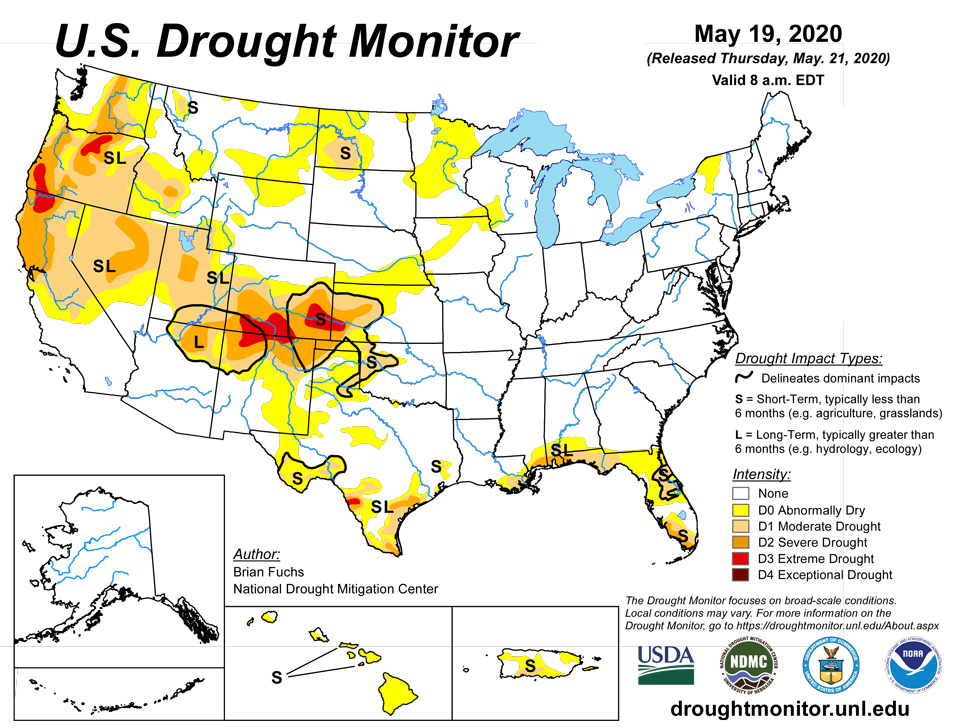
May 21, 2020 - The southern Plains, Mississippi Valley, Pacific coast and south Florida were the recipients of the greatest rains this week, with some areas of Louisiana and south Florida recording 5+ inches of rain for the week. Dryness over the East and West was also coupled with warmer than normal temperatures over the West. Temperatures were 3-6 degrees above normal over the Nevada, Utah, Colorado and New Mexico regions while the northern Plains was 6-9 degrees below normal. Many dry areas of the Plains and Midwest have not had drought development due to the unseasonably cool temperatures in May.
Northeast
Cooler than normal temperatures dominated the region, with most areas at least 2-4 degrees below normal for the week and the northernmost portions of the region 6-8 degrees below normal. Precipitation was mixed for the week, with the southern areas remaining dry while portions of the northern areas of the region recorded normal to slightly above normal precipitation. Ongoing dryness in portions of northeastern New York did allow for the introduction of D0 this week, which was based upon the short-term indicators.
Southeast
For the region as a whole, the week was mostly dry. Spotty precipitation throughout the area did bring near-normal precipitation with it, but those who missed out were mainly dry for the week. Portions of southern Mississippi, southern Florida, and the panhandle of Florida did see 200+ percent of normal precipitation. Temperatures were cooler than normal over most of the area with most locations right at normal to 3-6 degrees below normal for the week. Due to the significant rains in south Florida, a full category improvement was made as the short-term dryness has been improved upon greatly over the last several weeks. The drought area of central Florida was split from that of southern Florida where lingering abnormally dry conditions were eliminated. With dryness over the last several weeks, abnormally dry conditions again returned to northern Florida into southern Georgia. In the panhandle region, abnormally dry conditions and moderate drought were expanded northward in response to short-term dryness. The dryness gradient remained in place over portions of southern Mississippi and southern Alabama with the severe drought areas pushing slightly northward this week. The areas of the region with sandier soils with lower capacity to hold moisture are in need of precipitation to stave off a widespread expansion of abnormally dry conditions. The cooler temperatures have lessened demand, but that can change rapidly in this region.
Midwest
Cooler than normal conditions again dominated the region with temperatures 2-4 degrees below normal in the southern portions of the area and 4-6 degrees below normal in the north. A slow-moving storm system affected the eastern areas of the region, with many areas recording 2-3 inches of rain with locally greater amounts. There are several dry pockets in the region, and areas of Wisconsin, Minnesota and northeast Iowa all had abnormally dry conditions expand this week due to the dryness over the short-term. Abnormally dry conditions were also expanded over southeast Iowa and into northwest Missouri. The lack of above-normal temperatures has kept drought from developing, but conditions are being monitored.
High Plains
Temperatures over the region were generally 6-8 degrees below normal, with portions of Colorado and Wyoming the outliers with temperatures 2-4 degrees above normal. Most of the region was fairly dry for the week with many areas below normal for precipitation during one of the wettest months of the year. Portions of western South Dakota, western Nebraska, northeast Colorado, and southeast Kansas did record precipitation that was well above normal with 150-400 percent of normal for the week. With the dryness throughout much of the area, abnormally dry conditions were expanded and moderate drought was introduced to portions of western North Dakota and into South Dakota. Abnormally dry conditions were expanded through central and southeast Nebraska and portions of northeast Kansas. These areas will be ripe for drought development without rain, especially if temperatures become more seasonable. Northeast Colorado did see some improvement due to recent heavy rains as the severe and moderate drought as well as the abnormally dry conditions shifted south slightly. The abnormally dry pocket in southeast South Dakota was also removed this week after some locally heavy rain.
South
Temperatures over the region were near normal to slightly below normal where the most precipitation took place. Areas of west Texas were 3-6 degrees above normal for the week. It was an active week over much of the region for precipitation, which allowed for improvements over much of the area. Most of southern, central, and eastern Texas as well as southern Louisiana had a full category improvement as these areas recorded the greatest precipitation, which shifted the drought indices, allowing improvement to take place. Some areas of southern Louisiana had 10+ inches of radar-estimated rainfall. Areas of the Texas and Oklahoma panhandles, west Texas, and southwest Oklahoma did not receive any of this rain and conditions continued to deteriorate. Portions of western Oklahoma have had all winter wheat zeroed out as producers did not get a crop to grow and did not even see enough growth for grazing purposes. In southwest Oklahoma, moderate drought and abnormally dry conditions expanded this week. Some areas of the Texas panhandle did see improvements to the abnormally dry conditions while other areas missed out on the rain and saw conditions decline. Abnormally dry conditions were also expanded over west Texas this week.
West
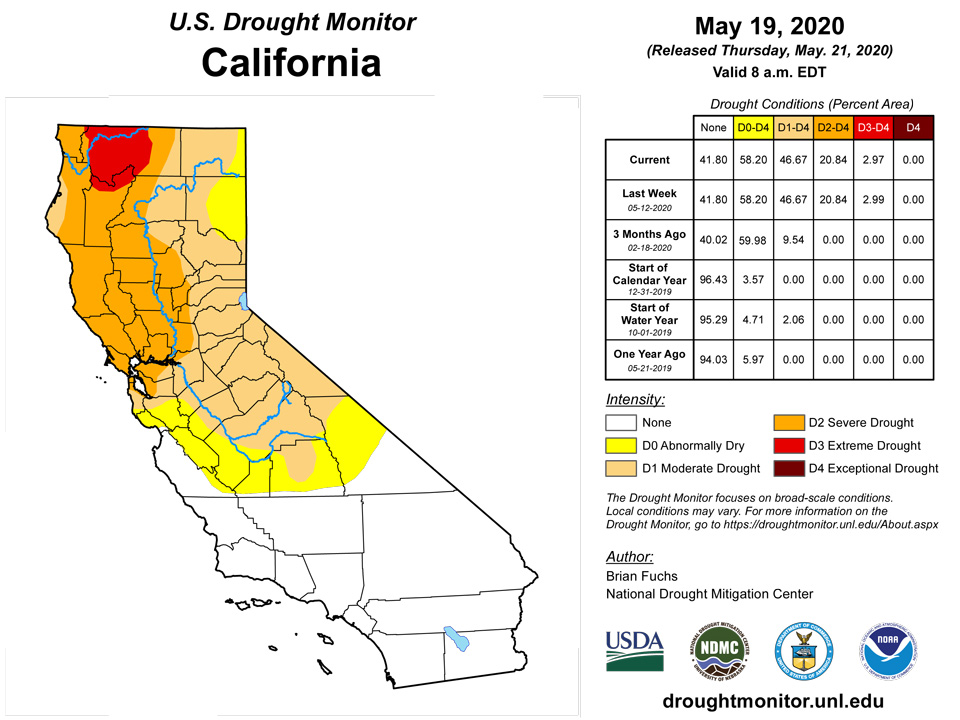
Most of the region was dry for the week with the exception of the Pacific Northwest and northern California, where 150-200 percent of normal precipitation was recorded. Temperatures for the region were 3-6 degrees above normal over central Nevada, Utah, Colorado, and eastern New Mexico, with most of the rest of the region near normal to 3 degrees below normal for the week. In the Pacific Northwest, the recent rains helped to slow down further degradation in Oregon and Washington, with portions of the abnormally dry areas of western Washington improved this week. Oregon has some improvement to the severe and extreme drought over the southwest portions of the state but did see moderate drought expand slightly over portions of the western areas of the state. Conditions in Nevada and Utah continue to decline with an intensification of moderate and severe drought over northern portions of both states as the short-term dryness is starting to combine with the long-term issues in these areas. New Mexico had an expansion of moderate, severe, and extreme drought in the northern portions of the state as some of the recent dryness is coupled with longer-term issues in the drought indicators. Abnormally dry conditions were expanded over most of eastern New Mexico as a result of short-term issues. Southwest Colorado had an expansion of extreme and severe drought conditions while moderate drought was expanded northward over the central portion of the state.
Alaska, Hawaii, and Puerto Rico
Hawaii has been dry recently, which allowed the expansion and introduction of abnormally dry conditions over most of the state. On Kauai, abnormally dry conditions were added to the southern half of the island. In Oahu, abnormally dry conditions were expanded to cover the southwestern half of the island. Abnormally dry conditions were expanded to cover the rest of Maui and the Big Island. On Molokai, moderate drought was expanded eastward to Kaunakakai and on the Big Island, moderate drought was pushed to the east to include the leeward slope of the Kohala Mountains and south to Waikoloa. In Puerto Rico, abnormally dry conditions were expanded to the north with a new area introduced in the northeast part of the island. With short-term dryness impacting the southern portions of the island, a new area of moderate drought was added this week. No changes were made in Alaska this week.
Pacific Islands
The weather conditions across the U.S.-Affiliated Pacific Islands (USAPI) during this USDM week (5/13/20-5/19/20) were dominated by trade winds in Micronesia and a relatively stable and dry air mass over American Samoa. In Micronesia, the trade-wind regime brought dry weather to the northern latitudes. In the southern latitudes, faster trade winds overcame slower winds, with the resulting trade-wind convergence generating showers. The trade-wind convergence was accompanied by surface troughs, with the surface features interacting with upper-level divergence associated with a couple upper-level lows. The Marianas were mostly dominated by the dry trade-wind regime, except surface troughs and a weak tropical disturbance brushed southern parts, primarily Guam. A surface trough took up residence southwest of the Samoan Islands. Even though a dry and stable air mass dominated American Samoa, some moisture advected from the trough was enhanced by orographic lifting to produce scattered precipitation.
Satellite-based estimates of 7-day precipitation (QPE) showed a broken band of 2+ inches of precipitation stretching across the Pacific between the equator and 10 degrees North latitude associated with the Inter-Tropical Convergence Zone (ITCZ). Another broken band stretched southeastward from Indonesia to southwest of the Samoan Islands as the South Pacific Convergence Zone (SPCZ). In Micronesia, the band meandered across the Federated States of Micronesia (FSM), stretching an arm toward Guam, and teasing parts of the Marshall Islands (RMI). The SPCZ was comprised of splotches of 1+ inches of rain around but mostly southwest of the Samoan Islands.
In the Republic of Palau, based on data through May 19, the Palau International Airport station reported 2.26 inches of rain this week (which is above the weekly minimum of 2 inches needed to meet most water needs) and the COOP station at Koror recorded 3.22 inches. The monthly totals were well above the 8-inch monthly minimum: 18.24 inches at the Palau IAP and 17.91 inches at Koror COOP. Jellyfish Lake continues to recover from the drought of a year ago. With April and May wet, D-Nothing continued at Palau.
This week was dry (below the 1-inch weekly minimum needed to meet most water needs) on Guam and very dry across the Commonwealth of the Northern Mariana Islands. Localized showers resulted in a range of rainfall reports, with the Guam airport recording 0.92 inch of rain for the week, while Tinian recorded 0.16 inch and Dededo 1.02 inches (with 2 days missing). Dryness was more widespread across the CNMI, with Rota recording 0.37 inch of rain, Saipan International Airport 0.28, Saipan ASOS station 0.21, and the NPS automated station on Saipan 0.11. Based on data received so far in May, the Saipan IAP had the driest May, April-May, March-May, February-May, and January-May in the 40-year record, but second wettest June-May (last 12 months). D3-SL continued for Saipan, D3-S continued at Rota, and D1-S continued for Guam.
In the Federated States of Micronesia, Fananu (which has been missing for several months) and Pingelap (missing this week) could not be analyzed and are not plotted. The week was dry at the western and southern stations in the FSM, but wet from central Yap State to Kosrae State. In the west, less than an inch of rain was reported at Yap (0.58) and Rumung (0.62), and less than an inch fell in the south at Kapingamarangi (0.44) and Lukonor (0.28). But well over 4 inches was recorded at Pohnpei (4.53) and Mwoakilloa (4.78), with over 2 inches at Chuuk (2.08) and Kosrae (3.31). In Yap State, Ulithi received 1.19 inches while Woleai got 2.85 inches.
The recent rain at Woleai has not improved conditions significantly. Impact reports received since last week’s analysis indicated that water catchment tanks were still less than half full and there was low available drinking water. Even though 8.91 inches of rain fell at Woleai so far in May, March-May 2020 still ranked as the 8th driest March-May on record, January-May ranked as the 7th driest, December-May as the 8th driest, and June-May as the 4th driest. The USDM status at Woleai was worsened back to D2-S based on this recent information. No other changes were made in the FSM. Reservoir water levels on Yap remain low. Although aquifer levels have shown some recovery from the recent rains, well levels in Eyeb Valley and Monguch Valley show a steady groundwater decline in the Tomil Volcanics Aquifer for at least the last 4 to 5 months. With January-May ranking as the 5th driest such period on record, D2-S continued at Yap. D1-S continued at Ulithi, D0-S continued at Chuuk where February-May ranked as the 5th driest, and D-Nothing continued at the rest of the stations. This week marked the second consecutive dry week (below the 2-inch weekly minimum needed to meet most water needs) at Kapingamarangi, and Nukuoro barely met the 2-inch minimum with 2.03 inches. Based on data so far, May 2020 ranked as the second driest May on record for Kapingamarangi and third driest for Nukuoro. December-May ranked 5th driest for Kapingamarangi and February-May ranked 6th driest for Nukuoro. The USDM status continued at D-Nothing for these two stations, but they will be watched for possible D0-S if the dryness continues, especially Kapingamarangi where only 2.88 inches of rain has been reported so far in May.
In the Marshall Islands, no data was received from Mili or Utirik this week so an analysis could not be made for these stations. Majuro was wet (more than the 8-inch monthly minimum needed to meet most water needs) in April (13.95 inches) and each of the last 4 weeks, and the reservoir level has risen to above the 80% threshold for concern. The May 19 reservoir level was 31.31 million gallons, which is 87% of the 36 million gallon maximum capacity, and most of the 1000- to 1500-gallon water catchments on the island were now in the range of 80-90% full. The rising reservoir levels have prompted the Majuro Water and Sewer Company to end water rationing from the Treatment Plant C and Laura Plant. As a result of these changes, the USDM status at Majuro was improved to D-Nothing. Jaluit was wet (3.66 inches) this week but the other stations were dry. With each of the last six months dry, the status at Wotje was changed from D3-S to D3-SL and the status at Kwajalein was changed from D1-S to D1-SL. No other changes were made in the RMI.
Localized convective/orographic showers in American Samoa caused a spread in rainfall totals, with 0.62 inch recorded this week at the Toa Ridge automated station, 2.00 inches at the Siufaga Ridge automated station, and 1.84 inches at Pago Pago. This brings the May monthly total at Pago Pago to 4.73 inches, which is above the 4-inch monthly minimum and continues a string of wet to very wet months. D-Nothing continues at Tutuila.
Virgin Islands
During this USDM week (5/13/20-5/19/20), weak ridging and a high zonal flow maintained dry and stable conditions at the upper-levels over the U.S. Virgin Islands (USVI) region. Surface high pressures over the western Atlantic and over the east-central Atlantic promoted an easterly surface wind flow with embedded patches of moisture.
Radar-based estimates of rainfall for the 7 days ending at 12z on Tuesday depicted half an inch or more of rain over parts of St. John and St. Thomas and across the western coast of St. Croix, with the rest of the islands receiving little to no rain.
Showers were scattered and localized on St. Croix, with 0.62 inch of rain falling this week at East Hill, but only 0.15 inch and 0.07 inch, respectively, at the CoCoRaHS stations at Christiansted 1.8 ESE and 4.1 ESE, 0.13 inch at the UVI Sheep Farm station, and 0.03 inch at the Rohlsen AP. May monthly totals (based on data received so far) ranged from 0.99 inch at East Hill and two-thirds of an inch (0.62) at the UVI Sheep Farm, to half an inch at Christiansted 1.8 ESE (0.54) and Rohlsen AP (0.52) and a third of an inch (0.32) at Christiansted 4.1 ESE. The May monthly normal precipitation for Rohlsen is 4.15 inches. Rohlsen has been drier than normal for each of the last seven weeks, with the April 1-May 19 total precipitation of 1.13 inches ranking 2020 as the sixth driest such period out of a 61-year record. This translates to the 10th percentile in the historical record, which is at the D2 USDM level. At the end of March, the year-to-date precipitation was 2.16 inches above normal; the year-to-date anomaly went negative in May, reaching 1.47 inches below normal on May 19. The Standardized Precipitation Index (SPI) values for the Rohlsen/Hamilton Airport and East Hill stations changed little compared to last week. East Hill SPI is at D0 levels for the last 1, 9, and 12 months, but the Rohlsen AP SPI values are at the D1 level for the last 1 and 12 months, the D0 level at the 6-month time scale, and D3 level for the last 9 months. Current groundwater data is not available for the USGS Adventure 28 well; the latest data is through April 25, 2020, but it was in steady decline for a month to that point. The USDM status was worsened to D1-SL for St. Croix.
On St. Thomas, a third of an inch (0.38) of rain was reported by the CoCoRaHS station at Anna’s Retreat this week, bringing the monthly total to 0.61 inch. But only a trace of rain has fallen at the King AP for all of May so far. The May monthly normal for King AP is 3.06 inches. With 0.92 inch in April, this ranks April 1-May 19, 2020 at the airport as the third driest such period out of 57 years of data. This translates to the 5th percentile in the historical record, which is at the D3 USDM level. At the end of March, the year-to-date precipitation was 2.32 inches above normal; the year-to-date anomaly went negative in May, reaching 1.52 inches below normal on May 19. The SPI at King AP was at the D0 level for the last 3 and 9 months, but at the D3 level for the last month. The USGS Grade School 3 well level has been steadily declining since the end of March, and is now the lowest it’s been since the end of August 2019. The USDM status was worsened to D1-S for St. Thomas.
On St. John, the station at Windswept Beach reported 0.61 inch of rain this week, bringing the May total (through the 18th) to 1.11 inches. The long-term average for May is 4.54 inches. Dividing by 4 gives a long-term weekly average of about 1.14 inches. Based on these statistics, this week marks the eighth consecutive week with below-average precipitation for Windswept Beach. The SPI is at the D0 level for the last month, but at the D1 level for the last 3 and 9 months. The USGS Susannaberg well level has been steadily declining since the end of January, and is now the lowest it’s been since August 2019. As a consequence of the precipitation and groundwater data, the USDM status for St. John was worsened to D1-S.
Looking Ahead
Over the next 5-7 days, it is anticipated that the Plains states will remain in an active pattern, with the greatest precipitation to occur over portions of Nebraska, Kansas, Oklahoma and into Texas. The Mid-Atlantic is also anticipating precipitation amounts of up to 3-4 inches during the period. Dry conditions will dominate the Southwest and into most of the Pacific Northwest and West Coast. Temperatures during this period will be near normal over most of the country with below-normal temperatures over the Northwest and northern Rocky Mountains. Areas that receive the most rain will also have the coolest temperatures over the Mid-Atlantic into the Northeast.
The 6-10 day outlooks show a high probability of greater than normal temperatures over the West, northern Plains, Midwest, Northeast and Alaska. The greatest probabilities are over the Southwest. There are also high probabilities of cooler than normal temperatures over the southern Plains and into the South. The precipitation outlook has the northern Plains and Pacific Northwest with the greatest likelihood of below-normal precipitation. The best chances of above-normal precipitation will be over the South and Southeast but may also include the Midwest and Southwest.
Author(s):
Brian Fuchs, National Drought Mitigation Center
Richard Heim, NOAA/NCEI
Dryness Categories
D0 Abnormally Dry—used for areas showing dryness but not yet in drought, or for areas recovering from drought.
Drought Intensity Categories
D1 Moderate Drought
D2 Severe Drought
D3 Extreme Drought
D4 Exceptional Drought
Drought or Dryness Types
S Short-Term, typically less than 6 months (e.g. agricultural, grasslands)
L Long-Term, typically greater than 6 months (e.g. hydrologic, ecologic)
Source: National Drought Mitigation Center

